| Param | Original file | Final file |
|---|---|---|
| Filename | modeM0/AS1A09_104T02_9000003826_26473cztM0_level2.evt | modeM0/AS1A09_104T02_9000003826_26473cztM0_level2_quad_clean.evt |
| Size (bytes) | 522,391,680 | 109,748,160 |
| Size | 498.2 MB | 104.7 MB |
| Events in quadrant A | 3,277,837 | 763,307 |
| Events in quadrant B | 3,299,716 | 764,004 |
| Events in quadrant C | 3,696,038 | 706,163 |
| Events in quadrant D | 5,135,135 | 665,948 |
| Mode M0 | |||
|---|---|---|---|
| Quadrant | BADHDUFLAG | Total packets | Discarded packets |
| A | 0 | 13623 | 0 |
| B | 0 | 13626 | 0 |
| C | 0 | 14932 | 0 |
| D | 0 | 19333 | 0 |
| Mode M9 | |||
|---|---|---|---|
| Quadrant | BADHDUFLAG | Total packets | Discarded packets |
| A | 0 | 13 | 0 |
| B | 0 | 13 | 0 |
| C | 0 | 13 | 0 |
| D | 0 | 13 | 0 |
| Quadrant | Total seconds | Saturated seconds | Saturation percentage |
|---|---|---|---|
| A | 6077 | 61 | 1.003785% |
| B | 6078 | 70 | 1.151695% |
| C | 6078 | 149 | 2.451464% |
| D | 6077 | 601 | 9.889748% |
Noise dominated data is calculated using 1-second bins in cleaned event files. If a bin has >2000 counts, and if more than 50% of those come from <1% of pixels, then it is considered to be noise-dominated and hence unusable.
| Quadrant | # 1 sec bins | Bins with >0 counts | Bins with >2000 counts | High rate bins dominated by noise | Noise dominated (total time) | Noise dominated (detector-on time) | Marked lightcurve |
|---|---|---|---|---|---|---|---|
| A | 7382 | 6078 | 0 | 0 | 0.00% | 0.00% | 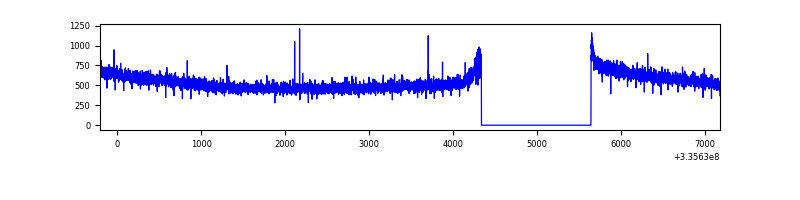 |
| B | 7383 | 6078 | 1 | 1 | 0.01% | 0.02% | 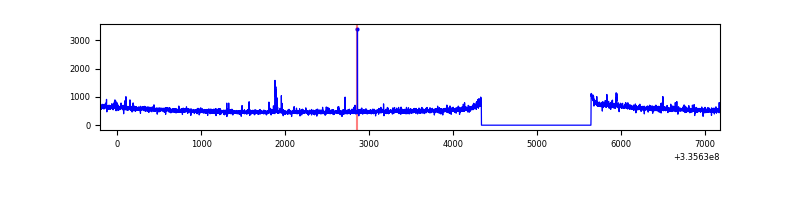 |
| C | 7383 | 6079 | 28 | 28 | 0.38% | 0.46% | 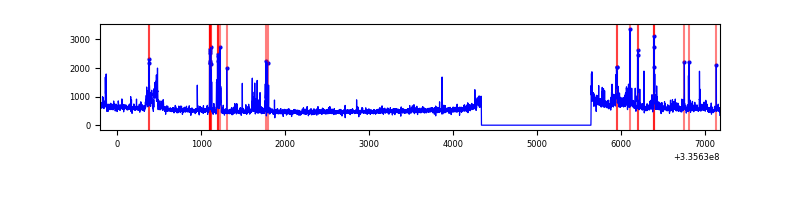 |
| D | 7382 | 6078 | 505 | 505 | 6.84% | 8.31% | 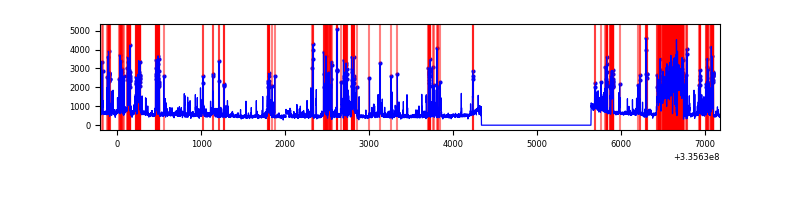 |
Top three noisy pixels from each quadrant. If the there are fewer than three noisy pixels in the level2.evt file, extra rows are filled as -1
| Pixel properties | Quadrant properties | ||||||
|---|---|---|---|---|---|---|---|
| Quadrant | DetID | PixID | Counts | Sigma | Mean | Median | Sigma |
| A | 13 | 254 | 10067 | 54.68 | 850 | 837 | 168.8 |
| A | 0 | 226 | 7379 | 38.75 | 850 | 837 | 168.8 |
| A | 3 | 137 | 7077 | 36.97 | 850 | 837 | 168.8 |
| B | 0 | 190 | 23921 | 148.22 | 831 | 814 | 155.9 |
| B | 0 | 244 | 20537 | 126.52 | 831 | 814 | 155.9 |
| B | 12 | 111 | 17691 | 108.26 | 831 | 814 | 155.9 |
| C | 3 | 233 | 339797 | 1860.58 | 788 | 796 | 182.2 |
| C | 14 | 238 | 129612 | 707.0 | 788 | 796 | 182.2 |
| C | 4 | 254 | 84489 | 459.34 | 788 | 796 | 182.2 |
| D | 7 | 80 | 1426921 | 7658.0 | 780 | 762 | 186.2 |
| D | 12 | 233 | 380062 | 2036.71 | 780 | 762 | 186.2 |
| D | 1 | 52 | 180850 | 967.01 | 780 | 762 | 186.2 |
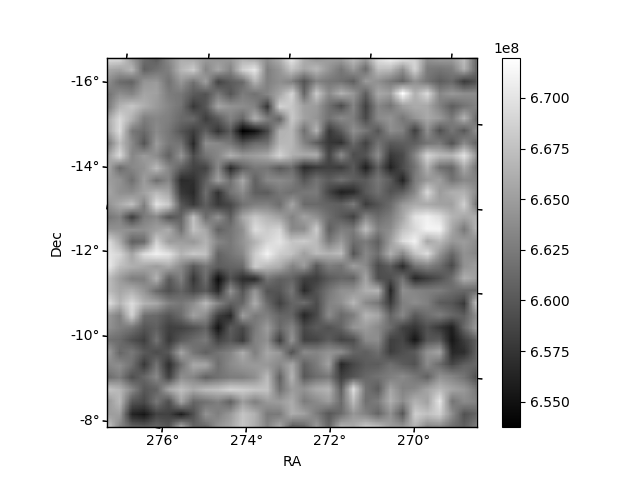
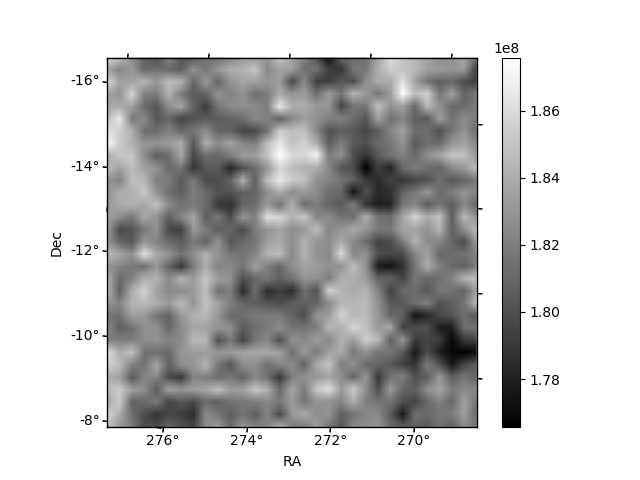
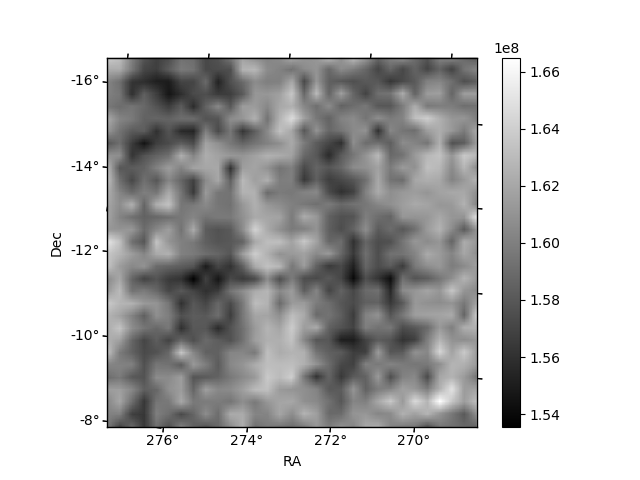
Histogram calculated using DETX and DETY for each event in the final _common_clean file
| Quadrant A | 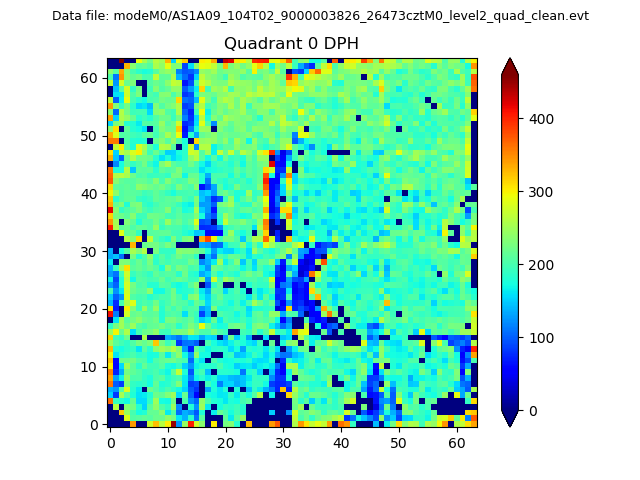 |
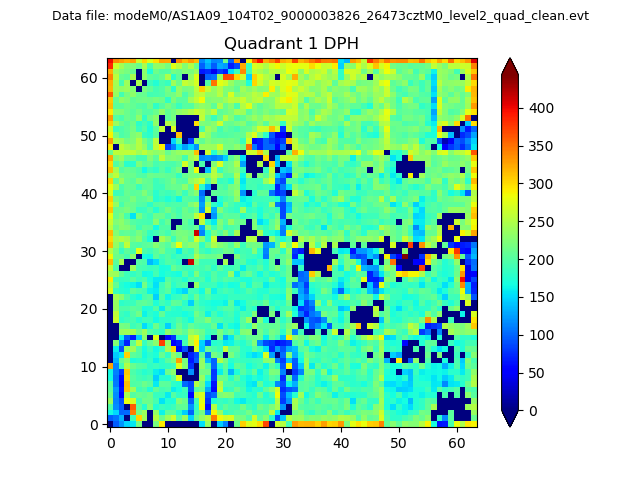 |
Quadrant B |
|---|---|---|---|
| Quadrant D | 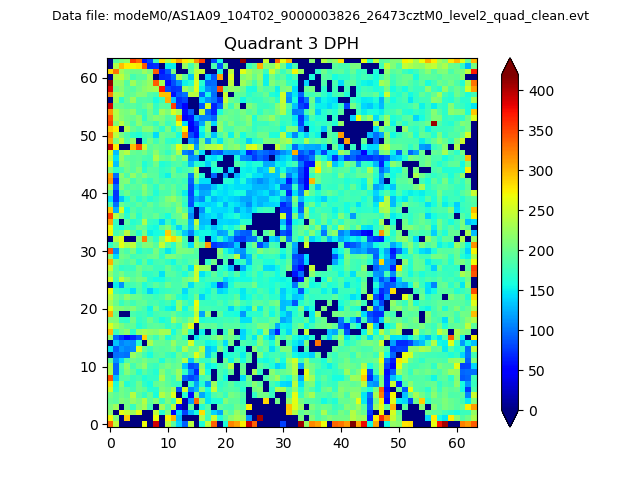 |
 |
Quadrant C |
| Plot type | Count rate plots | Images |
|---|---|---|
| Comparison with Poisson distribution Blue bars denote a histogram of data divided into 1 sec bins. Red curve is a Poisson curve with rate = median count rate of data. |
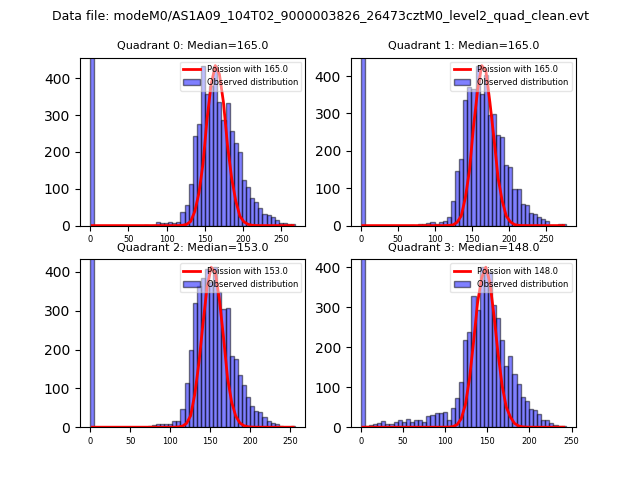 |
 |
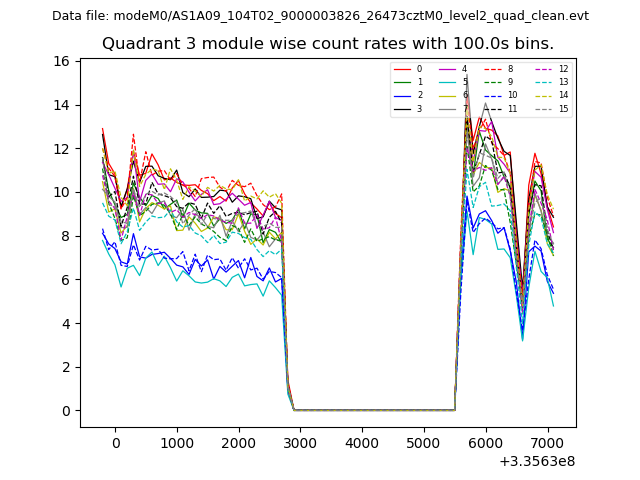
| Quadrant-wise count rates Data is divided into 100 sec bins |
 |
|
| Module-wise count rates for Quadrant A Data is divided into 100 sec bins |
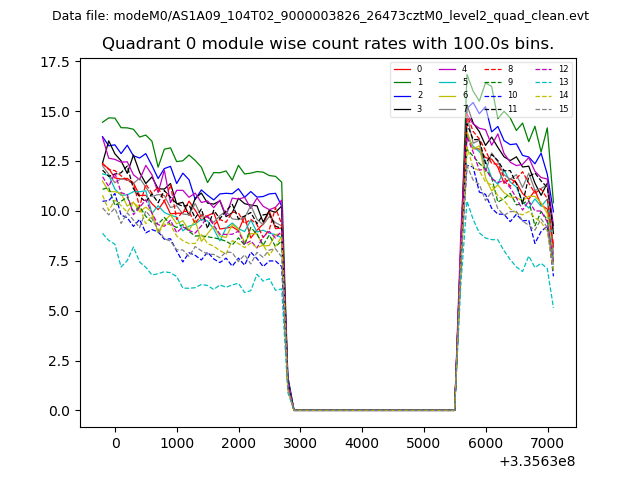 |
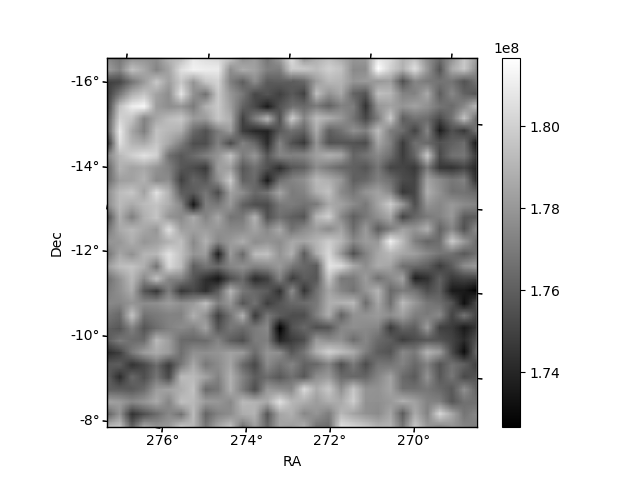 |
| Module-wise count rates for Quadrant B Data is divided into 100 sec bins |
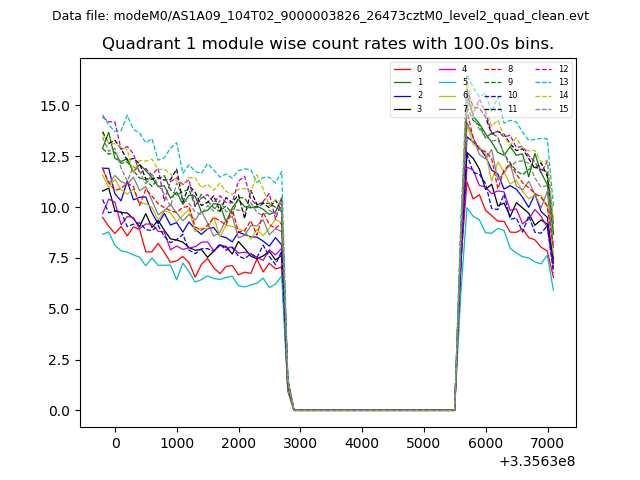 |
 |
| Module-wise count rates for Quadrant C Data is divided into 100 sec bins |
 |
 |
| Module-wise count rates for Quadrant D Data is divided into 100 sec bins |
 |
 |
| Parameter | Plot |
|---|---|
| CZT HV Monitor | 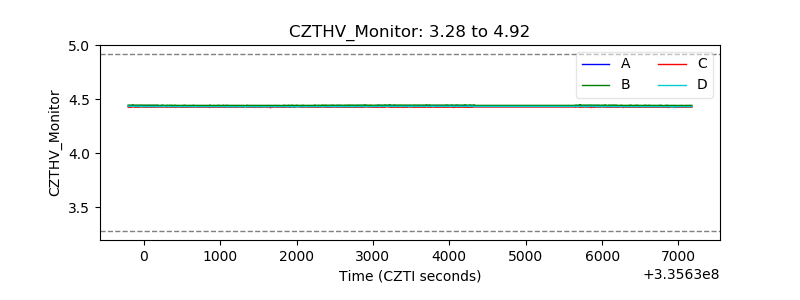 |
| D_VDD | 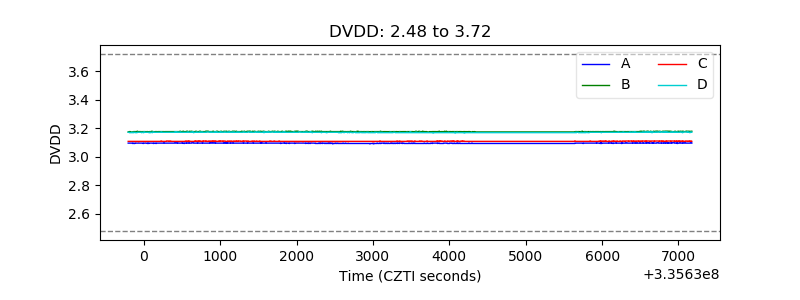 |
| Temperature 1 | 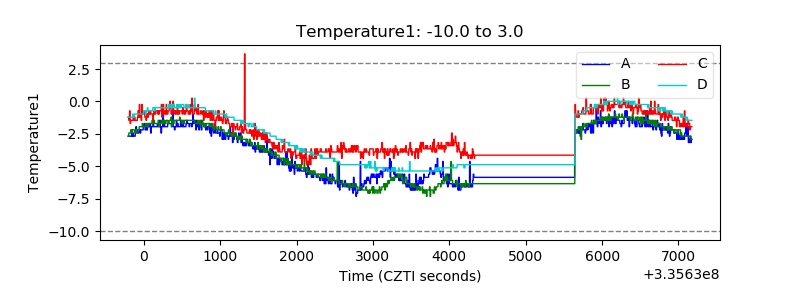 |
| Veto HV Monitor | 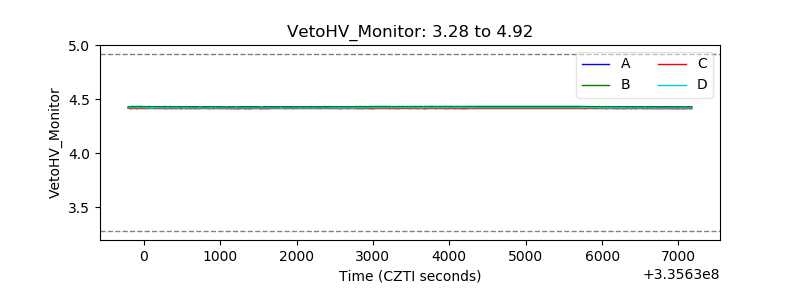 |
| Veto LLD | 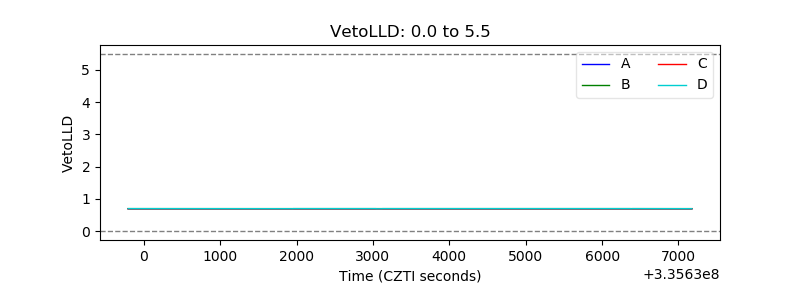 |
| Alpha Counter | 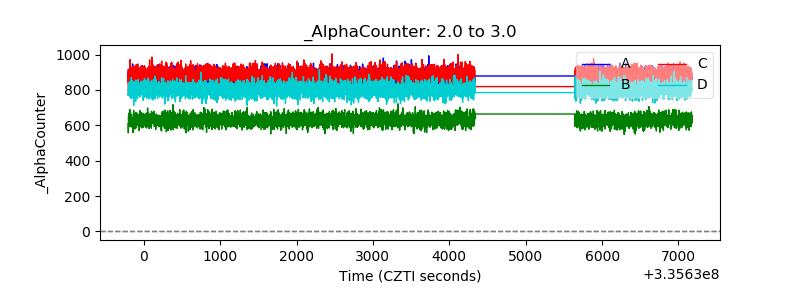 |
| _CPM_Rate | 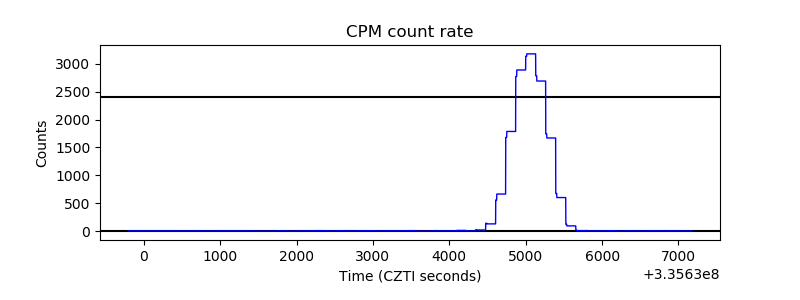 |
| CZT Counter | 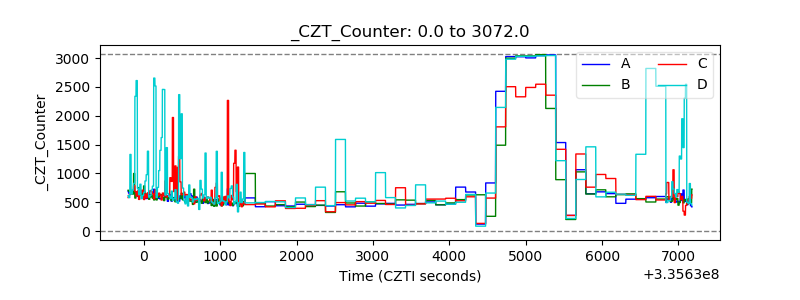 |
| +2.5 Volts monitor | 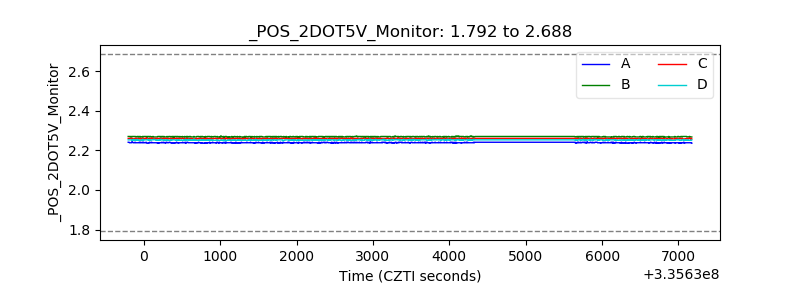 |
| +5 Volts monitor |  |
| _ROLL_ROT | 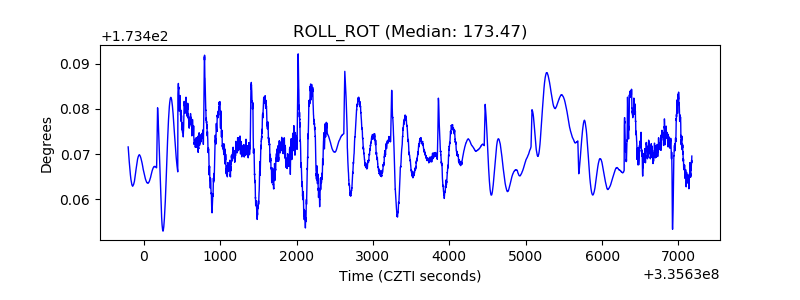 |
| _Roll_DEC | 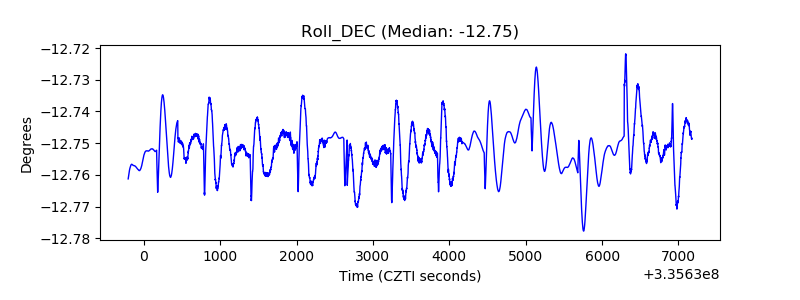 |
| _Roll_RA | 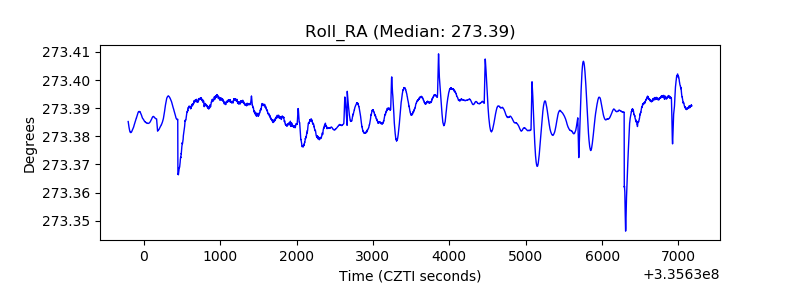 |
| Veto Counter | 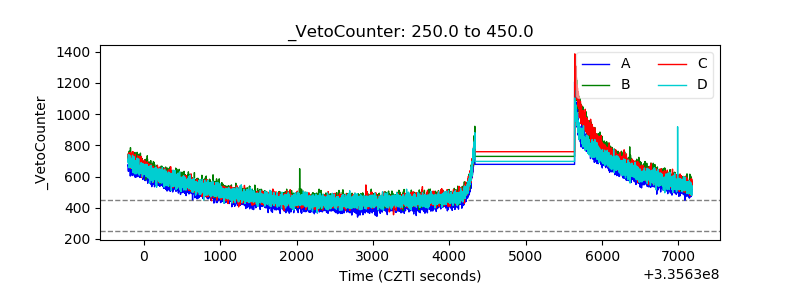 |