| Param | Original file | Final file |
|---|---|---|
| Filename | modeM0/AS1A09_104T02_9000003826_26474cztM0_level2.evt | modeM0/AS1A09_104T02_9000003826_26474cztM0_level2_quad_clean.evt |
| Size (bytes) | 509,469,120 | 100,676,160 |
| Size | 485.9 MB | 96.0 MB |
| Events in quadrant A | 3,244,212 | 691,206 |
| Events in quadrant B | 3,248,144 | 696,379 |
| Events in quadrant C | 3,684,429 | 642,139 |
| Events in quadrant D | 4,846,228 | 600,811 |
| Mode M0 | |||
|---|---|---|---|
| Quadrant | BADHDUFLAG | Total packets | Discarded packets |
| A | 0 | 13369 | 0 |
| B | 0 | 13359 | 0 |
| C | 0 | 14847 | 0 |
| D | 0 | 18393 | 0 |
| Mode M9 | |||
|---|---|---|---|
| Quadrant | BADHDUFLAG | Total packets | Discarded packets |
| A | 0 | 14 | 0 |
| B | 0 | 14 | 0 |
| C | 0 | 14 | 0 |
| D | 0 | 14 | 0 |
| Quadrant | Total seconds | Saturated seconds | Saturation percentage |
|---|---|---|---|
| A | 5994 | 119 | 1.985319% |
| B | 5994 | 122 | 2.035369% |
| C | 5995 | 220 | 3.669725% |
| D | 5995 | 603 | 10.058382% |
Noise dominated data is calculated using 1-second bins in cleaned event files. If a bin has >2000 counts, and if more than 50% of those come from <1% of pixels, then it is considered to be noise-dominated and hence unusable.
| Quadrant | # 1 sec bins | Bins with >0 counts | Bins with >2000 counts | High rate bins dominated by noise | Noise dominated (total time) | Noise dominated (detector-on time) | Marked lightcurve |
|---|---|---|---|---|---|---|---|
| A | 7314 | 5994 | 0 | 0 | 0.00% | 0.00% | 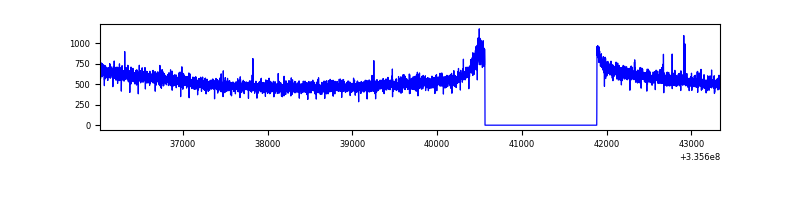 |
| B | 7314 | 5994 | 2 | 2 | 0.03% | 0.03% | 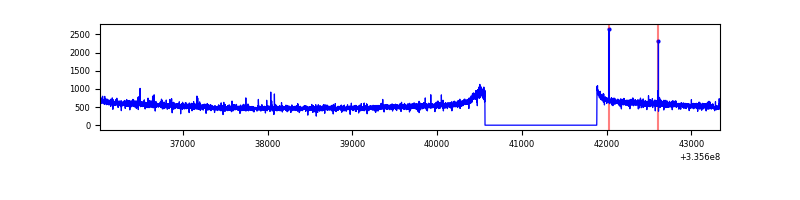 |
| C | 7315 | 5995 | 24 | 24 | 0.33% | 0.40% | 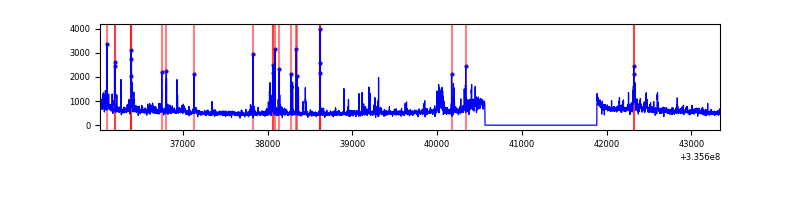 |
| D | 7315 | 5995 | 430 | 430 | 5.88% | 7.17% | 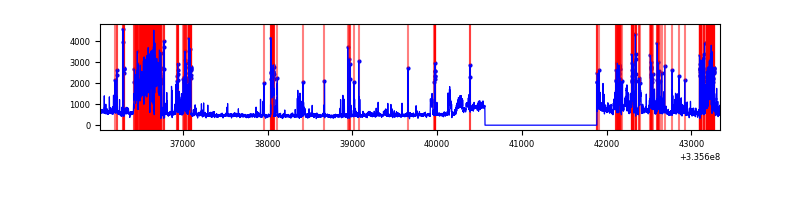 |
Top three noisy pixels from each quadrant. If the there are fewer than three noisy pixels in the level2.evt file, extra rows are filled as -1
| Pixel properties | Quadrant properties | ||||||
|---|---|---|---|---|---|---|---|
| Quadrant | DetID | PixID | Counts | Sigma | Mean | Median | Sigma |
| A | 13 | 254 | 10486 | 57.33 | 841 | 829 | 168.5 |
| A | 0 | 226 | 7405 | 39.04 | 841 | 829 | 168.5 |
| A | 3 | 137 | 6945 | 36.31 | 841 | 829 | 168.5 |
| B | 12 | 111 | 17441 | 107.5 | 825 | 809 | 154.7 |
| B | 11 | 111 | 15789 | 96.83 | 825 | 809 | 154.7 |
| B | 14 | 111 | 13836 | 84.2 | 825 | 809 | 154.7 |
| C | 2 | 16 | 262233 | 1445.83 | 783 | 790 | 180.8 |
| C | 3 | 233 | 159429 | 877.3 | 783 | 790 | 180.8 |
| C | 14 | 238 | 129034 | 709.21 | 783 | 790 | 180.8 |
| D | 7 | 80 | 1460269 | 7888.14 | 776 | 758 | 185.0 |
| D | 1 | 52 | 212142 | 1142.45 | 776 | 758 | 185.0 |
| D | 12 | 233 | 129361 | 695.05 | 776 | 758 | 185.0 |
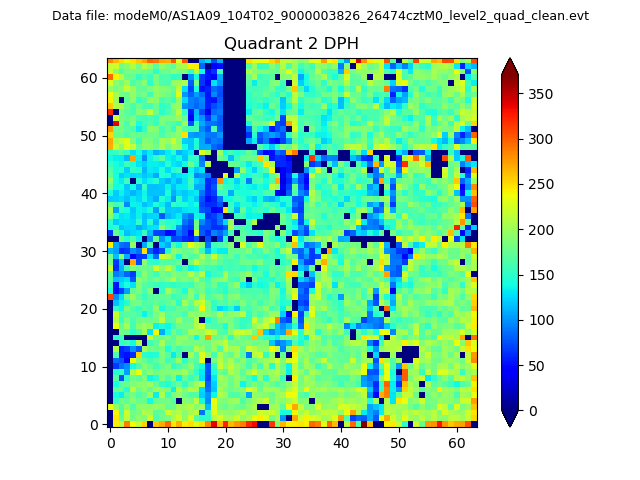
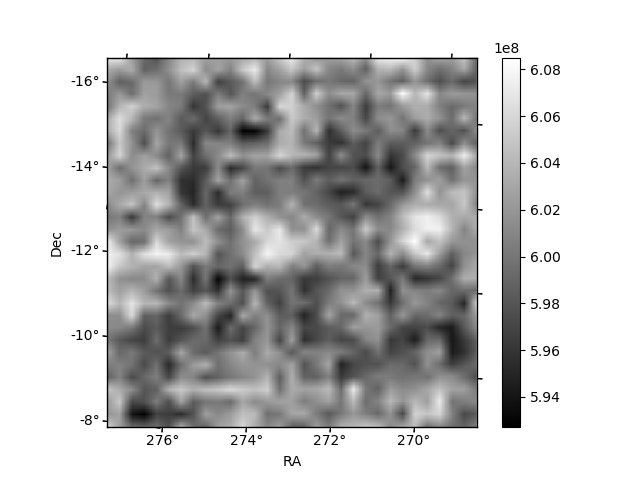
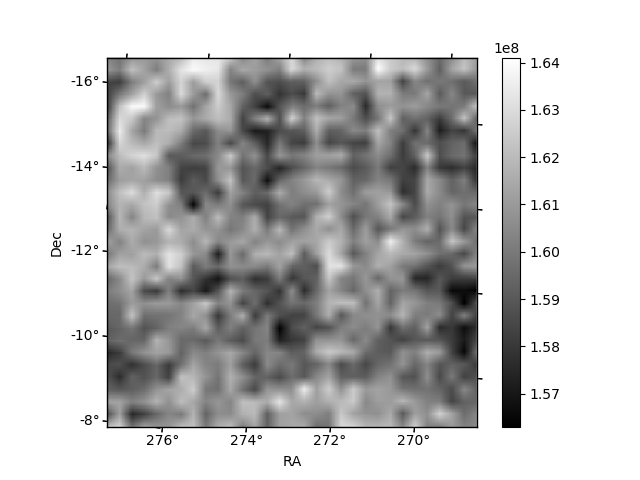
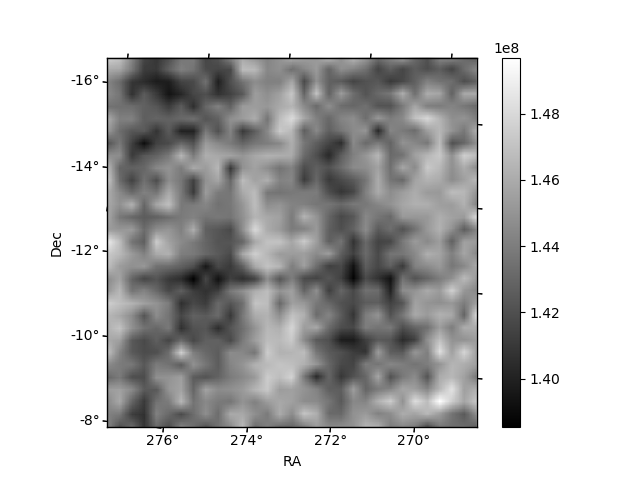
Histogram calculated using DETX and DETY for each event in the final _common_clean file
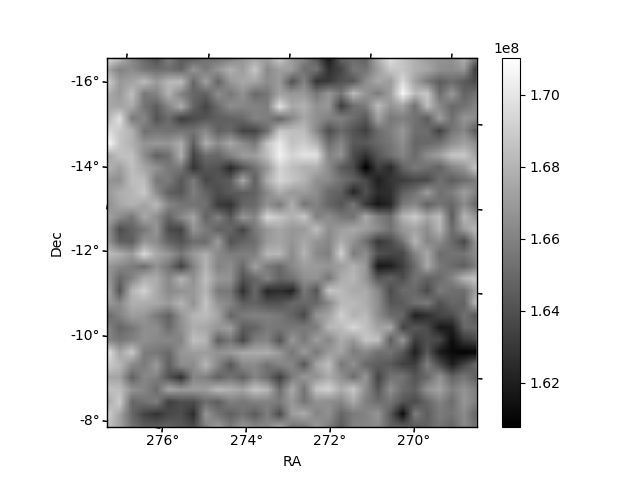
| Quadrant A | 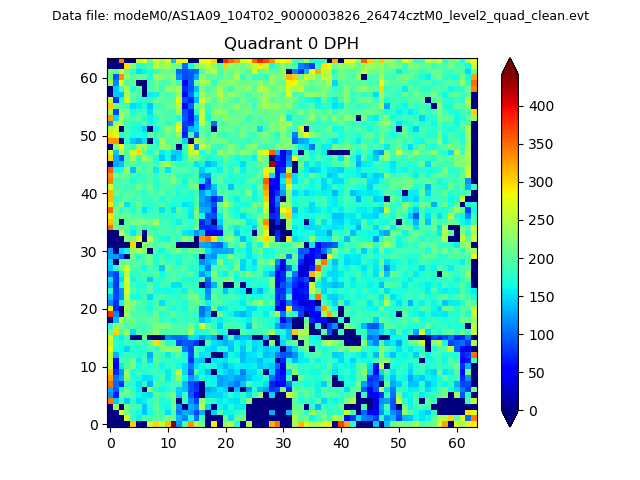 |
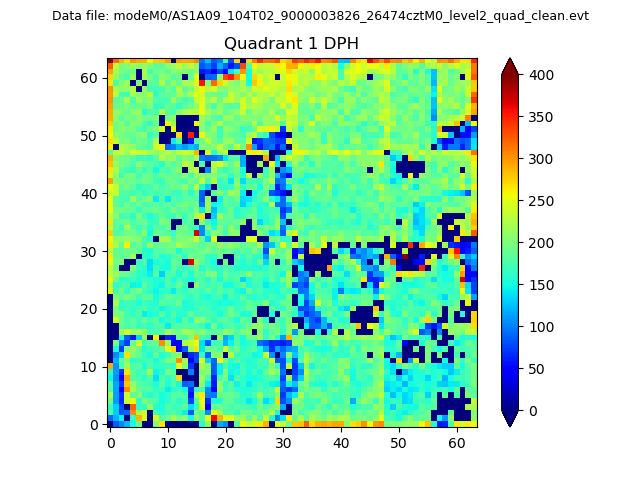 |
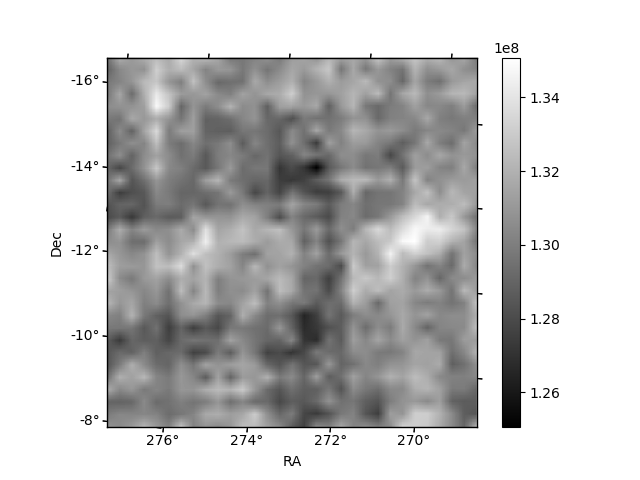
Quadrant B |
|---|---|---|---|
| Quadrant D | 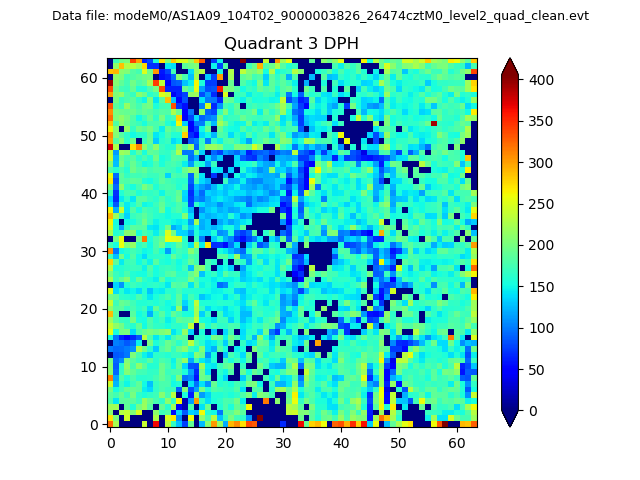 |
 |
Quadrant C |
| Plot type | Count rate plots | Images |
|---|---|---|
| Comparison with Poisson distribution Blue bars denote a histogram of data divided into 1 sec bins. Red curve is a Poisson curve with rate = median count rate of data. |
 |
 |
| Quadrant-wise count rates Data is divided into 100 sec bins |
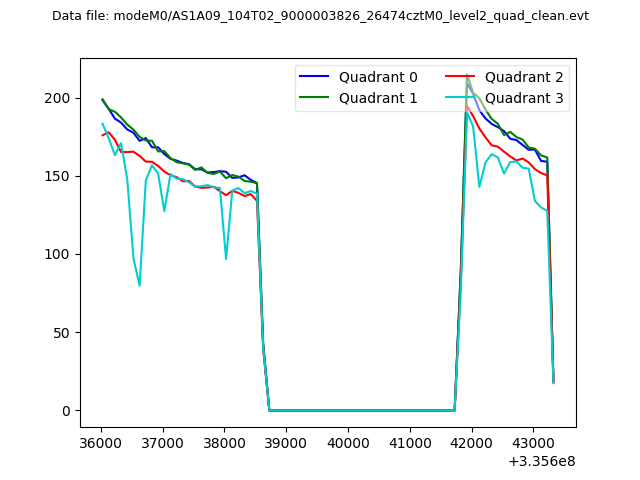 |
|
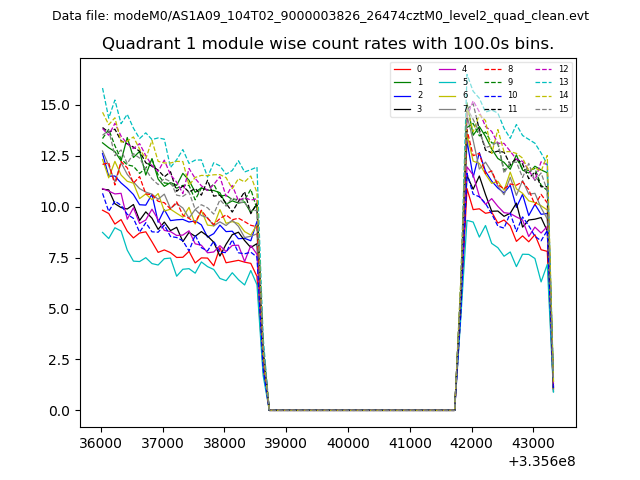
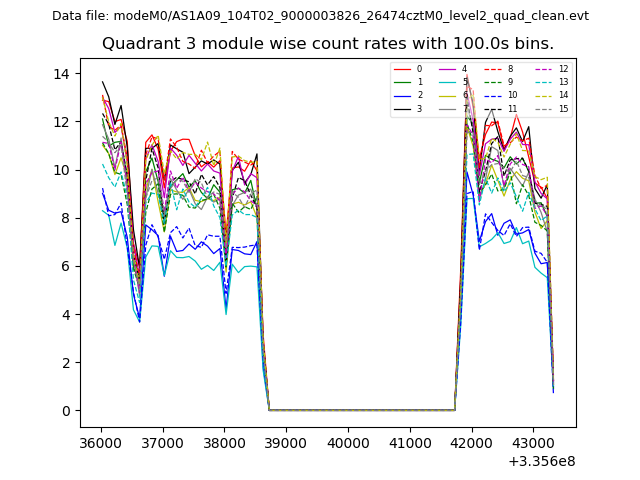
| Module-wise count rates for Quadrant A Data is divided into 100 sec bins |
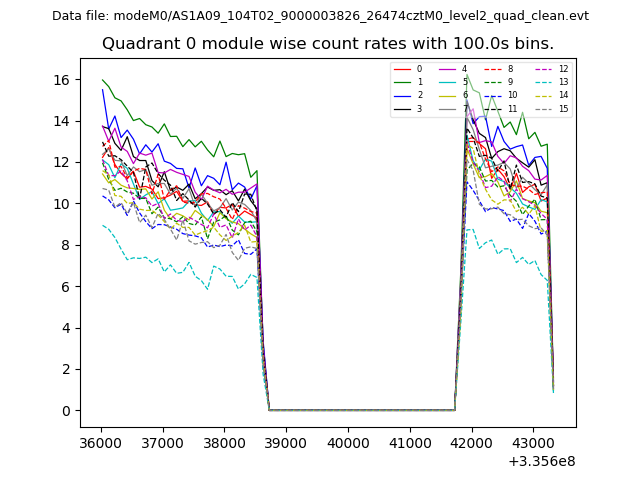 |
 |
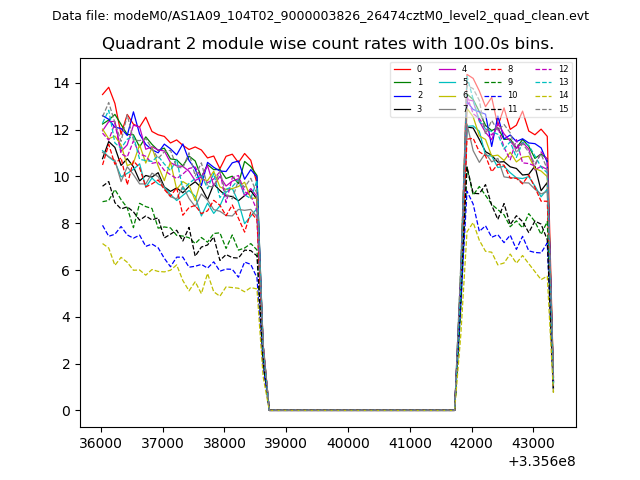
| Module-wise count rates for Quadrant B Data is divided into 100 sec bins |
 |
 |
| Module-wise count rates for Quadrant C Data is divided into 100 sec bins |
 |
 |
| Module-wise count rates for Quadrant D Data is divided into 100 sec bins |
 |
 |
| Parameter | Plot |
|---|---|
| CZT HV Monitor | 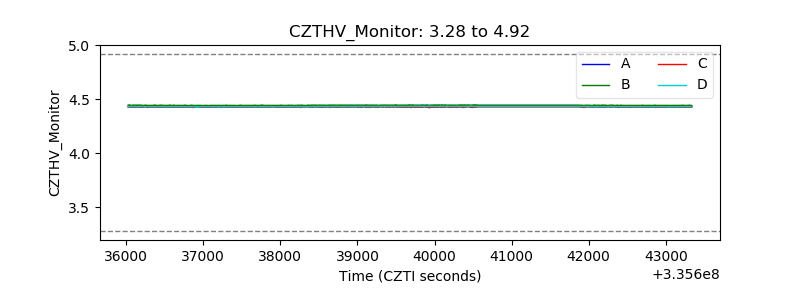 |
| D_VDD | 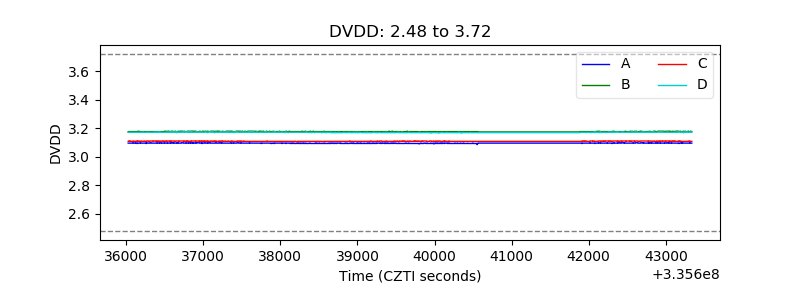 |
| Temperature 1 | 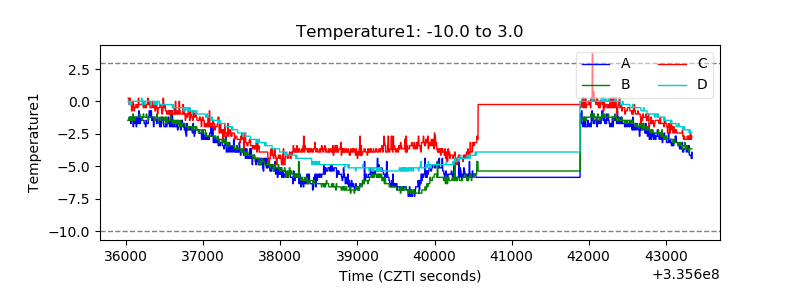 |
| Veto HV Monitor | 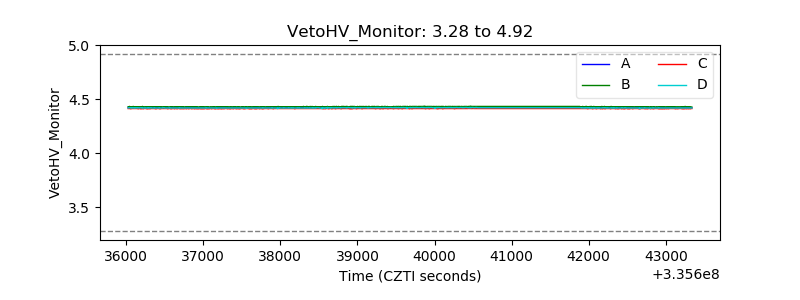 |
| Veto LLD | 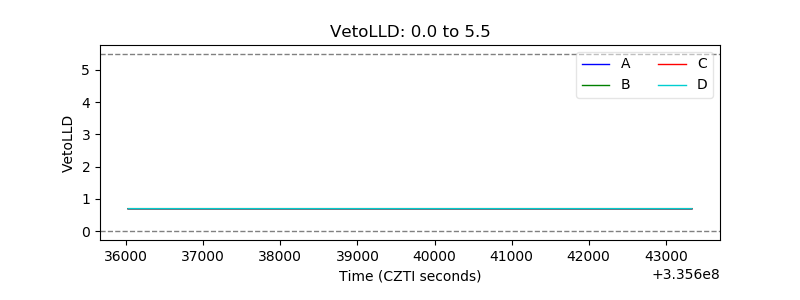 |
| Alpha Counter | 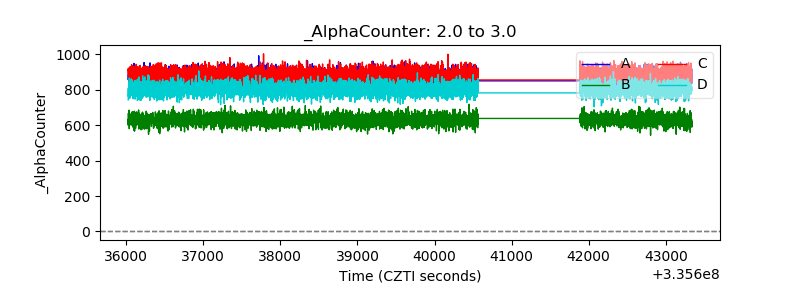 |
| _CPM_Rate | 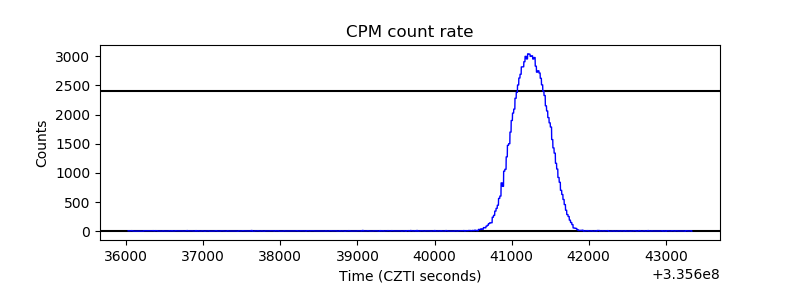 |
| CZT Counter | 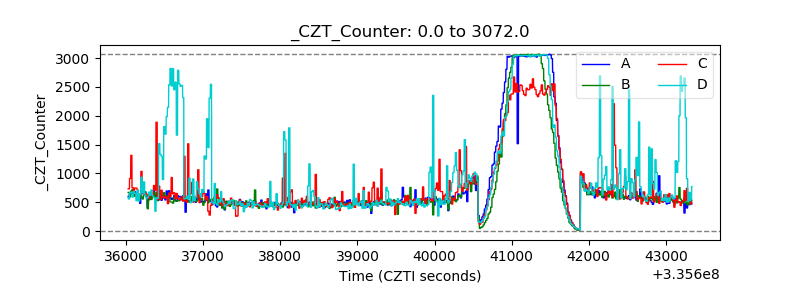 |
| +2.5 Volts monitor |  |
| +5 Volts monitor | 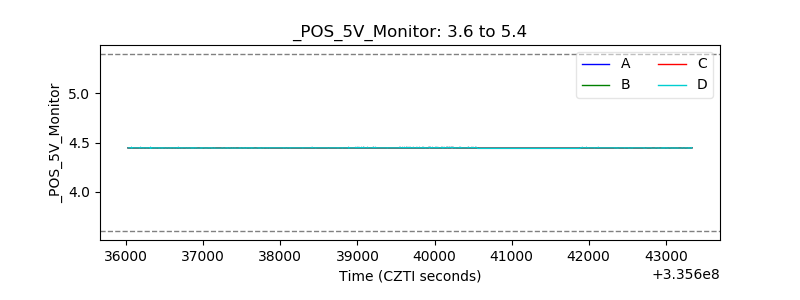 |
| _ROLL_ROT | 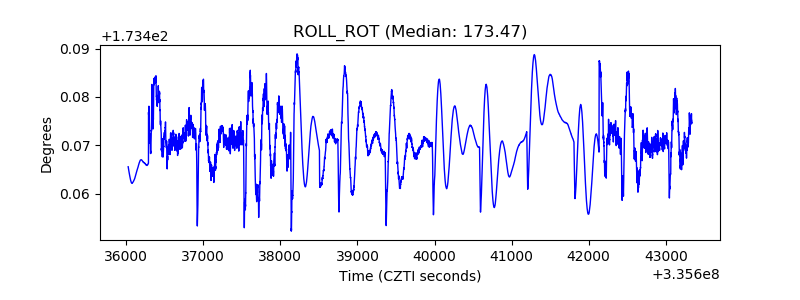 |
| _Roll_DEC | 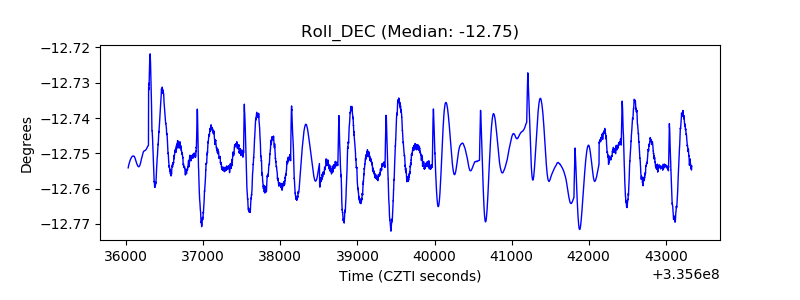 |
| _Roll_RA | 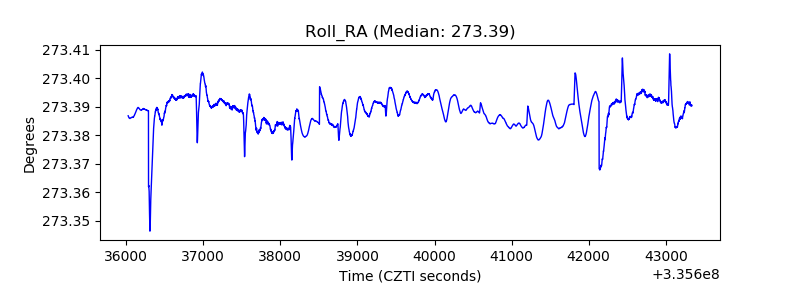 |
| Veto Counter | 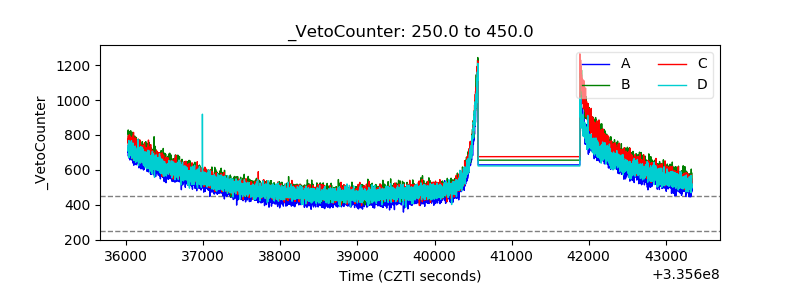 |