| Param | Original file | Final file |
|---|---|---|
| Filename | modeM0/AS1A09_104T02_9000003826_26475cztM0_level2.evt | modeM0/AS1A09_104T02_9000003826_26475cztM0_level2_quad_clean.evt |
| Size (bytes) | 560,465,280 | 93,530,880 |
| Size | 534.5 MB | 89.2 MB |
| Events in quadrant A | 3,267,482 | 640,446 |
| Events in quadrant B | 3,330,059 | 652,310 |
| Events in quadrant C | 4,092,535 | 602,096 |
| Events in quadrant D | 5,869,693 | 510,527 |
| Mode M0 | |||
|---|---|---|---|
| Quadrant | BADHDUFLAG | Total packets | Discarded packets |
| A | 0 | 13514 | 0 |
| B | 0 | 13740 | 0 |
| C | 0 | 16160 | 0 |
| D | 0 | 21521 | 0 |
| Mode M9 | |||
|---|---|---|---|
| Quadrant | BADHDUFLAG | Total packets | Discarded packets |
| A | 0 | 19 | 0 |
| B | 0 | 20 | 0 |
| C | 0 | 20 | 0 |
| D | 0 | 20 | 0 |
| Quadrant | Total seconds | Saturated seconds | Saturation percentage |
|---|---|---|---|
| A | 6119 | 74 | 1.209348% |
| B | 6119 | 93 | 1.519856% |
| C | 6119 | 300 | 4.902762% |
| D | 6118 | 960 | 15.691402% |
Noise dominated data is calculated using 1-second bins in cleaned event files. If a bin has >2000 counts, and if more than 50% of those come from <1% of pixels, then it is considered to be noise-dominated and hence unusable.
| Quadrant | # 1 sec bins | Bins with >0 counts | Bins with >2000 counts | High rate bins dominated by noise | Noise dominated (total time) | Noise dominated (detector-on time) | Marked lightcurve |
|---|---|---|---|---|---|---|---|
| A | 7479 | 6120 | 0 | 0 | 0.00% | 0.00% | 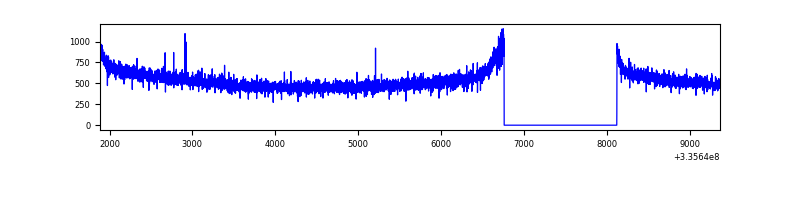 |
| B | 7479 | 6120 | 2 | 2 | 0.03% | 0.03% | 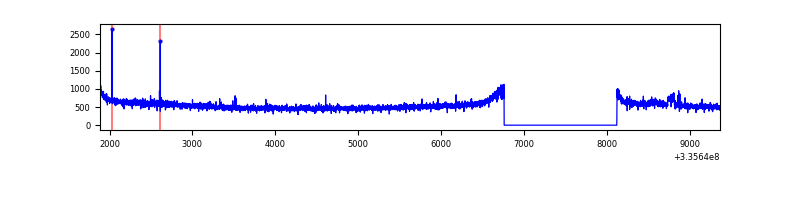 |
| C | 7479 | 6120 | 93 | 93 | 1.24% | 1.52% | 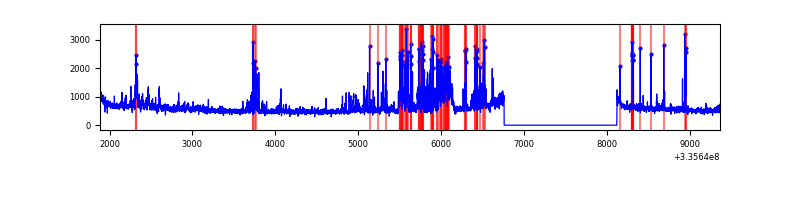 |
| D | 7478 | 6119 | 772 | 772 | 10.32% | 12.62% | 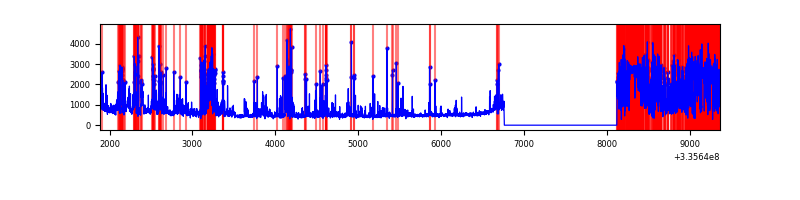 |
Top three noisy pixels from each quadrant. If the there are fewer than three noisy pixels in the level2.evt file, extra rows are filled as -1
| Pixel properties | Quadrant properties | ||||||
|---|---|---|---|---|---|---|---|
| Quadrant | DetID | PixID | Counts | Sigma | Mean | Median | Sigma |
| A | 13 | 254 | 10279 | 55.9 | 846 | 832 | 169.0 |
| A | 0 | 226 | 7462 | 39.23 | 846 | 832 | 169.0 |
| A | 3 | 137 | 7234 | 37.88 | 846 | 832 | 169.0 |
| B | 4 | 200 | 23599 | 144.93 | 839 | 824 | 157.1 |
| B | 12 | 111 | 18122 | 110.08 | 839 | 824 | 157.1 |
| B | 11 | 111 | 16163 | 97.61 | 839 | 824 | 157.1 |
| C | 2 | 16 | 503603 | 2730.83 | 791 | 801 | 184.1 |
| C | 3 | 233 | 276521 | 1497.5 | 791 | 801 | 184.1 |
| C | 14 | 238 | 127234 | 686.69 | 791 | 801 | 184.1 |
| D | 7 | 80 | 1513356 | 8465.37 | 746 | 726 | 178.7 |
| D | 1 | 52 | 1308821 | 7320.7 | 746 | 726 | 178.7 |
| D | 11 | 176 | 121348 | 675.05 | 746 | 726 | 178.7 |
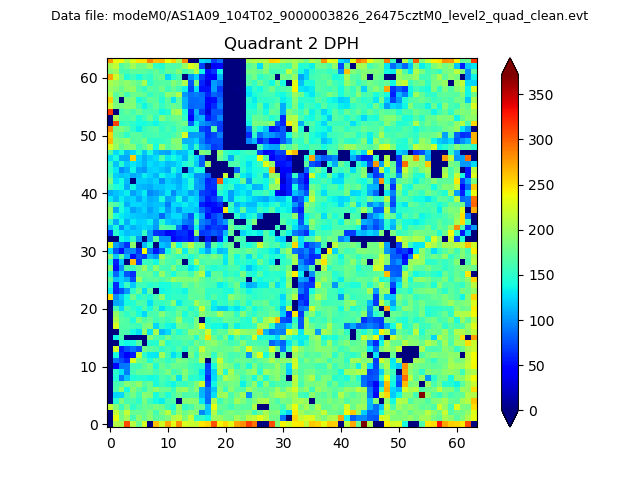
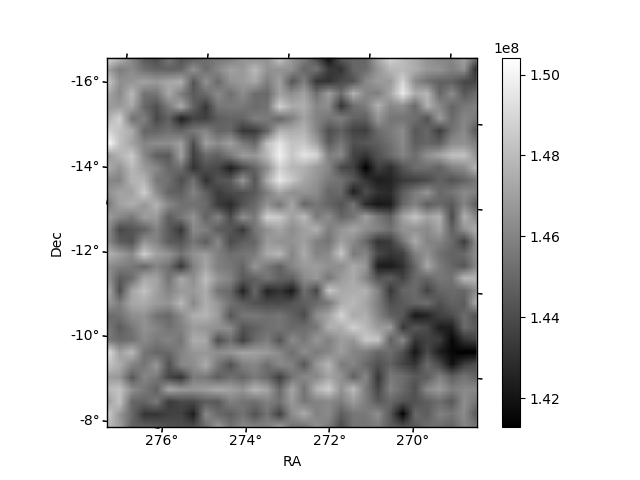
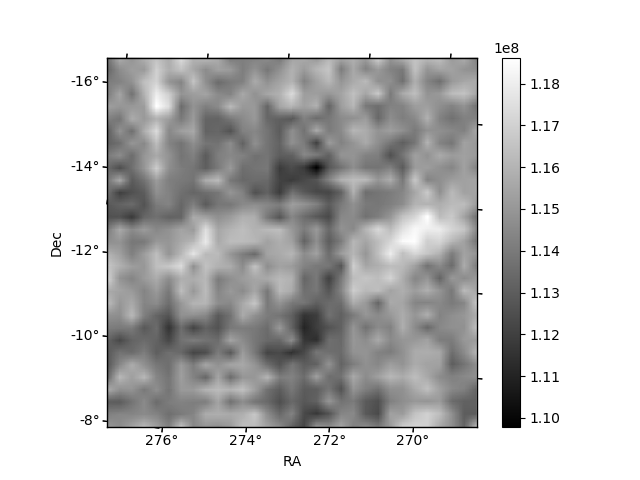
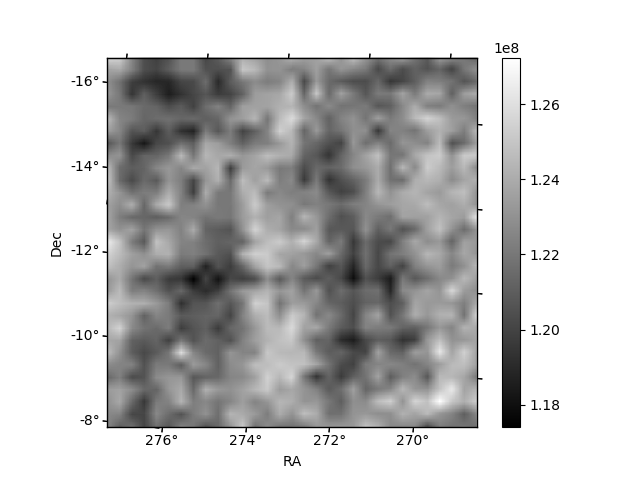
Histogram calculated using DETX and DETY for each event in the final _common_clean file
| Quadrant A | 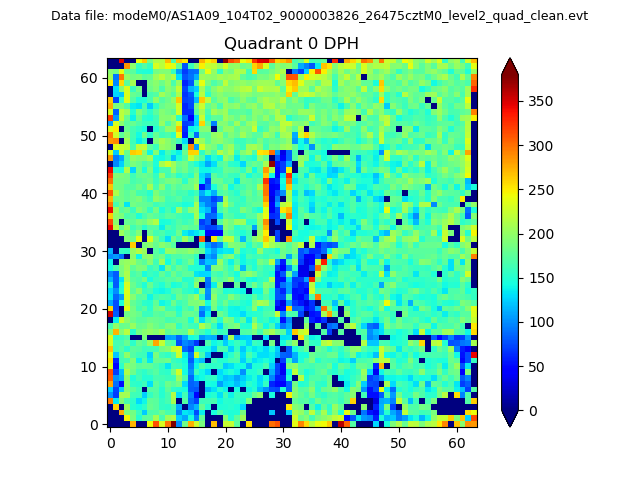 |
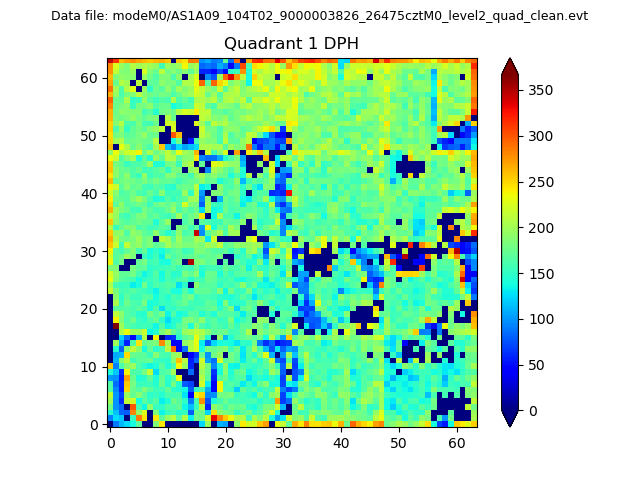 |
Quadrant B |
|---|---|---|---|
| Quadrant D | 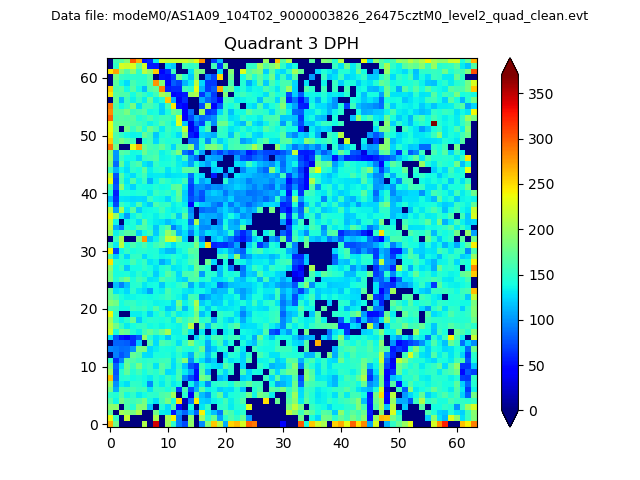 |
 |
Quadrant C |
| Plot type | Count rate plots | Images |
|---|---|---|
| Comparison with Poisson distribution Blue bars denote a histogram of data divided into 1 sec bins. Red curve is a Poisson curve with rate = median count rate of data. |
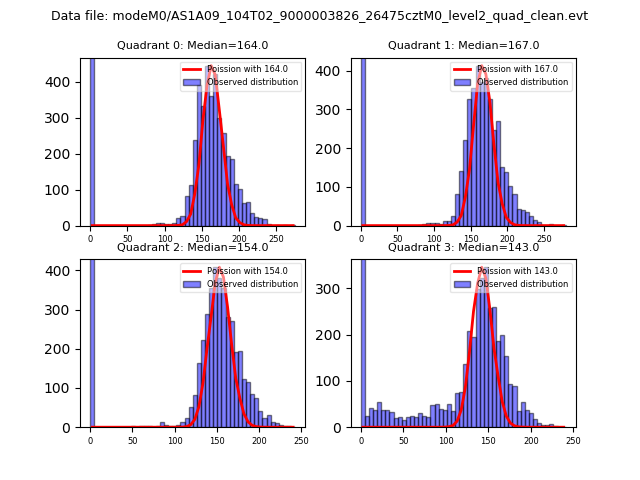 |
 |
| Quadrant-wise count rates Data is divided into 100 sec bins |
 |
|
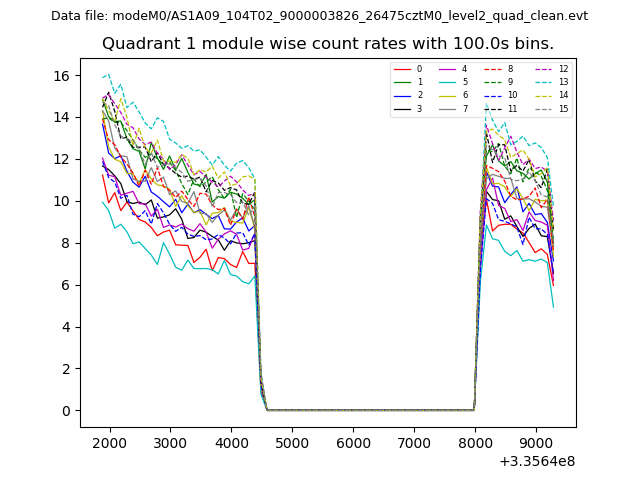
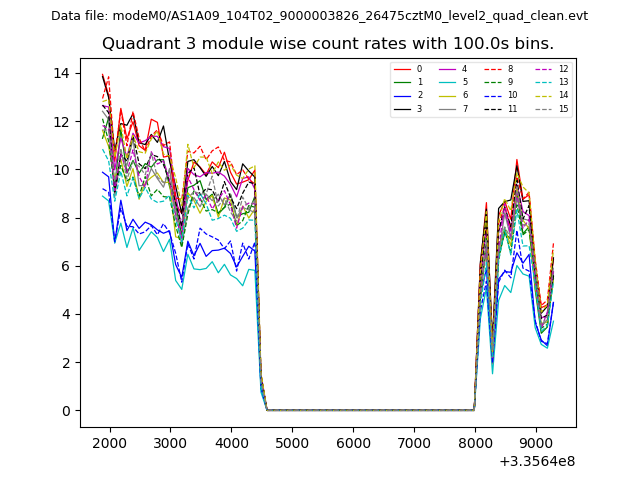
| Module-wise count rates for Quadrant A Data is divided into 100 sec bins |
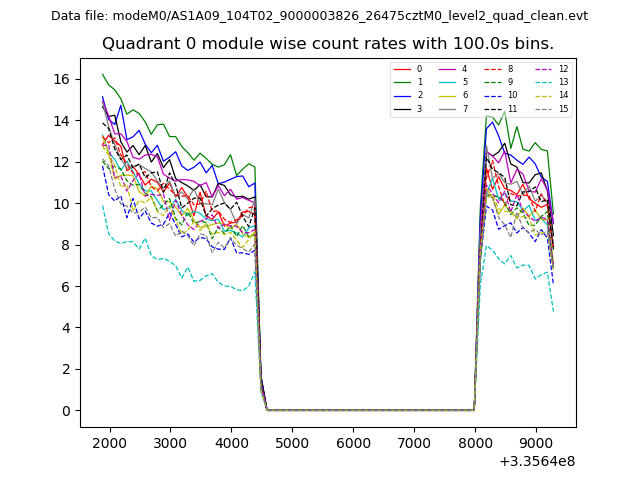 |
 |
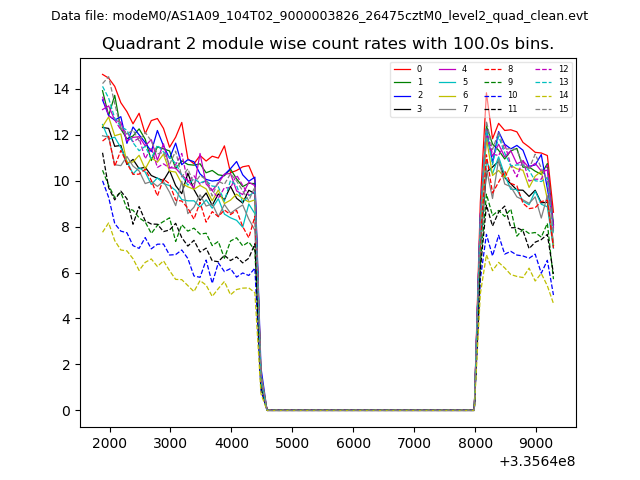
| Module-wise count rates for Quadrant B Data is divided into 100 sec bins |
 |
 |
| Module-wise count rates for Quadrant C Data is divided into 100 sec bins |
 |
 |
| Module-wise count rates for Quadrant D Data is divided into 100 sec bins |
 |
 |
| Parameter | Plot |
|---|---|
| CZT HV Monitor | 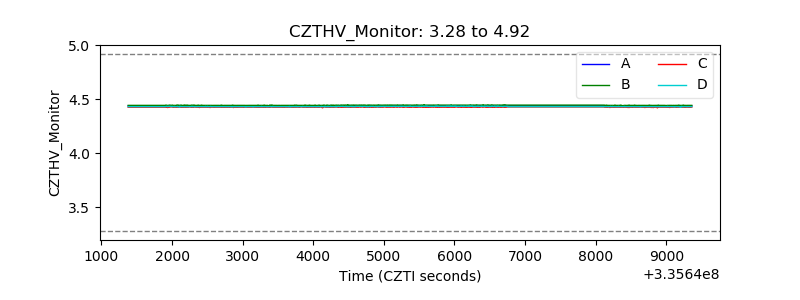 |
| D_VDD | 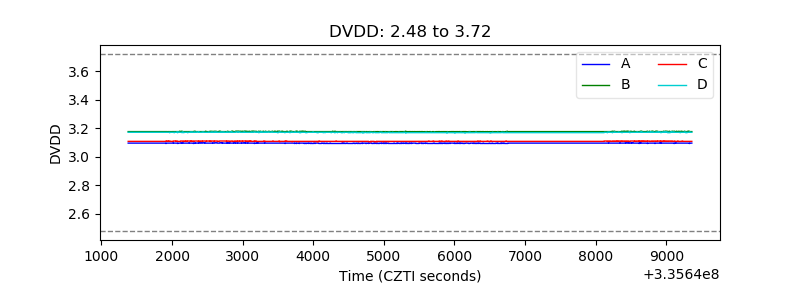 |
| Temperature 1 | 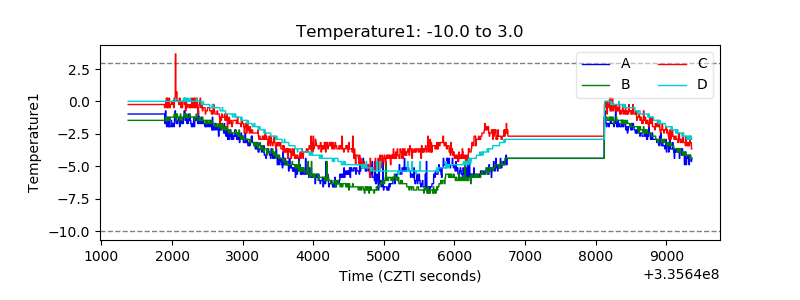 |
| Veto HV Monitor | 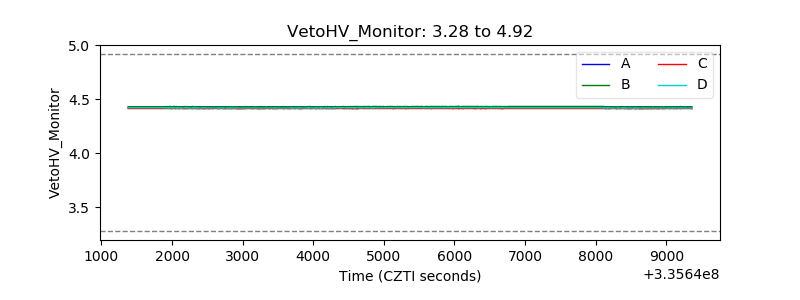 |
| Veto LLD | 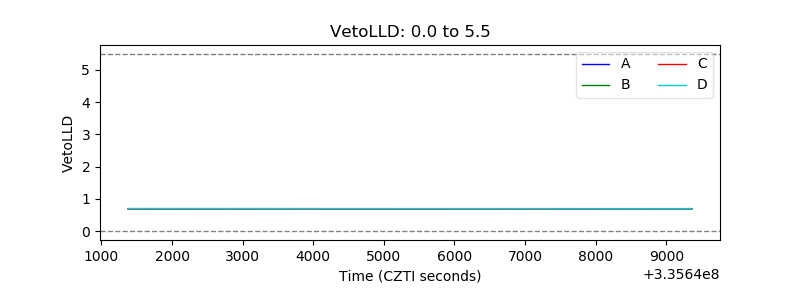 |
| Alpha Counter | 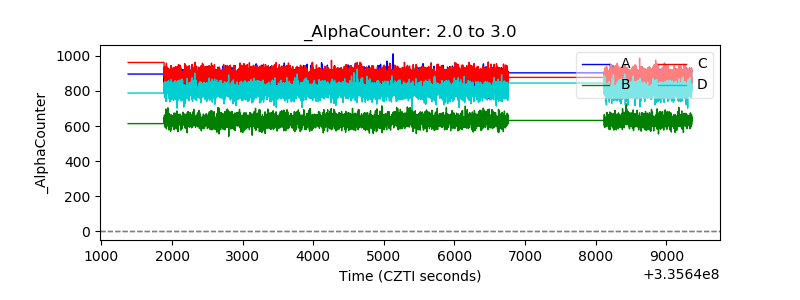 |
| _CPM_Rate | 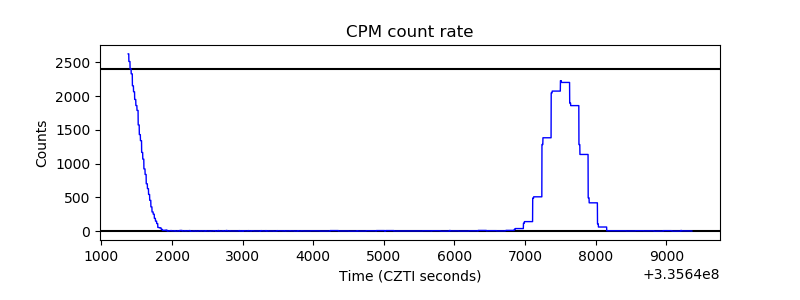 |
| CZT Counter | 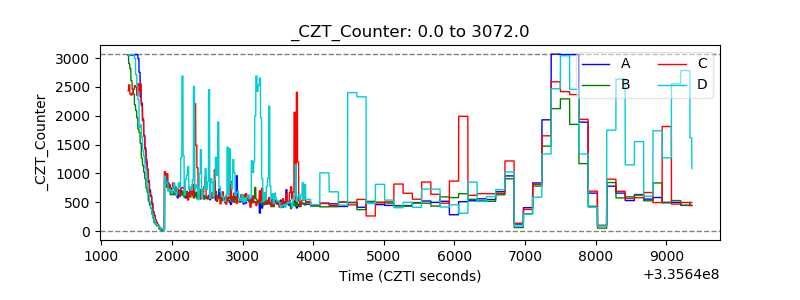 |
| +2.5 Volts monitor |  |
| +5 Volts monitor |  |
| _ROLL_ROT | 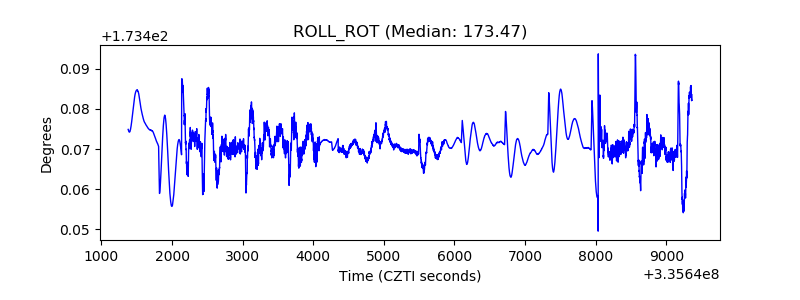 |
| _Roll_DEC | 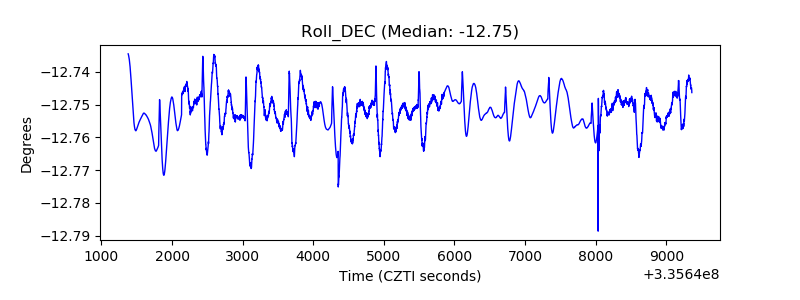 |
| _Roll_RA | 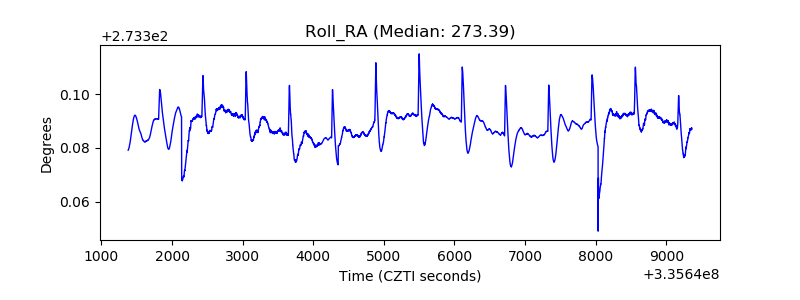 |
| Veto Counter | 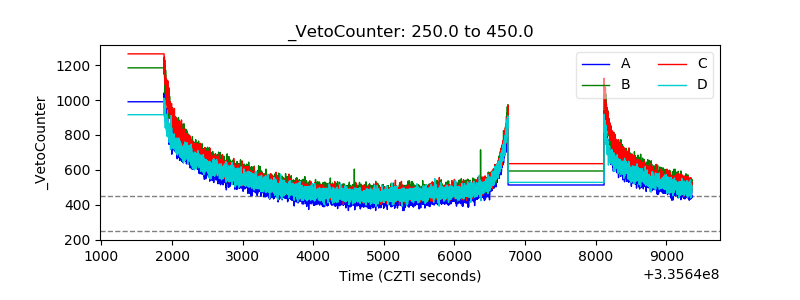 |