| Param | Original file | Final file |
|---|---|---|
| Filename | modeM0/AS1A09_104T02_9000003826_26476cztM0_level2.evt | modeM0/AS1A09_104T02_9000003826_26476cztM0_level2_quad_clean.evt |
| Size (bytes) | 701,884,800 | 89,858,880 |
| Size | 669.4 MB | 85.7 MB |
| Events in quadrant A | 3,235,084 | 628,777 |
| Events in quadrant B | 3,328,432 | 642,892 |
| Events in quadrant C | 3,525,773 | 599,613 |
| Events in quadrant D | 10,737,456 | 405,745 |
| Mode M0 | |||
|---|---|---|---|
| Quadrant | BADHDUFLAG | Total packets | Discarded packets |
| A | 0 | 13596 | 0 |
| B | 0 | 13842 | 0 |
| C | 0 | 14433 | 0 |
| D | 0 | 36273 | 0 |
| Mode M9 | |||
|---|---|---|---|
| Quadrant | BADHDUFLAG | Total packets | Discarded packets |
| A | 0 | 17 | 0 |
| B | 0 | 18 | 0 |
| C | 0 | 18 | 0 |
| D | 0 | 18 | 0 |
| Quadrant | Total seconds | Saturated seconds | Saturation percentage |
|---|---|---|---|
| A | 6356 | 53 | 0.833858% |
| B | 6356 | 76 | 1.195721% |
| C | 6356 | 135 | 2.123977% |
| D | 6355 | 2903 | 45.680566% |
Noise dominated data is calculated using 1-second bins in cleaned event files. If a bin has >2000 counts, and if more than 50% of those come from <1% of pixels, then it is considered to be noise-dominated and hence unusable.
| Quadrant | # 1 sec bins | Bins with >0 counts | Bins with >2000 counts | High rate bins dominated by noise | Noise dominated (total time) | Noise dominated (detector-on time) | Marked lightcurve |
|---|---|---|---|---|---|---|---|
| A | 7611 | 6357 | 0 | 0 | 0.00% | 0.00% | 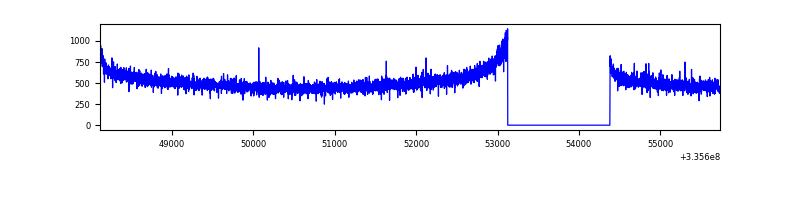 |
| B | 7611 | 6357 | 2 | 2 | 0.03% | 0.03% | 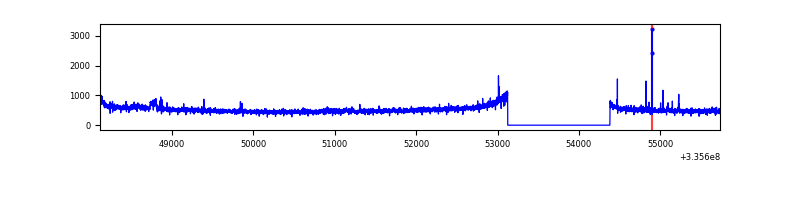 |
| C | 7611 | 6357 | 27 | 27 | 0.35% | 0.42% | 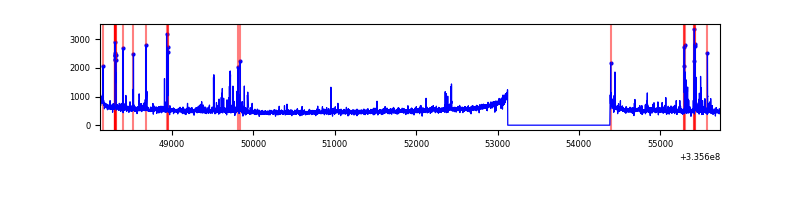 |
| D | 7609 | 6354 | 2552 | 2552 | 33.54% | 40.16% | 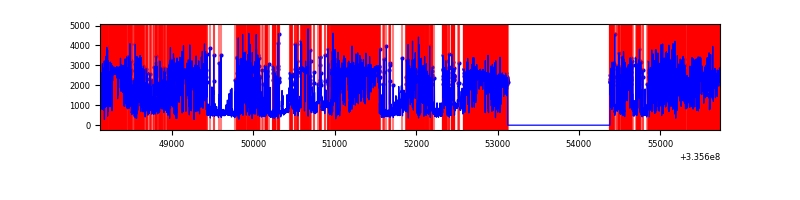 |
Top three noisy pixels from each quadrant. If the there are fewer than three noisy pixels in the level2.evt file, extra rows are filled as -1
| Pixel properties | Quadrant properties | ||||||
|---|---|---|---|---|---|---|---|
| Quadrant | DetID | PixID | Counts | Sigma | Mean | Median | Sigma |
| A | 13 | 254 | 10279 | 55.91 | 838 | 824 | 169.1 |
| A | 3 | 137 | 7456 | 39.21 | 838 | 824 | 169.1 |
| A | 0 | 226 | 7354 | 38.61 | 838 | 824 | 169.1 |
| B | 4 | 200 | 32154 | 197.96 | 836 | 818 | 158.3 |
| B | 12 | 111 | 18697 | 112.95 | 836 | 818 | 158.3 |
| B | 11 | 111 | 16451 | 98.76 | 836 | 818 | 158.3 |
| C | 2 | 16 | 199624 | 1064.48 | 794 | 800 | 186.8 |
| C | 14 | 238 | 129704 | 690.14 | 794 | 800 | 186.8 |
| C | 3 | 233 | 59577 | 314.69 | 794 | 800 | 186.8 |
| D | 7 | 80 | 5781906 | 40496.41 | 598 | 583 | 142.8 |
| D | 1 | 52 | 1998261 | 13993.13 | 598 | 583 | 142.8 |
| D | 11 | 176 | 604231 | 4228.37 | 598 | 583 | 142.8 |
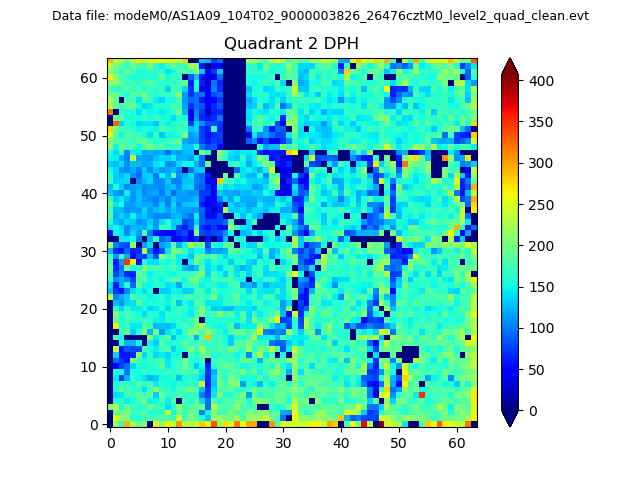
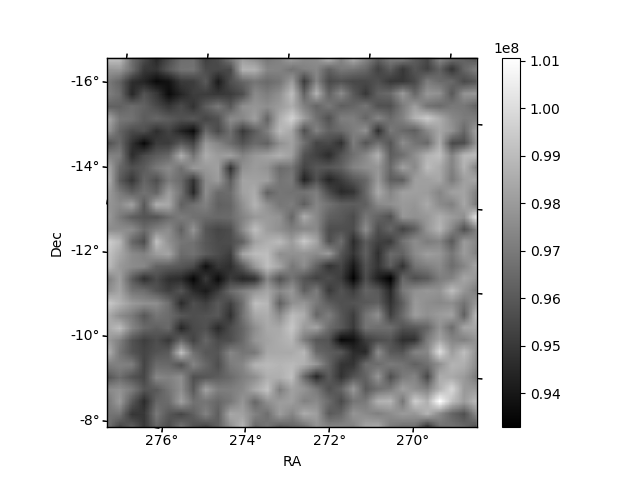
Histogram calculated using DETX and DETY for each event in the final _common_clean file
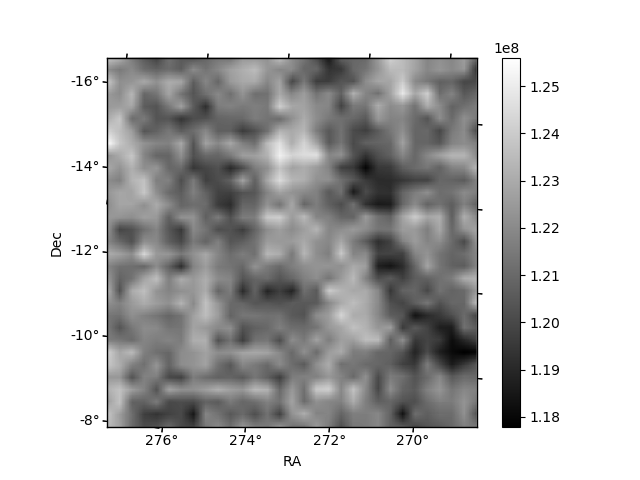
| Quadrant A | 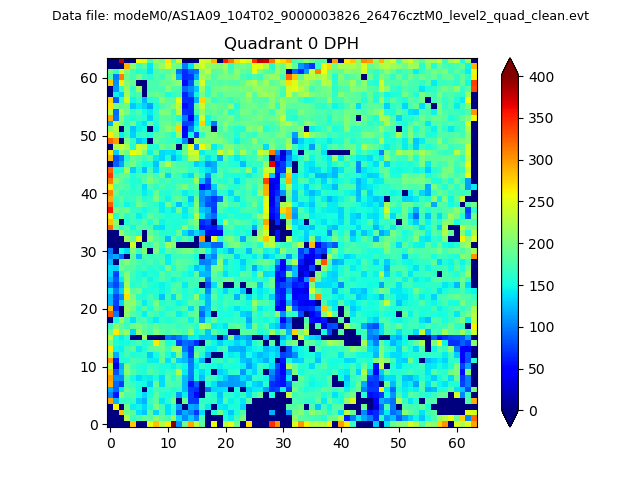 |
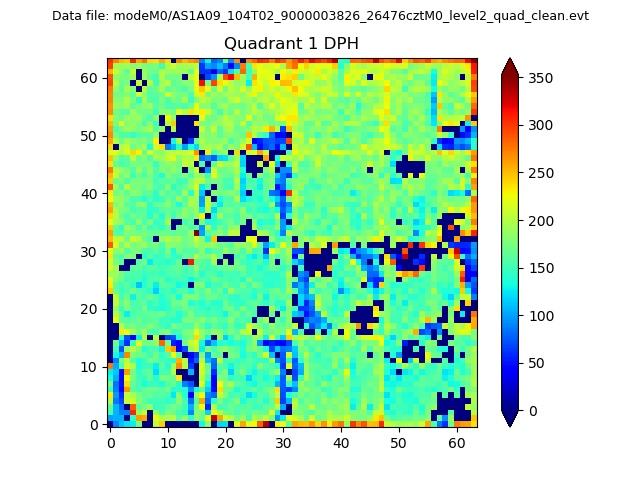 |
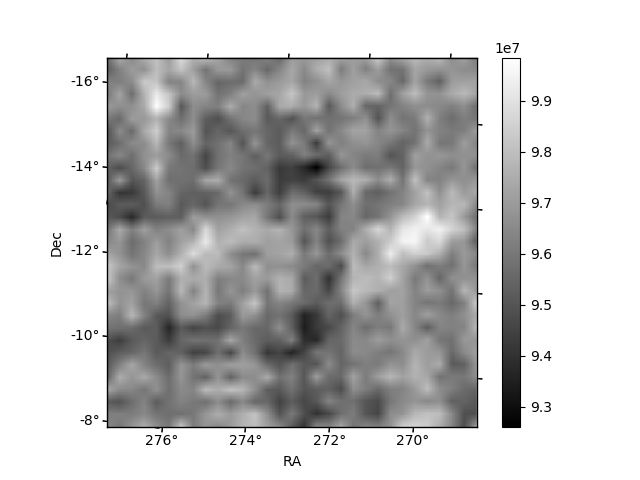
Quadrant B |
|---|---|---|---|
| Quadrant D | 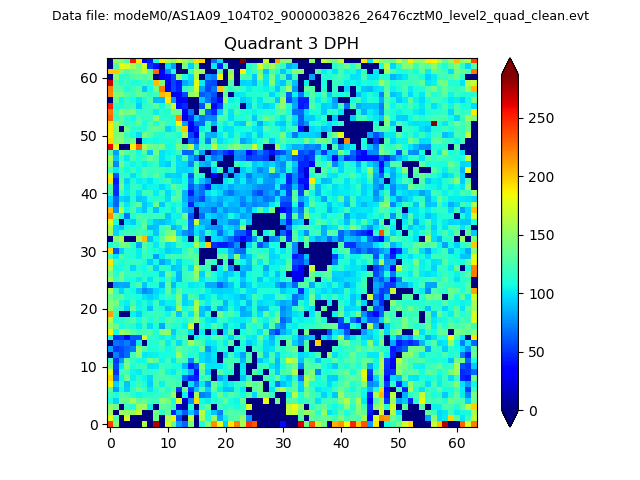 |
 |
Quadrant C |
| Plot type | Count rate plots | Images |
|---|---|---|
| Comparison with Poisson distribution Blue bars denote a histogram of data divided into 1 sec bins. Red curve is a Poisson curve with rate = median count rate of data. |
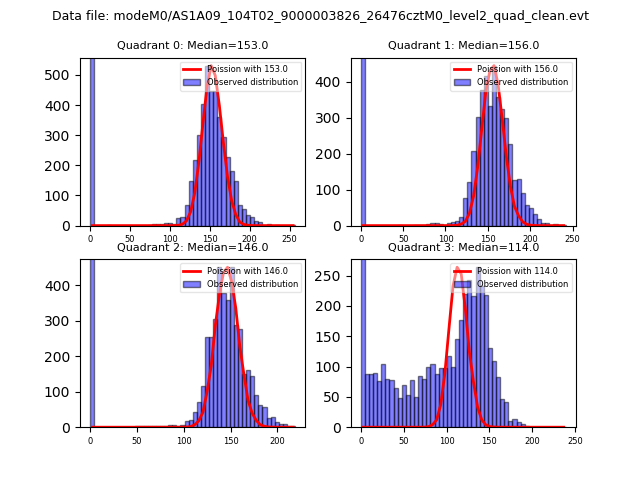 |
 |
| Quadrant-wise count rates Data is divided into 100 sec bins |
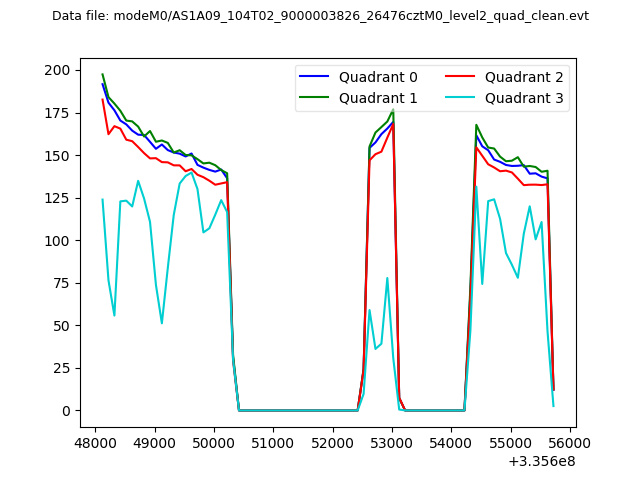 |
|
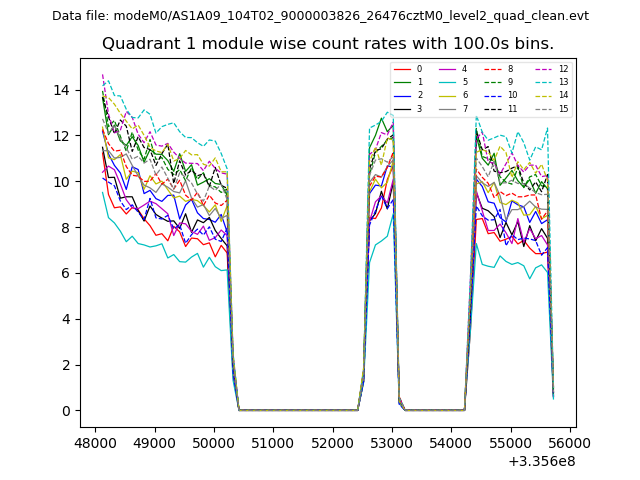
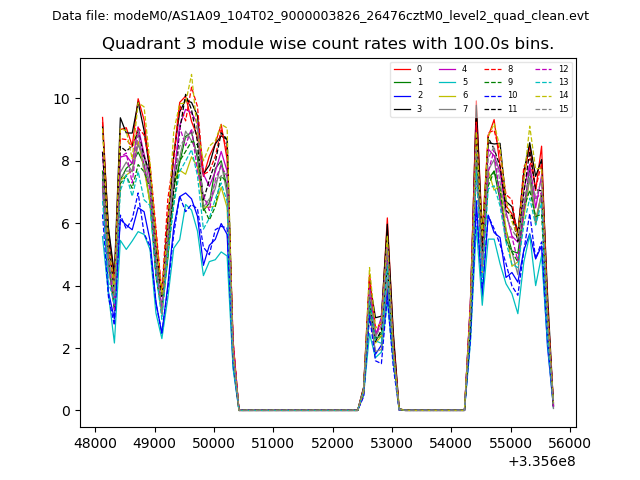
| Module-wise count rates for Quadrant A Data is divided into 100 sec bins |
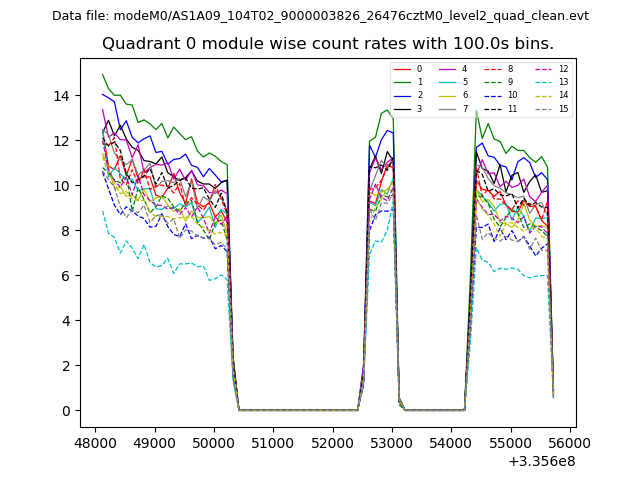 |
 |
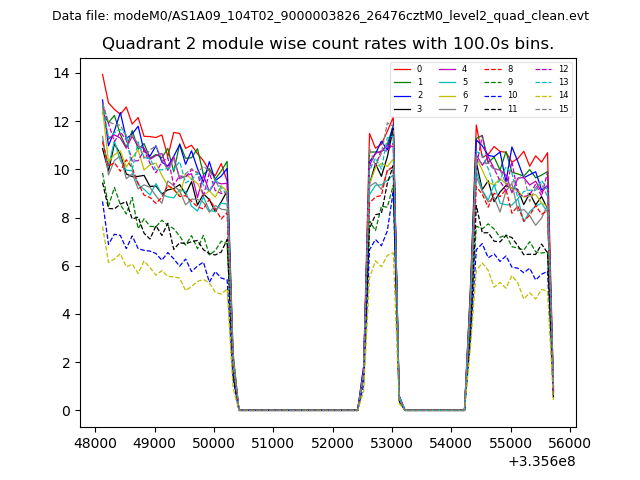
| Module-wise count rates for Quadrant B Data is divided into 100 sec bins |
 |
 |
| Module-wise count rates for Quadrant C Data is divided into 100 sec bins |
 |
 |
| Module-wise count rates for Quadrant D Data is divided into 100 sec bins |
 |
 |
| Parameter | Plot |
|---|---|
| CZT HV Monitor | 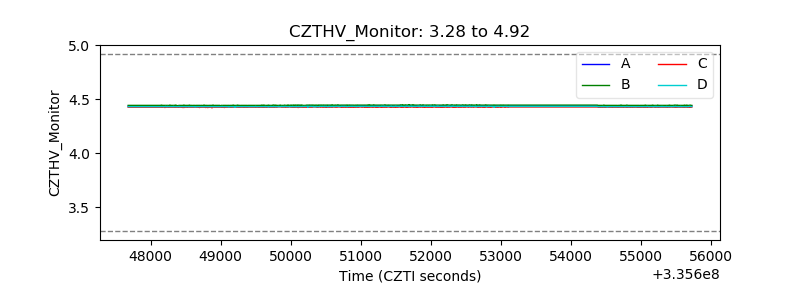 |
| D_VDD | 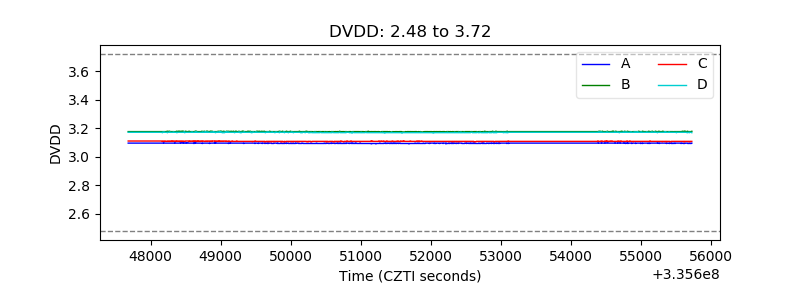 |
| Temperature 1 | 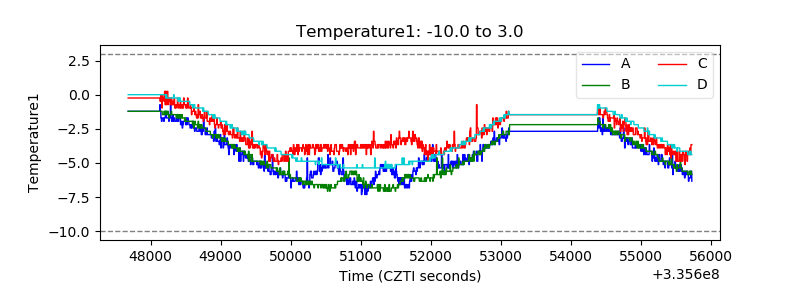 |
| Veto HV Monitor | 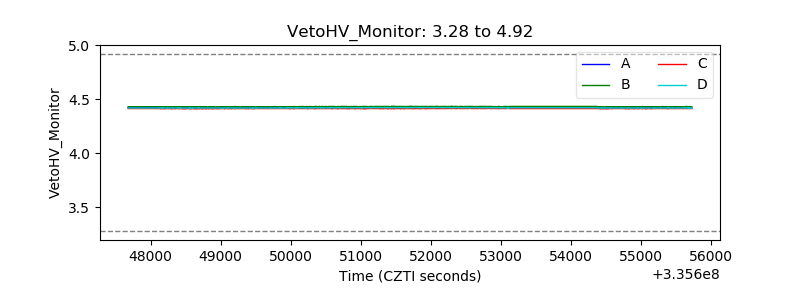 |
| Veto LLD | 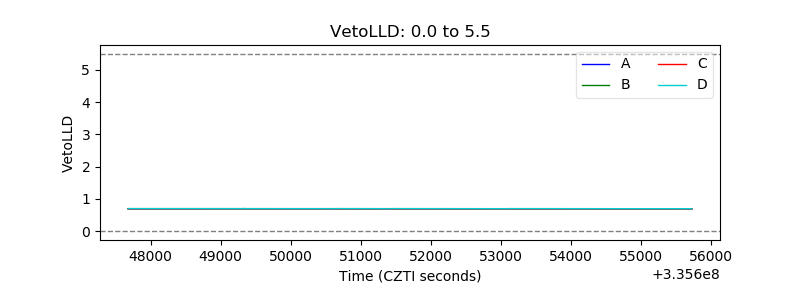 |
| Alpha Counter | 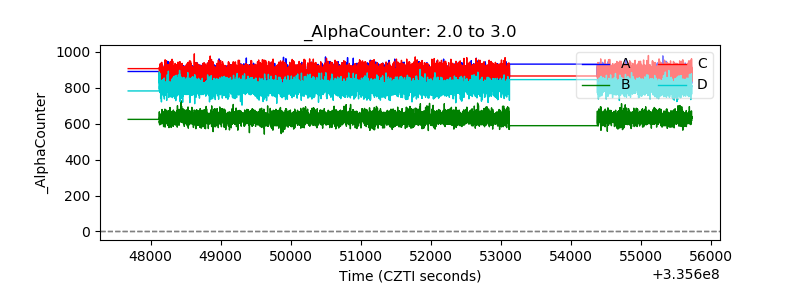 |
| _CPM_Rate | 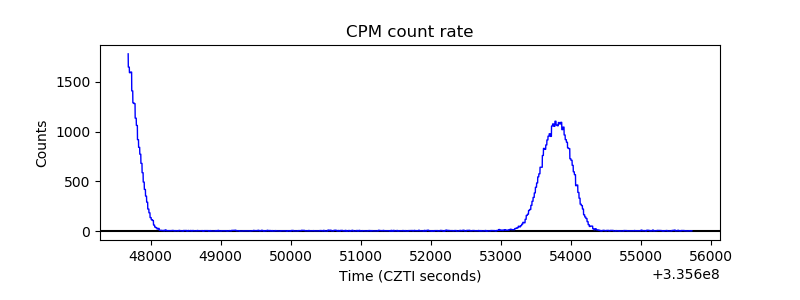 |
| CZT Counter | 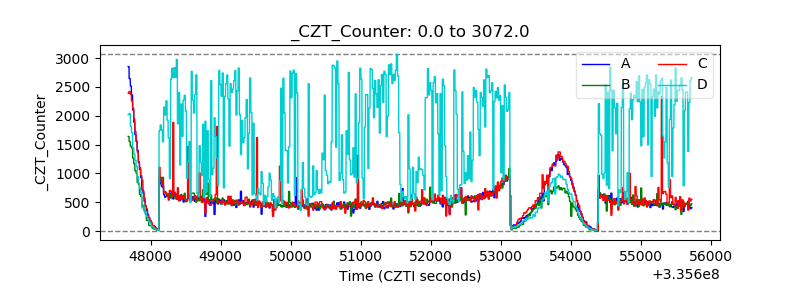 |
| +2.5 Volts monitor | 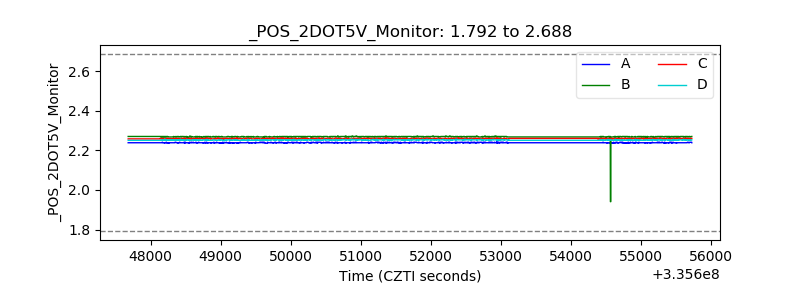 |
| +5 Volts monitor | 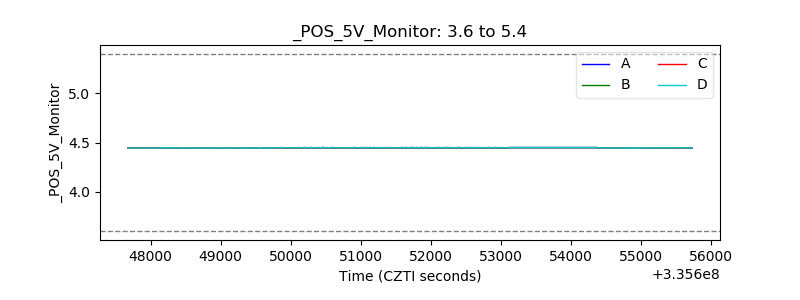 |
| _ROLL_ROT | 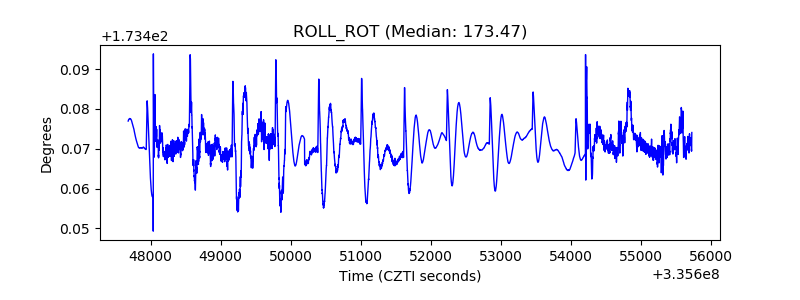 |
| _Roll_DEC | 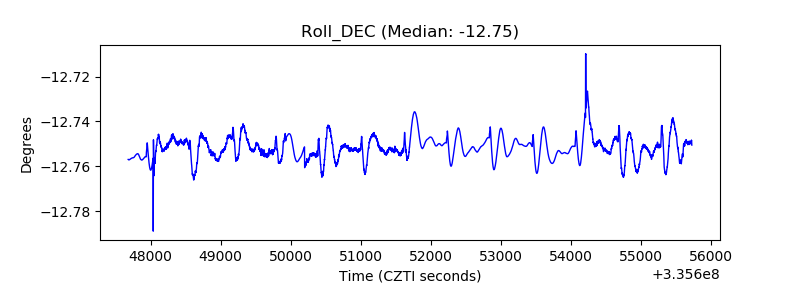 |
| _Roll_RA | 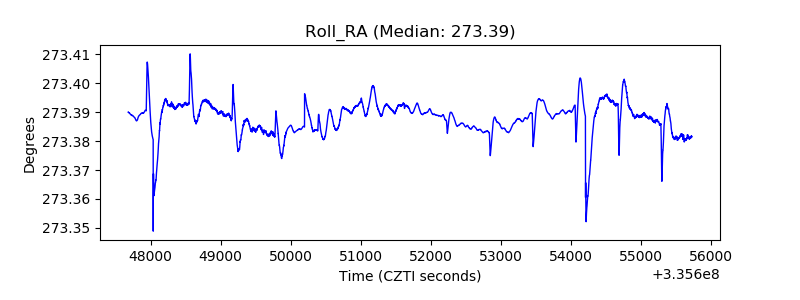 |
| Veto Counter | 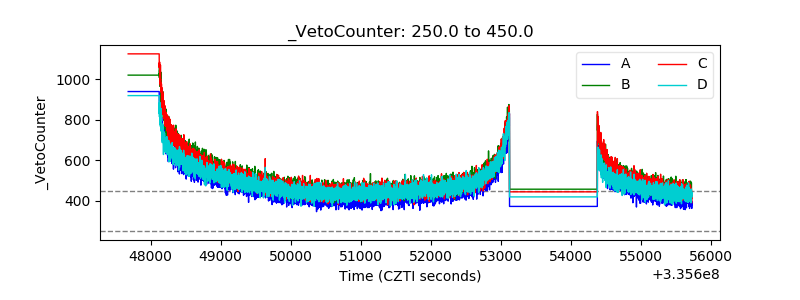 |