| Param | Original file | Final file |
|---|---|---|
| Filename | modeM0/AS1A09_104T02_9000003826_26477cztM0_level2.evt | modeM0/AS1A09_104T02_9000003826_26477cztM0_level2_quad_clean.evt |
| Size (bytes) | 646,070,400 | 93,052,800 |
| Size | 616.1 MB | 88.7 MB |
| Events in quadrant A | 3,245,077 | 632,079 |
| Events in quadrant B | 3,337,962 | 643,416 |
| Events in quadrant C | 3,448,450 | 603,357 |
| Events in quadrant D | 9,081,172 | 471,584 |
| Mode M0 | |||
|---|---|---|---|
| Quadrant | BADHDUFLAG | Total packets | Discarded packets |
| A | 0 | 13907 | 0 |
| B | 0 | 14119 | 0 |
| C | 0 | 14414 | 0 |
| D | 0 | 31517 | 0 |
| Mode M9 | |||
|---|---|---|---|
| Quadrant | BADHDUFLAG | Total packets | Discarded packets |
| A | 0 | 20 | 0 |
| B | 0 | 21 | 0 |
| C | 0 | 21 | 0 |
| D | 0 | 21 | 0 |
| Quadrant | Total seconds | Saturated seconds | Saturation percentage |
|---|---|---|---|
| A | 6702 | 16 | 0.238735% |
| B | 6701 | 30 | 0.447694% |
| C | 6701 | 79 | 1.178929% |
| D | 6701 | 2128 | 31.756454% |
Noise dominated data is calculated using 1-second bins in cleaned event files. If a bin has >2000 counts, and if more than 50% of those come from <1% of pixels, then it is considered to be noise-dominated and hence unusable.
| Quadrant | # 1 sec bins | Bins with >0 counts | Bins with >2000 counts | High rate bins dominated by noise | Noise dominated (total time) | Noise dominated (detector-on time) | Marked lightcurve |
|---|---|---|---|---|---|---|---|
| A | 7622 | 6703 | 0 | 0 | 0.00% | 0.00% | 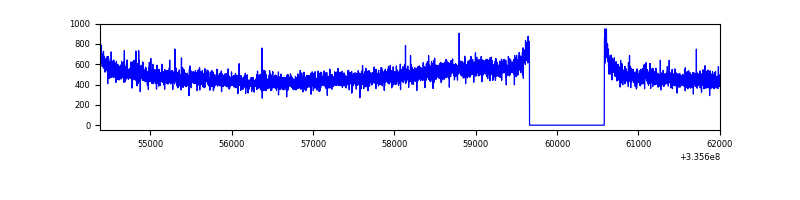 |
| B | 7621 | 6702 | 3 | 3 | 0.04% | 0.04% | 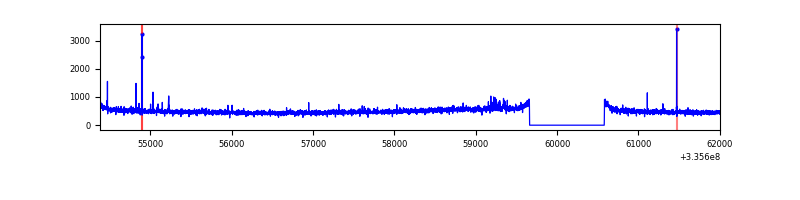 |
| C | 7621 | 6702 | 9 | 9 | 0.12% | 0.13% | 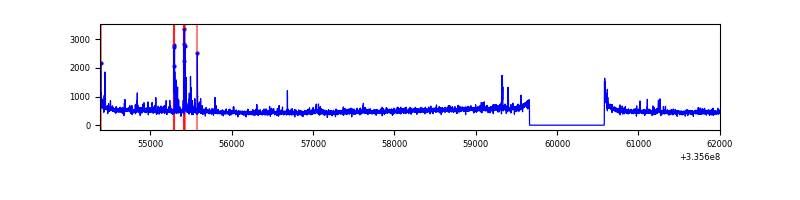 |
| D | 7621 | 6702 | 1878 | 1878 | 24.64% | 28.02% | 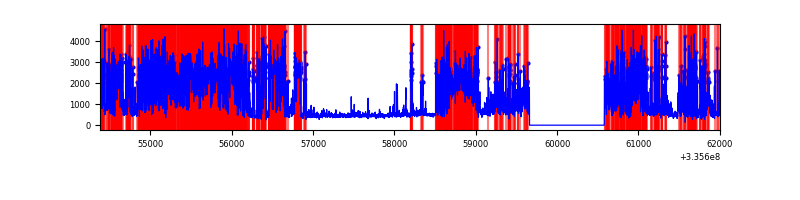 |
Top three noisy pixels from each quadrant. If the there are fewer than three noisy pixels in the level2.evt file, extra rows are filled as -1
| Pixel properties | Quadrant properties | ||||||
|---|---|---|---|---|---|---|---|
| Quadrant | DetID | PixID | Counts | Sigma | Mean | Median | Sigma |
| A | 13 | 254 | 11330 | 62.14 | 839 | 824 | 169.1 |
| A | 0 | 13 | 9008 | 48.41 | 839 | 824 | 169.1 |
| A | 3 | 137 | 7696 | 40.65 | 839 | 824 | 169.1 |
| B | 0 | 190 | 24926 | 151.39 | 839 | 818 | 159.2 |
| B | 12 | 111 | 19290 | 116.0 | 839 | 818 | 159.2 |
| B | 11 | 111 | 17171 | 102.69 | 839 | 818 | 159.2 |
| C | 14 | 238 | 128449 | 676.23 | 800 | 805 | 188.8 |
| C | 3 | 233 | 86698 | 455.04 | 800 | 805 | 188.8 |
| C | 2 | 16 | 83719 | 439.26 | 800 | 805 | 188.8 |
| D | 7 | 80 | 5147570 | 30771.49 | 698 | 680 | 167.3 |
| D | 1 | 52 | 1105193 | 6603.5 | 698 | 680 | 167.3 |
| D | 12 | 233 | 108726 | 645.97 | 698 | 680 | 167.3 |
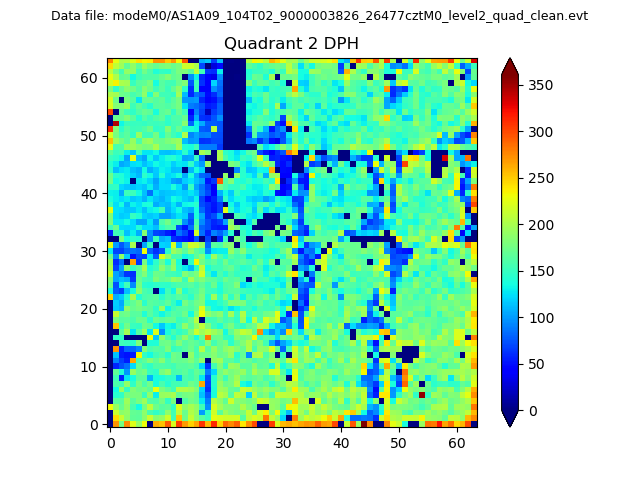
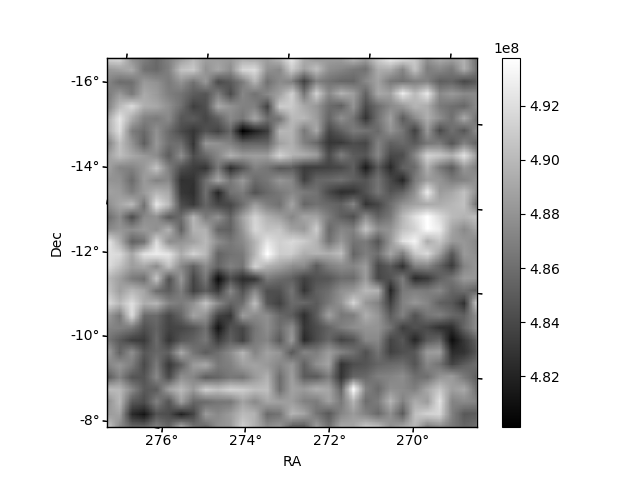
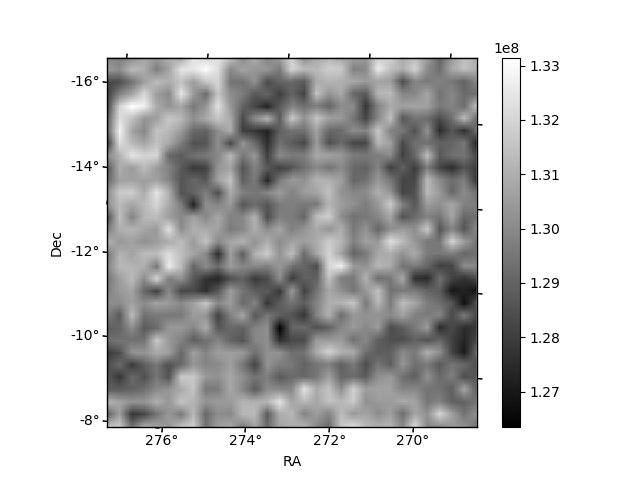
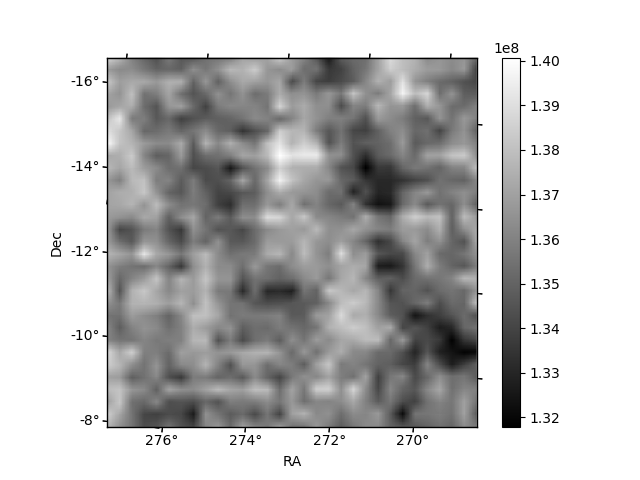
Histogram calculated using DETX and DETY for each event in the final _common_clean file
| Quadrant A | 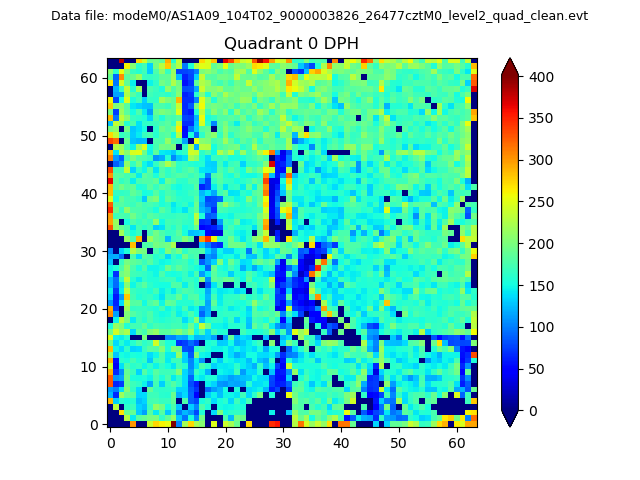 |
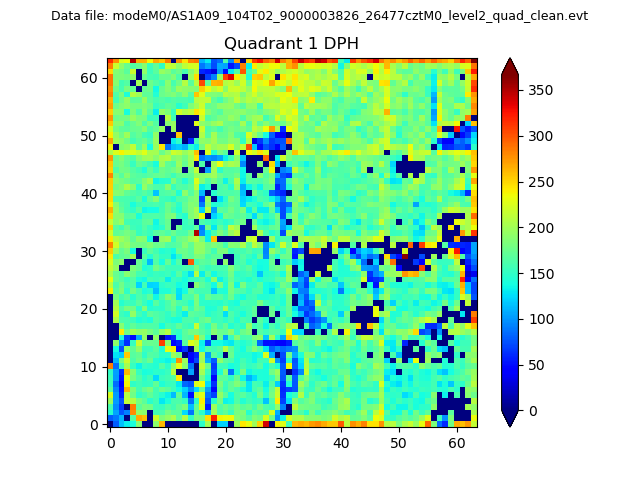 |
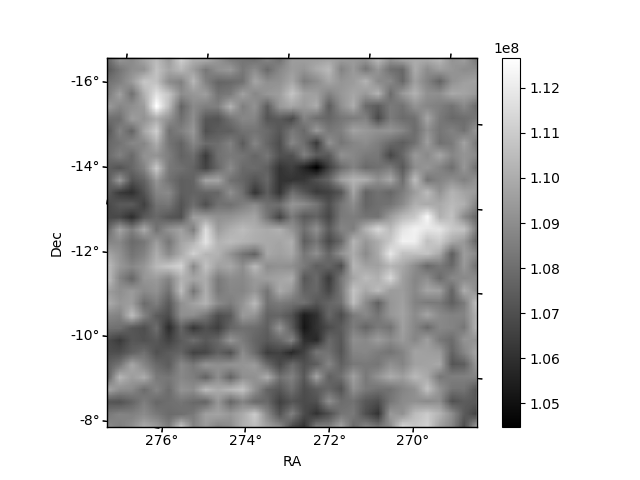
Quadrant B |
|---|---|---|---|
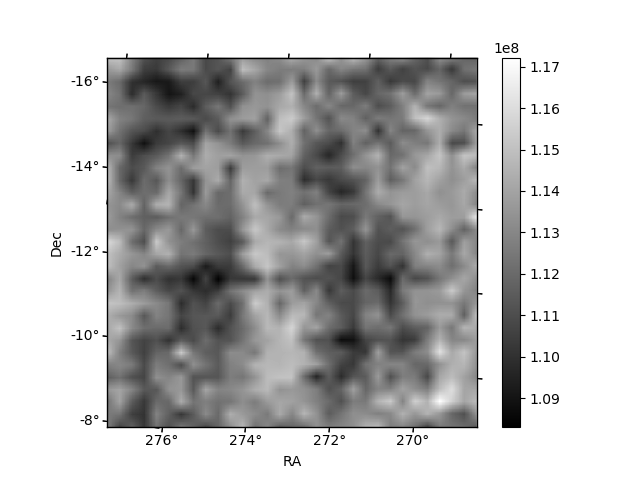
| Quadrant D | 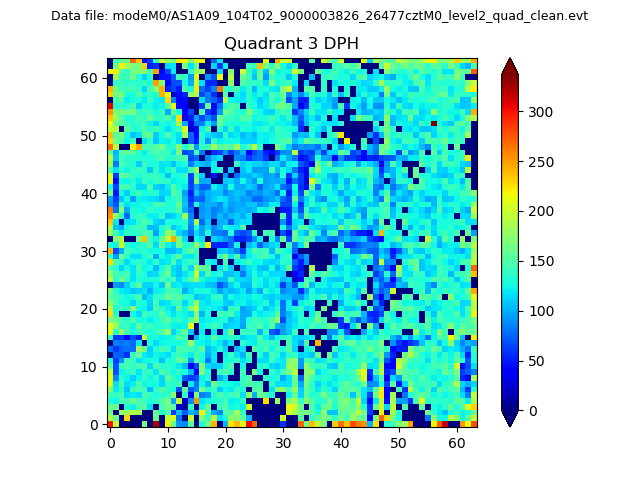 |
 |
Quadrant C |
| Plot type | Count rate plots | Images |
|---|---|---|
| Comparison with Poisson distribution Blue bars denote a histogram of data divided into 1 sec bins. Red curve is a Poisson curve with rate = median count rate of data. |
 |
 |
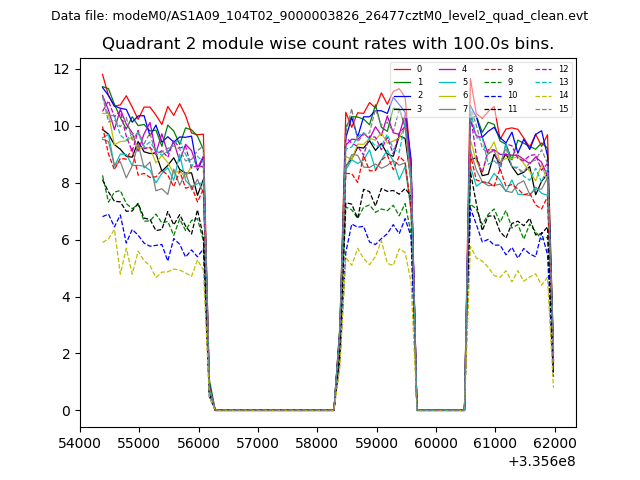
| Quadrant-wise count rates Data is divided into 100 sec bins |
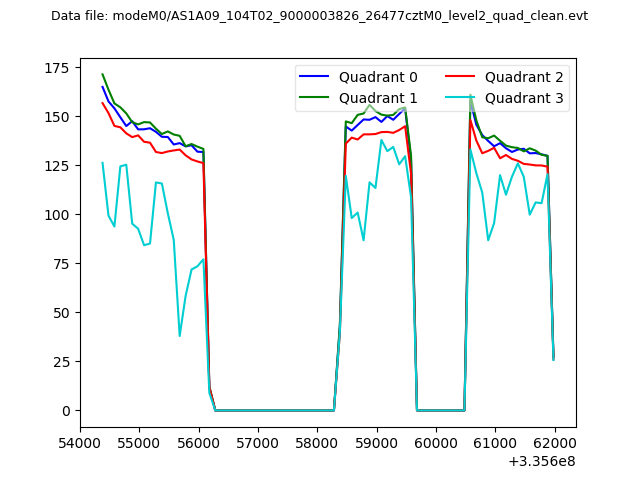 |
|
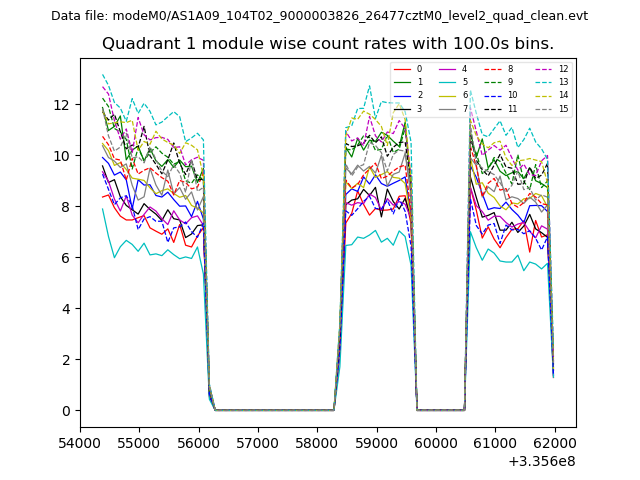
| Module-wise count rates for Quadrant A Data is divided into 100 sec bins |
 |
 |
| Module-wise count rates for Quadrant B Data is divided into 100 sec bins |
 |
 |
| Module-wise count rates for Quadrant C Data is divided into 100 sec bins |
 |
 |
| Module-wise count rates for Quadrant D Data is divided into 100 sec bins |
 |
 |
| Parameter | Plot |
|---|---|
| CZT HV Monitor | 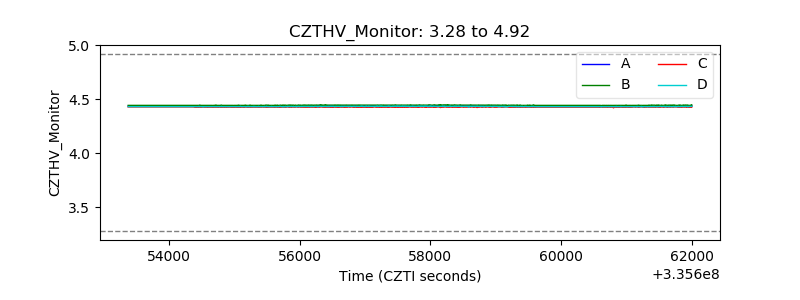 |
| D_VDD | 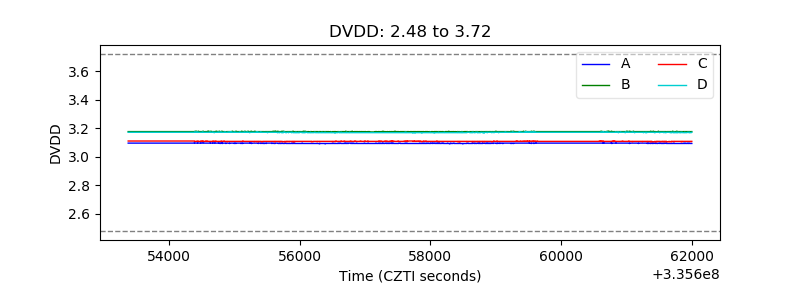 |
| Temperature 1 | 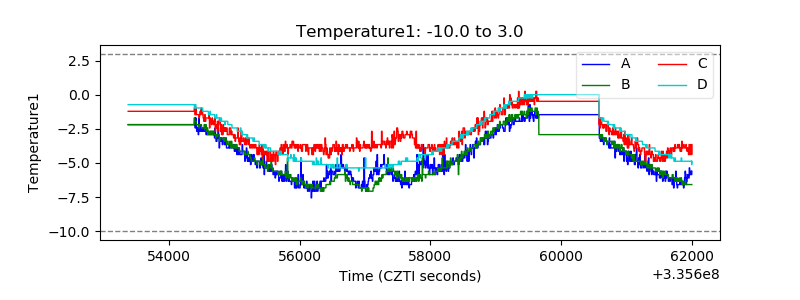 |
| Veto HV Monitor | 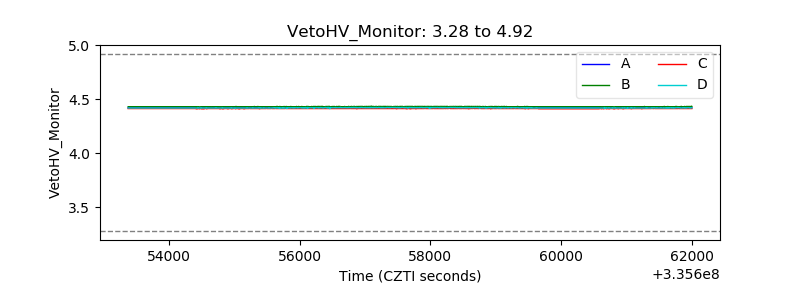 |
| Veto LLD | 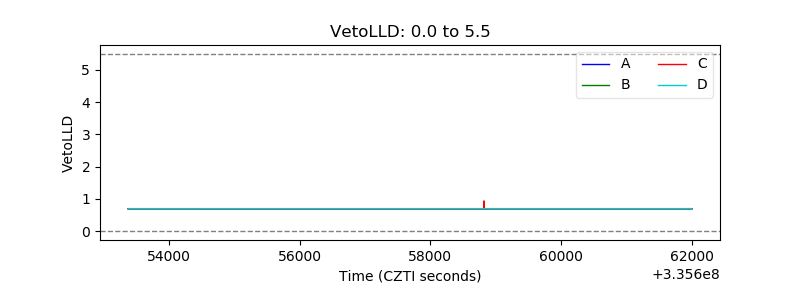 |
| Alpha Counter | 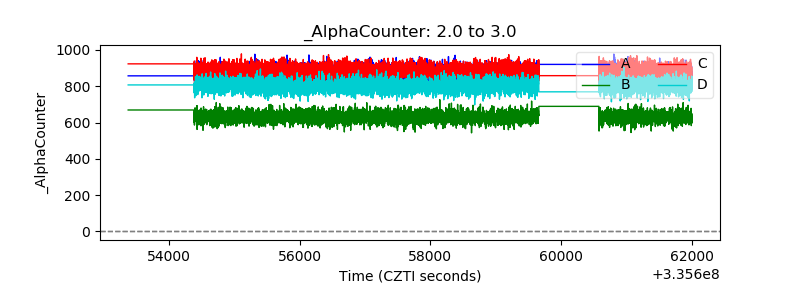 |
| _CPM_Rate | 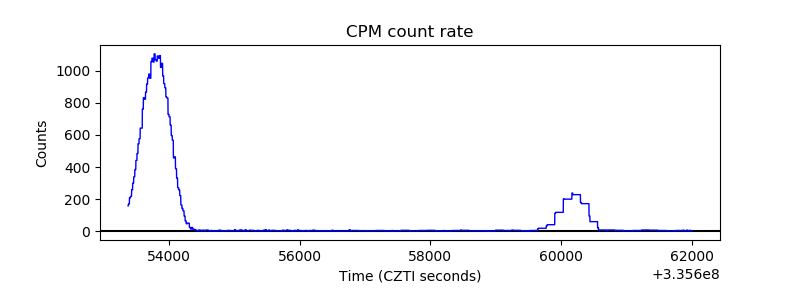 |
| CZT Counter | 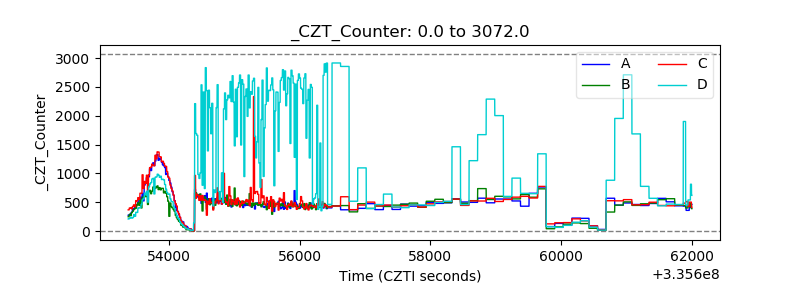 |
| +2.5 Volts monitor |  |
| +5 Volts monitor | 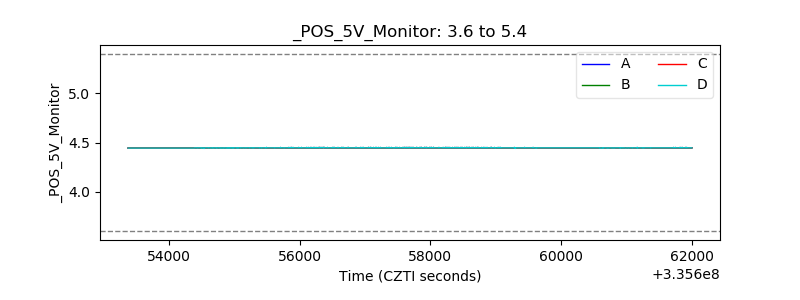 |
| _ROLL_ROT | 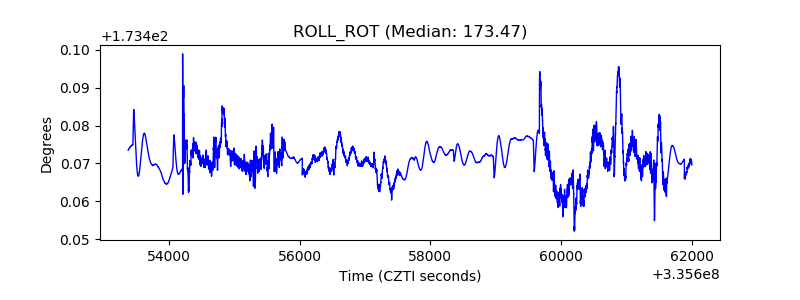 |
| _Roll_DEC | 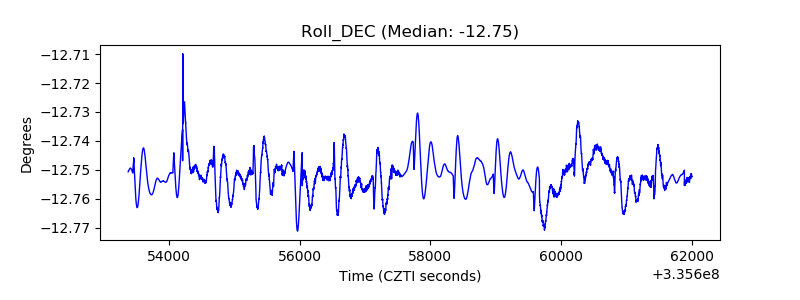 |
| _Roll_RA | 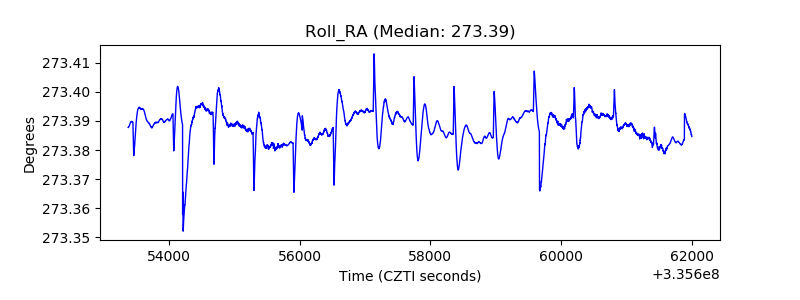 |
| Veto Counter |  |