| Param | Original file | Final file |
|---|---|---|
| Filename | modeM0/AS1A09_104T02_9000003826_26478cztM0_level2.evt | modeM0/AS1A09_104T02_9000003826_26478cztM0_level2_quad_clean.evt |
| Size (bytes) | 616,308,480 | 95,855,040 |
| Size | 587.8 MB | 91.4 MB |
| Events in quadrant A | 3,418,806 | 625,379 |
| Events in quadrant B | 3,514,607 | 632,399 |
| Events in quadrant C | 3,521,627 | 598,959 |
| Events in quadrant D | 7,724,032 | 546,327 |
| Mode M0 | |||
|---|---|---|---|
| Quadrant | BADHDUFLAG | Total packets | Discarded packets |
| A | 0 | 14770 | 0 |
| B | 0 | 14949 | 0 |
| C | 0 | 14969 | 0 |
| D | 0 | 27923 | 0 |
| Mode M9 | |||
|---|---|---|---|
| Quadrant | BADHDUFLAG | Total packets | Discarded packets |
| A | 0 | 8 | 0 |
| B | 0 | 9 | 0 |
| C | 0 | 9 | 0 |
| D | 0 | 9 | 0 |
| Quadrant | Total seconds | Saturated seconds | Saturation percentage |
|---|---|---|---|
| A | 7181 | 21 | 0.292438% |
| B | 7181 | 51 | 0.710207% |
| C | 7181 | 65 | 0.905166% |
| D | 7180 | 1067 | 14.860724% |
Noise dominated data is calculated using 1-second bins in cleaned event files. If a bin has >2000 counts, and if more than 50% of those come from <1% of pixels, then it is considered to be noise-dominated and hence unusable.
| Quadrant | # 1 sec bins | Bins with >0 counts | Bins with >2000 counts | High rate bins dominated by noise | Noise dominated (total time) | Noise dominated (detector-on time) | Marked lightcurve |
|---|---|---|---|---|---|---|---|
| A | 7671 | 7182 | 0 | 0 | 0.00% | 0.00% | 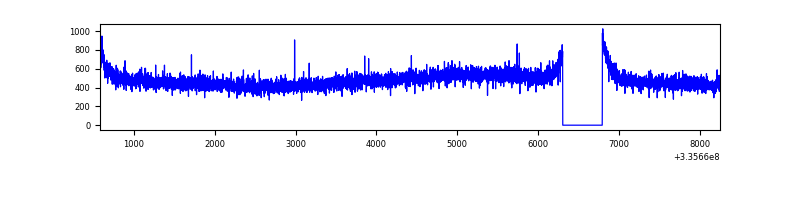 |
| B | 7671 | 7182 | 4 | 4 | 0.05% | 0.06% | 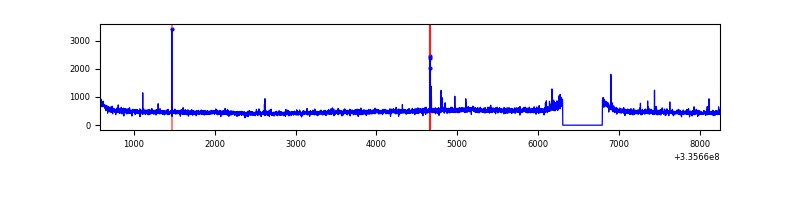 |
| C | 7671 | 7182 | 0 | 0 | 0.00% | 0.00% |  |
| D | 7670 | 7181 | 876 | 876 | 11.42% | 12.20% | 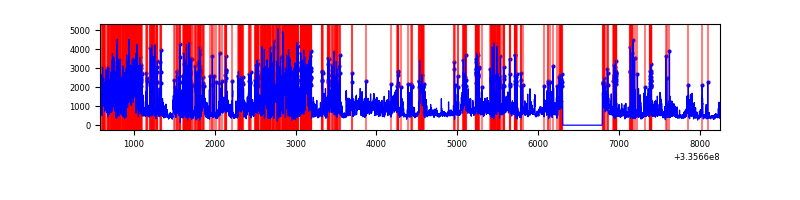 |
Top three noisy pixels from each quadrant. If the there are fewer than three noisy pixels in the level2.evt file, extra rows are filled as -1
| Pixel properties | Quadrant properties | ||||||
|---|---|---|---|---|---|---|---|
| Quadrant | DetID | PixID | Counts | Sigma | Mean | Median | Sigma |
| A | 13 | 254 | 11488 | 59.48 | 885 | 867 | 178.6 |
| A | 3 | 137 | 8309 | 41.68 | 885 | 867 | 178.6 |
| A | 0 | 226 | 7640 | 37.93 | 885 | 867 | 178.6 |
| B | 15 | 32 | 21750 | 122.68 | 882 | 860 | 170.3 |
| B | 0 | 230 | 21468 | 121.03 | 882 | 860 | 170.3 |
| B | 12 | 111 | 20565 | 115.73 | 882 | 860 | 170.3 |
| C | 14 | 238 | 133762 | 673.71 | 843 | 850 | 197.3 |
| C | 3 | 233 | 80225 | 402.34 | 843 | 850 | 197.3 |
| C | 14 | 176 | 11831 | 55.66 | 843 | 850 | 197.3 |
| D | 7 | 80 | 3663871 | 19200.86 | 798 | 779 | 190.8 |
| D | 1 | 52 | 806217 | 4221.87 | 798 | 779 | 190.8 |
| D | 12 | 233 | 140458 | 732.16 | 798 | 779 | 190.8 |
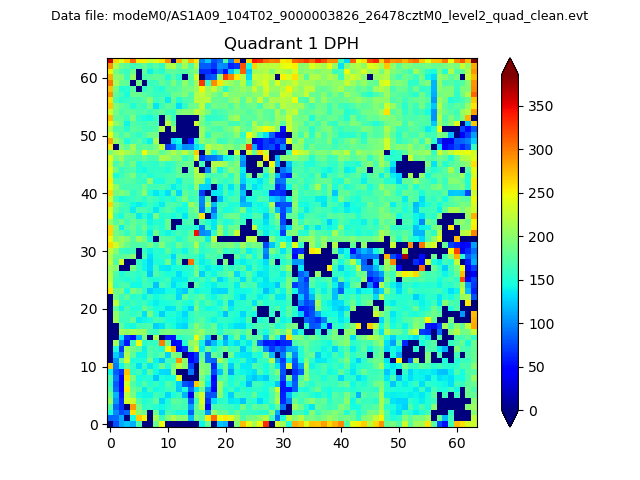
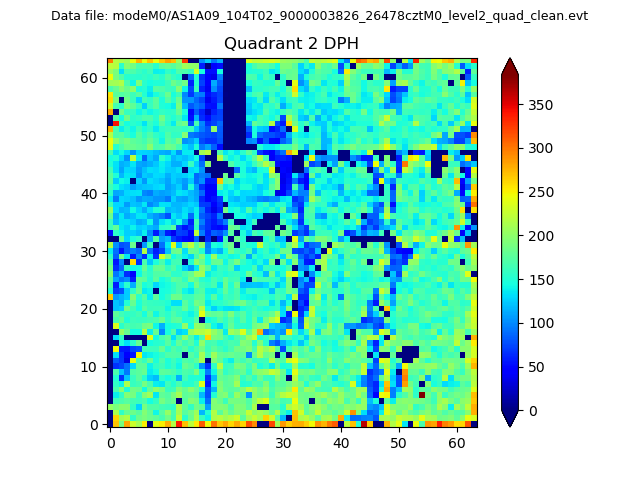
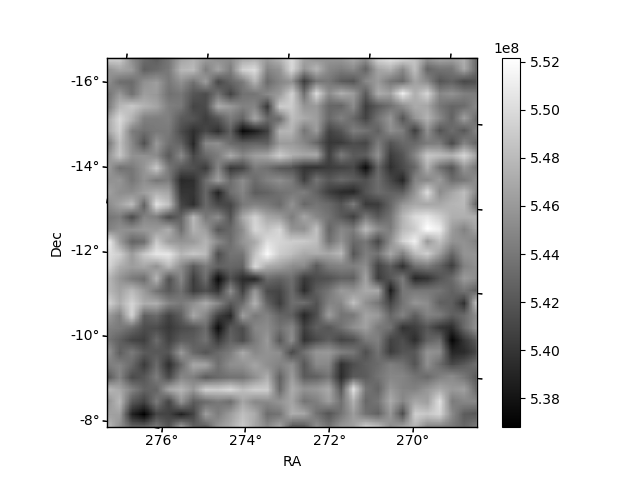
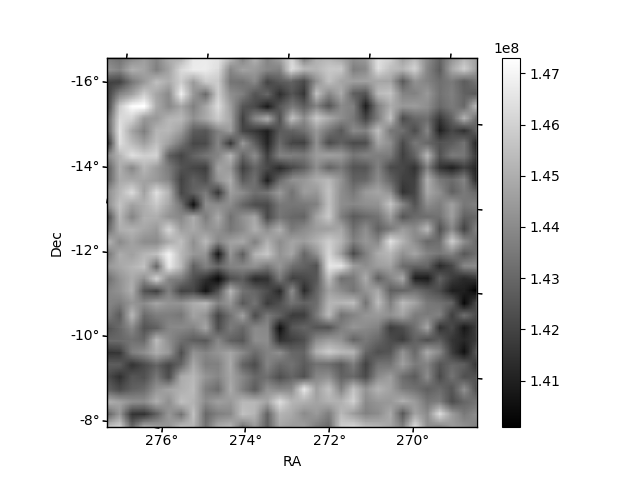
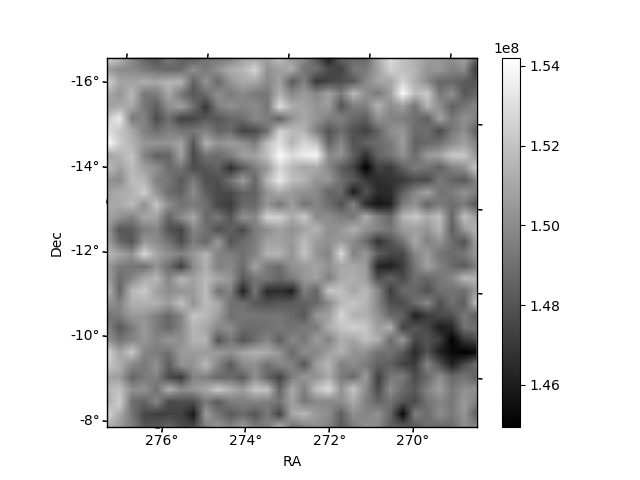
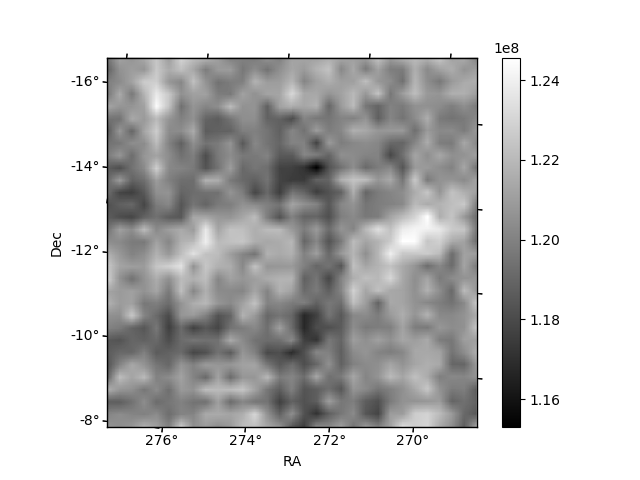
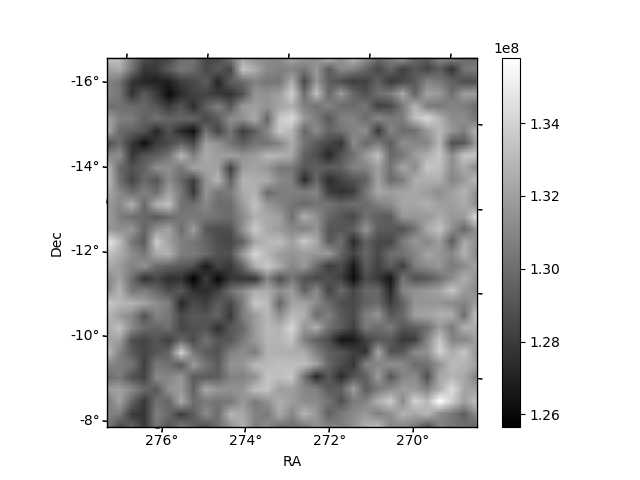
Histogram calculated using DETX and DETY for each event in the final _common_clean file
| Quadrant A | 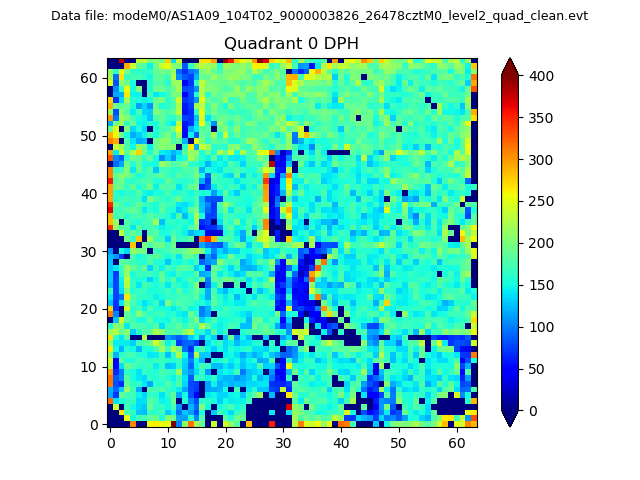 |
 |
Quadrant B |
|---|---|---|---|
| Quadrant D | 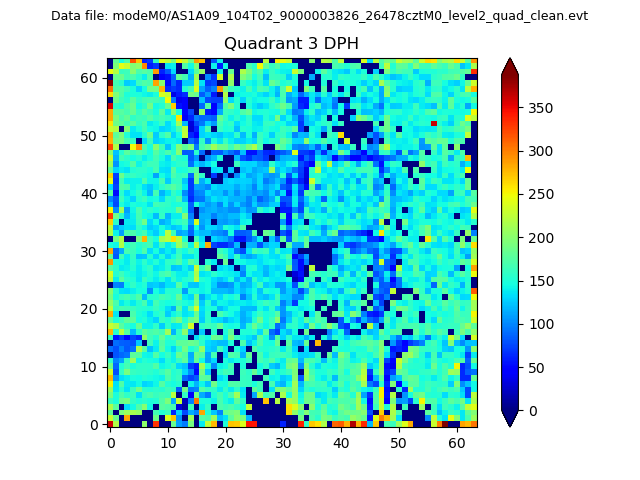 |
 |
Quadrant C |
| Plot type | Count rate plots | Images |
|---|---|---|
| Comparison with Poisson distribution Blue bars denote a histogram of data divided into 1 sec bins. Red curve is a Poisson curve with rate = median count rate of data. |
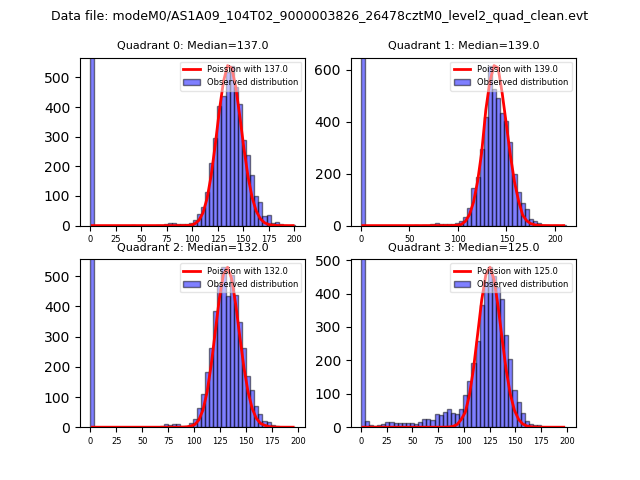 |
 |
| Quadrant-wise count rates Data is divided into 100 sec bins |
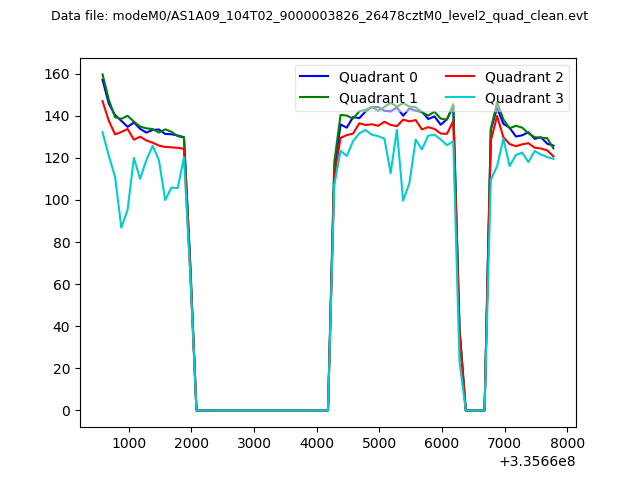 |
|
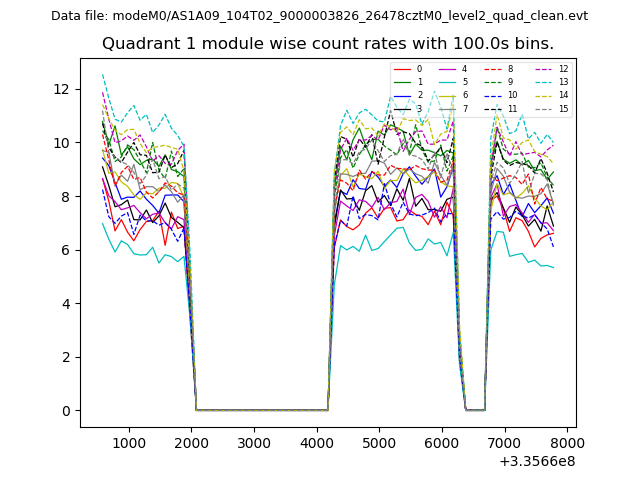
| Module-wise count rates for Quadrant A Data is divided into 100 sec bins |
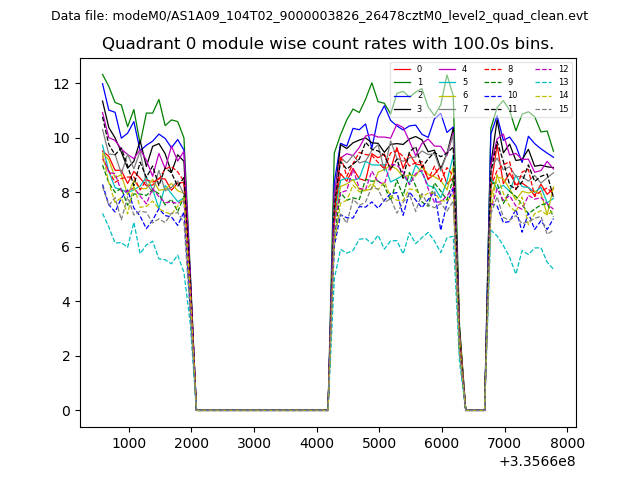 |
 |
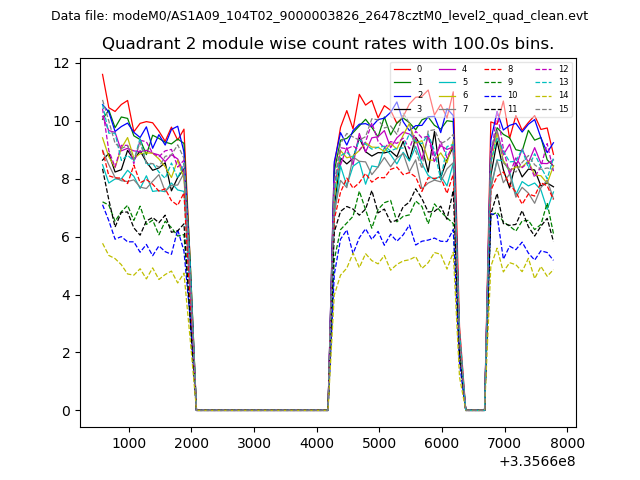
| Module-wise count rates for Quadrant B Data is divided into 100 sec bins |
 |
 |
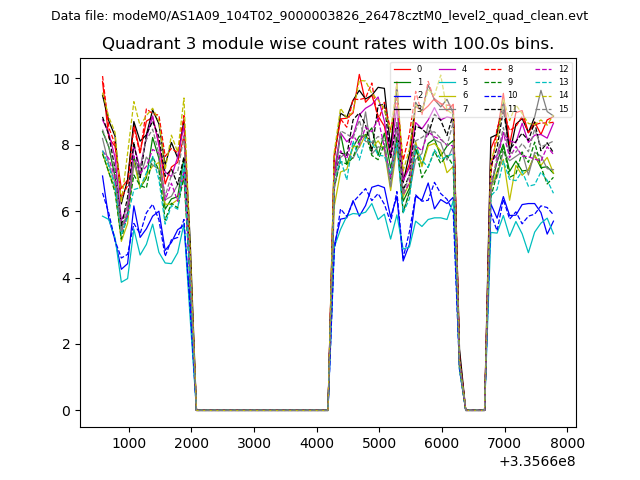
| Module-wise count rates for Quadrant C Data is divided into 100 sec bins |
 |
 |
| Module-wise count rates for Quadrant D Data is divided into 100 sec bins |
 |
 |
| Parameter | Plot |
|---|---|
| CZT HV Monitor | 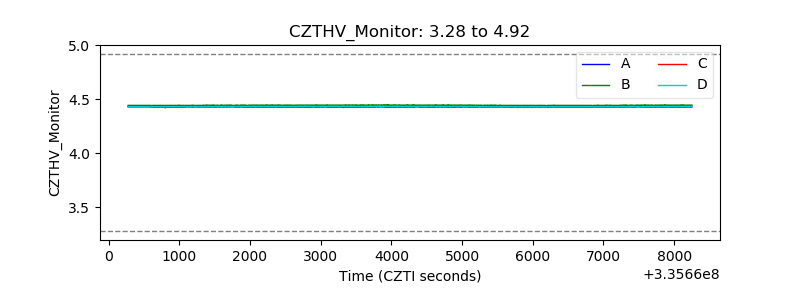 |
| D_VDD | 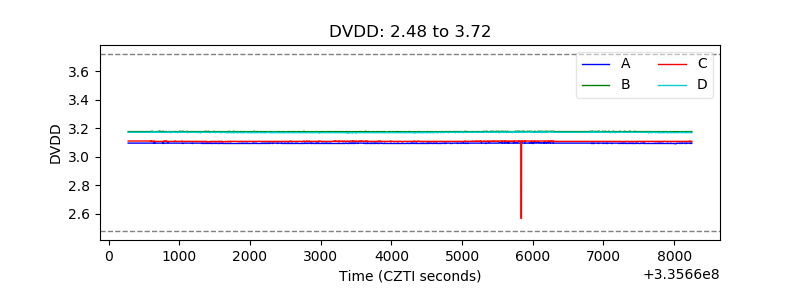 |
| Temperature 1 | 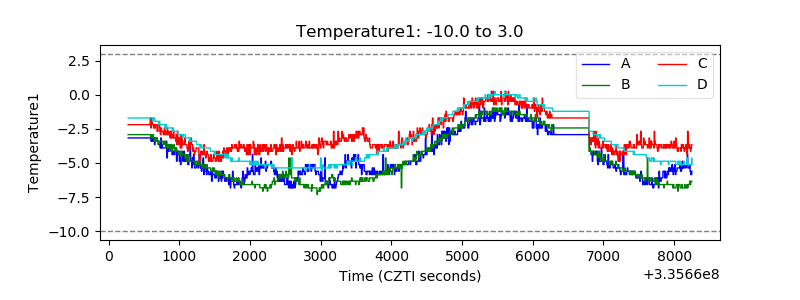 |
| Veto HV Monitor | 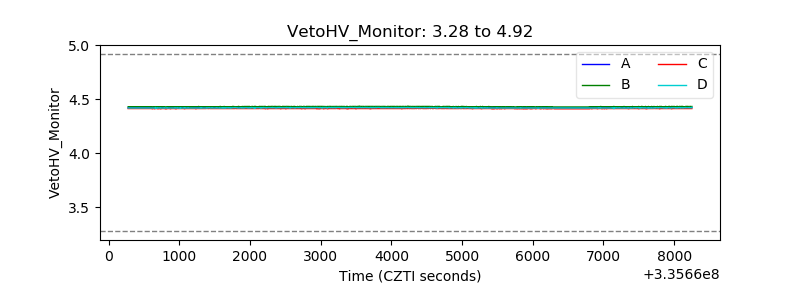 |
| Veto LLD | 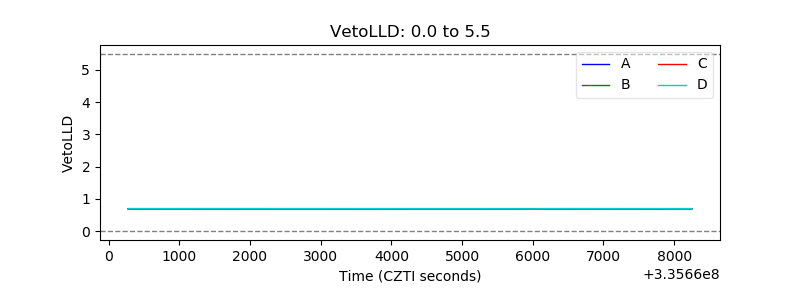 |
| Alpha Counter | 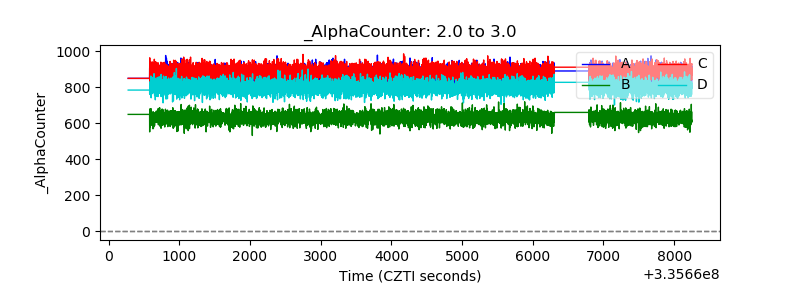 |
| _CPM_Rate | 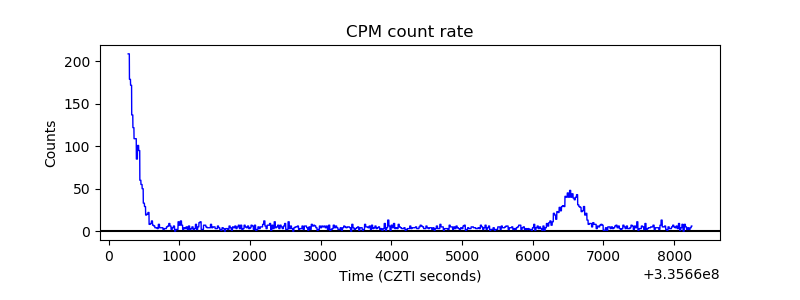 |
| CZT Counter | 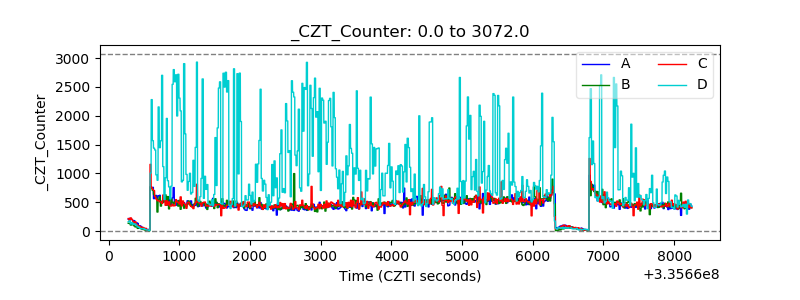 |
| +2.5 Volts monitor |  |
| +5 Volts monitor |  |
| _ROLL_ROT | 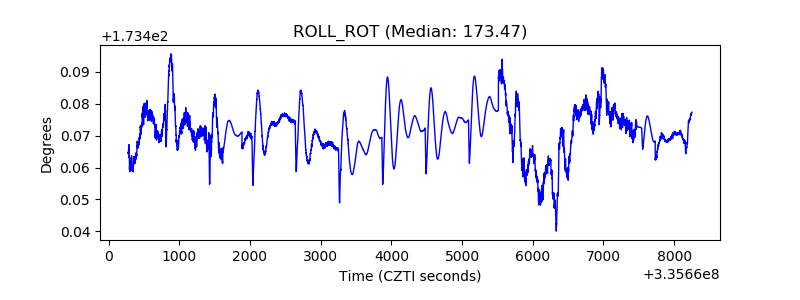 |
| _Roll_DEC | 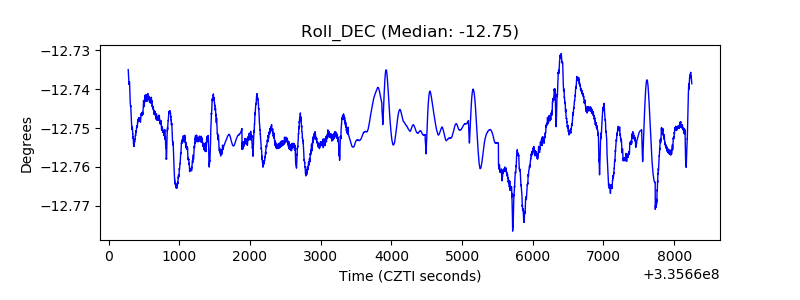 |
| _Roll_RA | 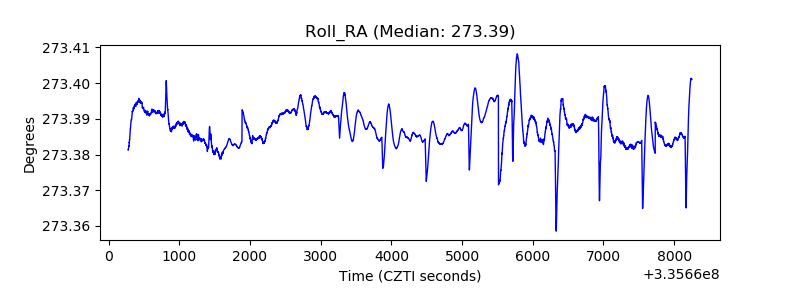 |
| Veto Counter | 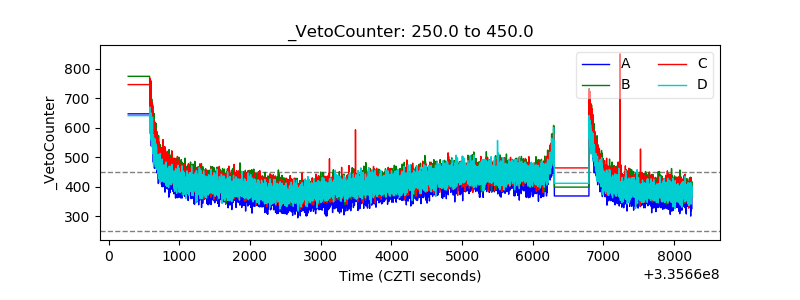 |