| Param | Original file | Final file |
|---|---|---|
| Filename | modeM0/AS1A09_104T02_9000003826_26479cztM0_level2.evt | modeM0/AS1A09_104T02_9000003826_26479cztM0_level2_quad_clean.evt |
| Size (bytes) | 626,699,520 | 96,073,920 |
| Size | 597.7 MB | 91.6 MB |
| Events in quadrant A | 3,708,622 | 620,562 |
| Events in quadrant B | 3,832,474 | 628,509 |
| Events in quadrant C | 3,974,878 | 596,434 |
| Events in quadrant D | 6,938,094 | 524,176 |
| Mode M0 | |||
|---|---|---|---|
| Quadrant | BADHDUFLAG | Total packets | Discarded packets |
| A | 0 | 16070 | 0 |
| B | 0 | 16311 | 0 |
| C | 0 | 16776 | 0 |
| D | 0 | 25952 | 0 |
| Mode M9 | |||
|---|---|---|---|
| Quadrant | BADHDUFLAG | Total packets | Discarded packets |
| A | 0 | 7 | 0 |
| B | 0 | 7 | 0 |
| C | 0 | 7 | 0 |
| D | 0 | 7 | 0 |
| Quadrant | Total seconds | Saturated seconds | Saturation percentage |
|---|---|---|---|
| A | 7751 | 53 | 0.683783% |
| B | 7752 | 106 | 1.367389% |
| C | 7752 | 107 | 1.380289% |
| D | 7751 | 971 | 12.527416% |
Noise dominated data is calculated using 1-second bins in cleaned event files. If a bin has >2000 counts, and if more than 50% of those come from <1% of pixels, then it is considered to be noise-dominated and hence unusable.
| Quadrant | # 1 sec bins | Bins with >0 counts | Bins with >2000 counts | High rate bins dominated by noise | Noise dominated (total time) | Noise dominated (detector-on time) | Marked lightcurve |
|---|---|---|---|---|---|---|---|
| A | 8481 | 7753 | 0 | 0 | 0.00% | 0.00% | 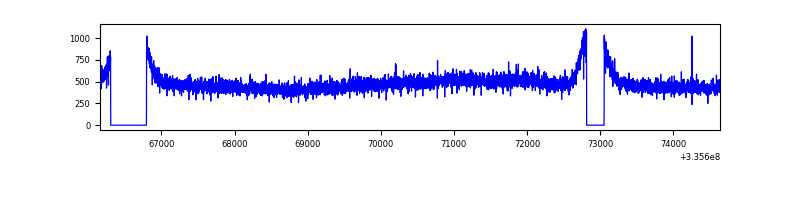 |
| B | 8482 | 7753 | 2 | 2 | 0.02% | 0.03% | 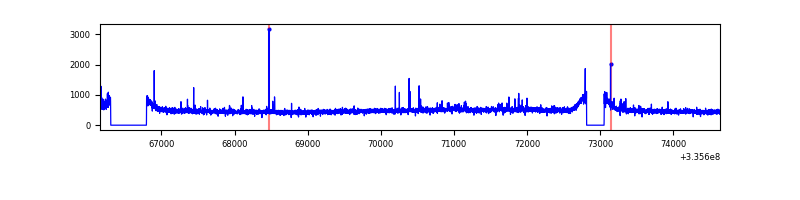 |
| C | 8482 | 7754 | 1 | 1 | 0.01% | 0.01% | 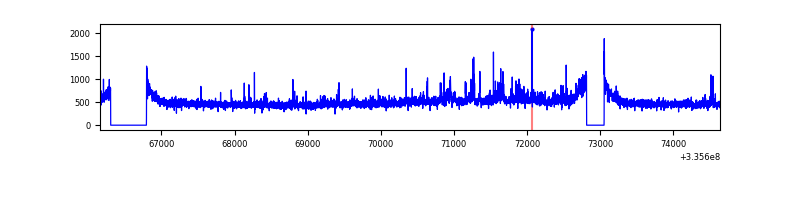 |
| D | 8481 | 7753 | 826 | 826 | 9.74% | 10.65% | 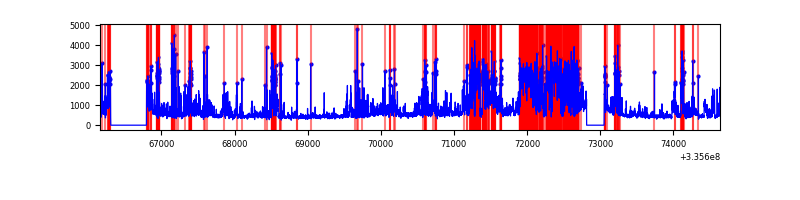 |
Top three noisy pixels from each quadrant. If the there are fewer than three noisy pixels in the level2.evt file, extra rows are filled as -1
| Pixel properties | Quadrant properties | ||||||
|---|---|---|---|---|---|---|---|
| Quadrant | DetID | PixID | Counts | Sigma | Mean | Median | Sigma |
| A | 13 | 254 | 12711 | 60.4 | 960 | 938 | 194.9 |
| A | 3 | 137 | 9103 | 41.89 | 960 | 938 | 194.9 |
| A | 0 | 226 | 8079 | 36.63 | 960 | 938 | 194.9 |
| B | 15 | 32 | 27976 | 146.81 | 957 | 935 | 184.2 |
| B | 0 | 230 | 22921 | 119.37 | 957 | 935 | 184.2 |
| B | 12 | 111 | 22540 | 117.3 | 957 | 935 | 184.2 |
| C | 3 | 233 | 241446 | 1106.67 | 915 | 922 | 217.3 |
| C | 14 | 238 | 143169 | 654.49 | 915 | 922 | 217.3 |
| C | 14 | 176 | 12714 | 54.26 | 915 | 922 | 217.3 |
| D | 7 | 80 | 2692724 | 12883.38 | 870 | 850 | 208.9 |
| D | 1 | 52 | 555268 | 2653.46 | 870 | 850 | 208.9 |
| D | 12 | 233 | 313223 | 1495.03 | 870 | 850 | 208.9 |
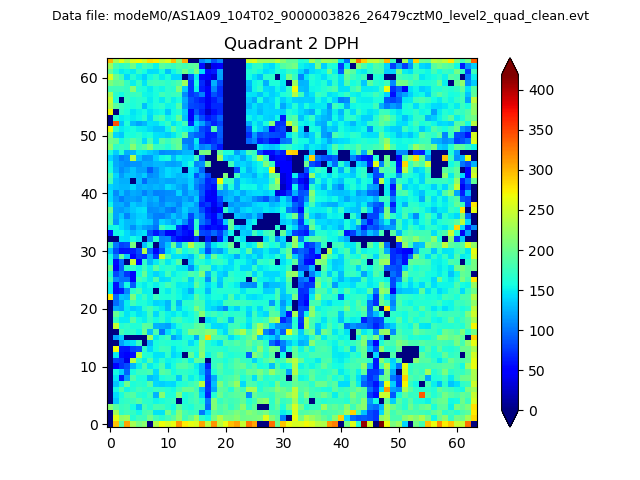
Histogram calculated using DETX and DETY for each event in the final _common_clean file
| Quadrant A | 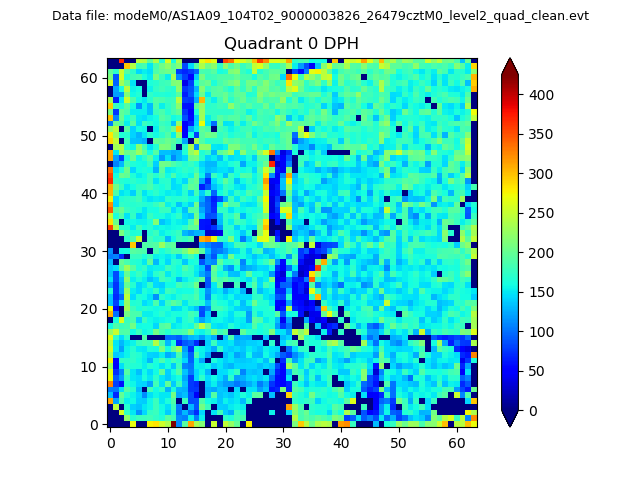 |
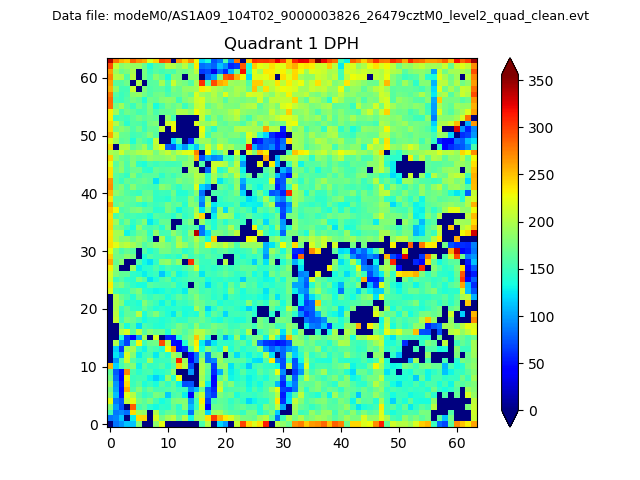 |
Quadrant B |
|---|---|---|---|
| Quadrant D | 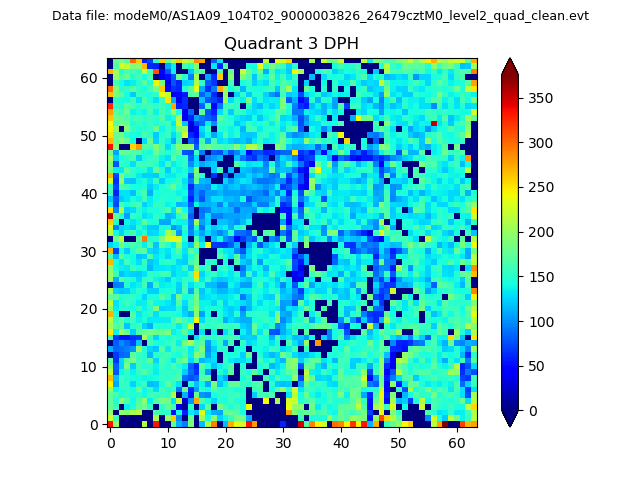 |
 |
Quadrant C |
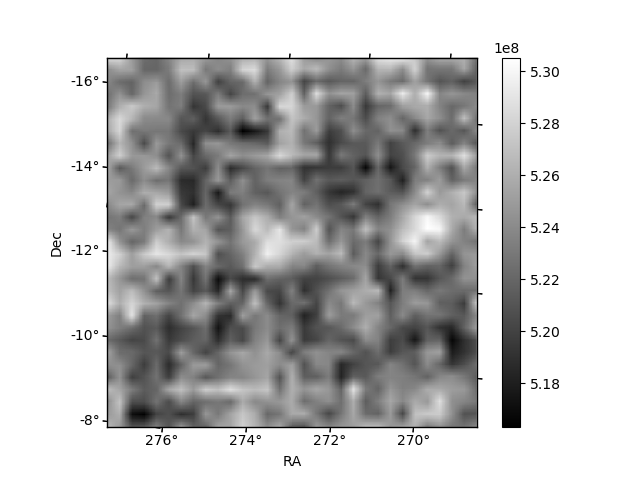
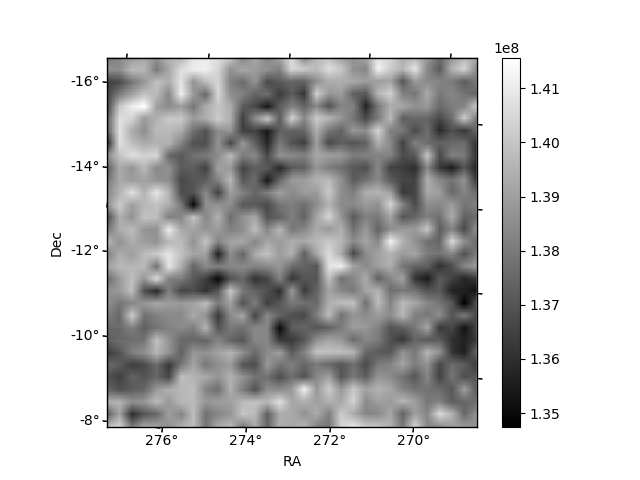
| Plot type | Count rate plots | Images |
|---|---|---|
| Comparison with Poisson distribution Blue bars denote a histogram of data divided into 1 sec bins. Red curve is a Poisson curve with rate = median count rate of data. |
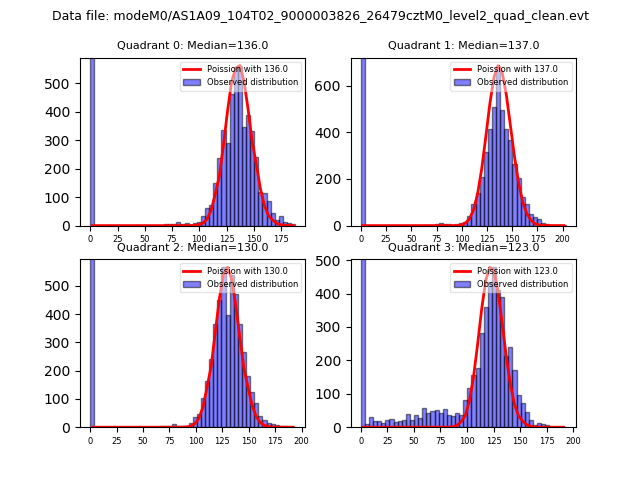 |
 |
| Quadrant-wise count rates Data is divided into 100 sec bins |
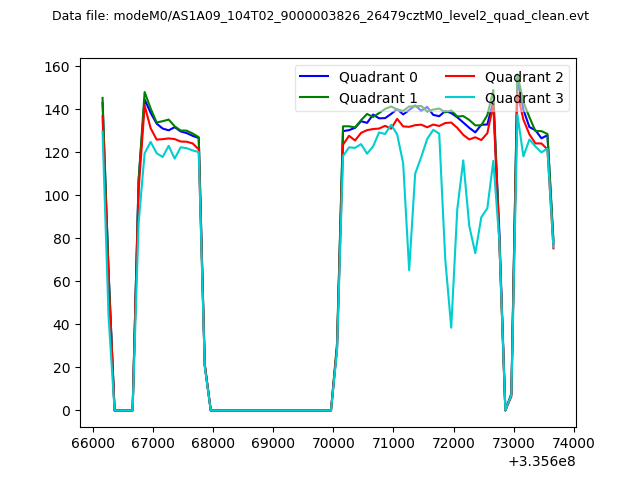 |
|
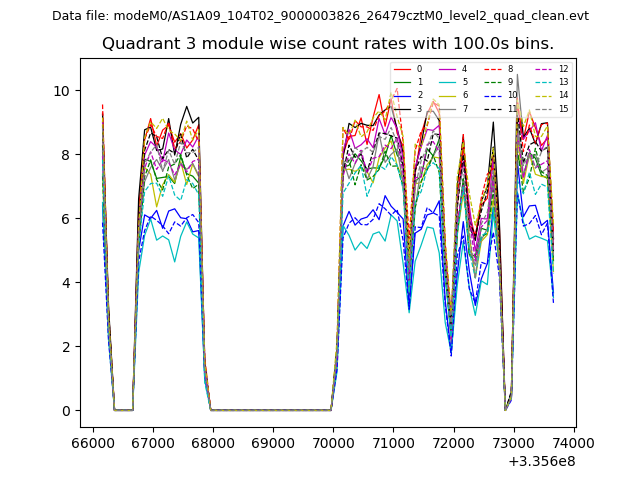
| Module-wise count rates for Quadrant A Data is divided into 100 sec bins |
 |
 |
| Module-wise count rates for Quadrant B Data is divided into 100 sec bins |
 |
 |
| Module-wise count rates for Quadrant C Data is divided into 100 sec bins |
 |
 |
| Module-wise count rates for Quadrant D Data is divided into 100 sec bins |
 |
 |
| Parameter | Plot |
|---|---|
| CZT HV Monitor |  |
| D_VDD | 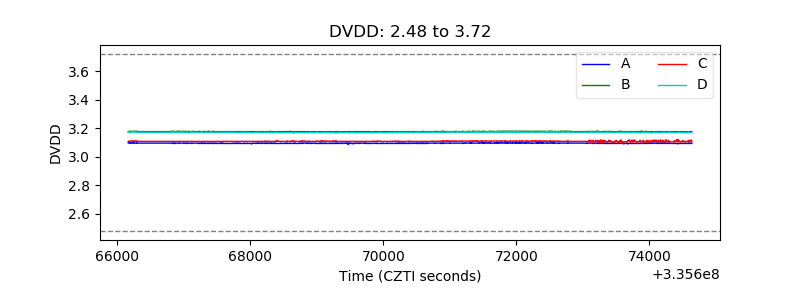 |
| Temperature 1 | 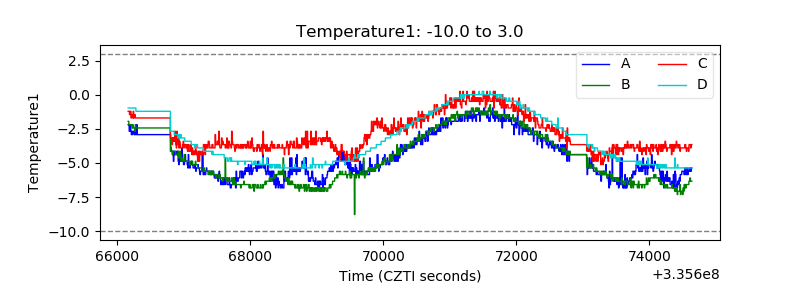 |
| Veto HV Monitor | 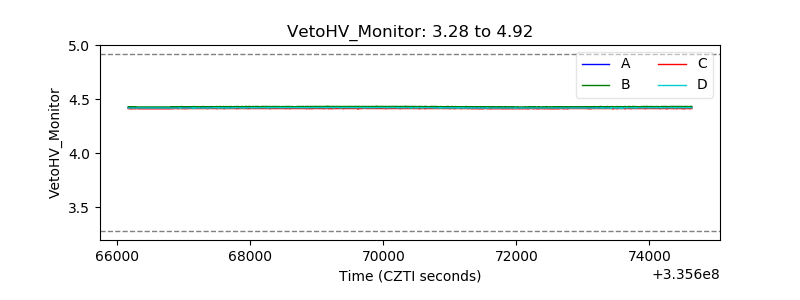 |
| Veto LLD | 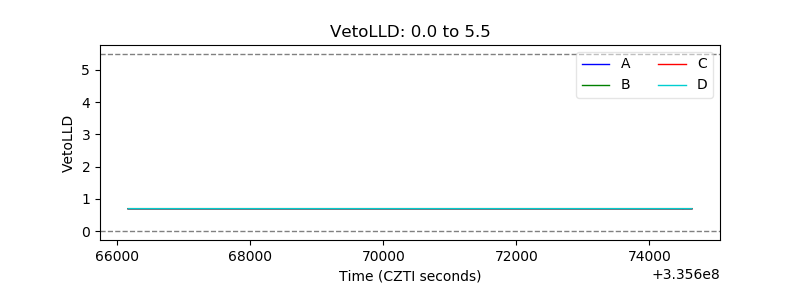 |
| Alpha Counter | 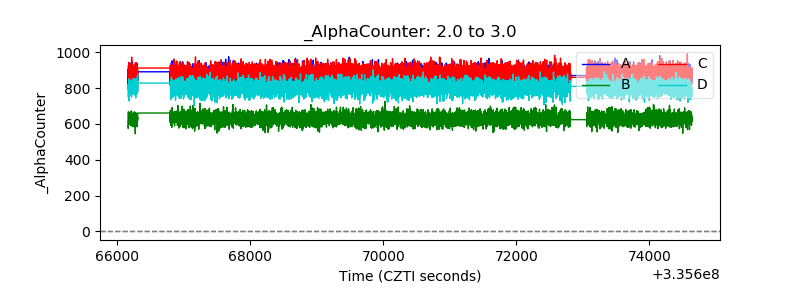 |
| _CPM_Rate | 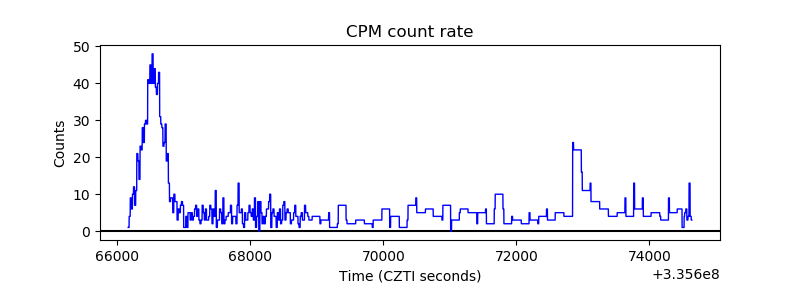 |
| CZT Counter | 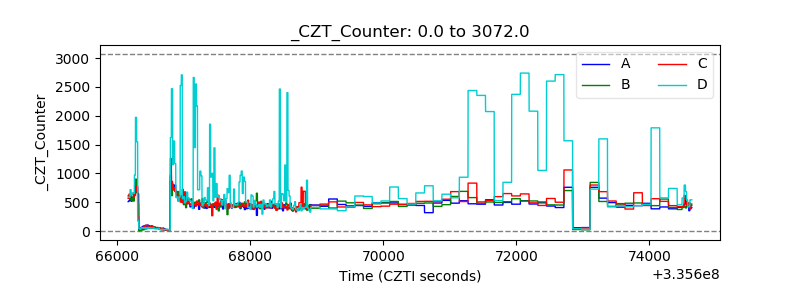 |
| +2.5 Volts monitor |  |
| +5 Volts monitor |  |
| _ROLL_ROT | 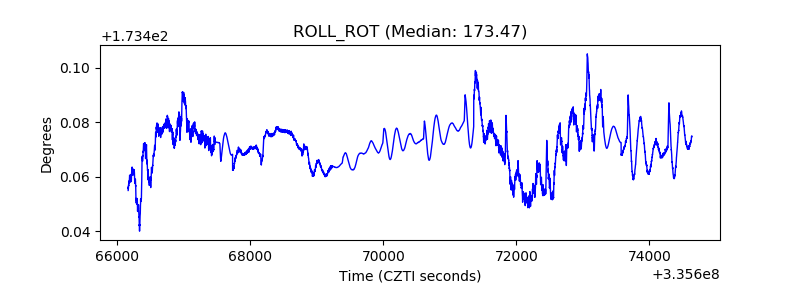 |
| _Roll_DEC | 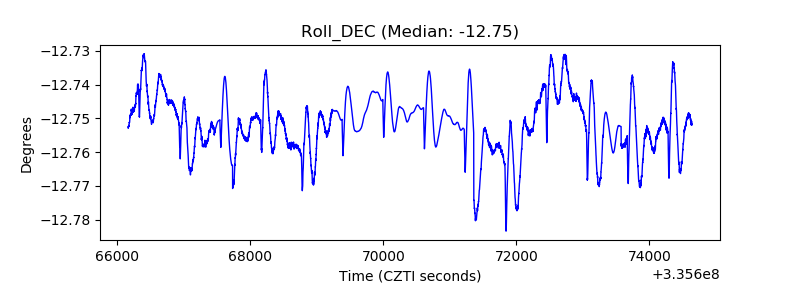 |
| _Roll_RA | 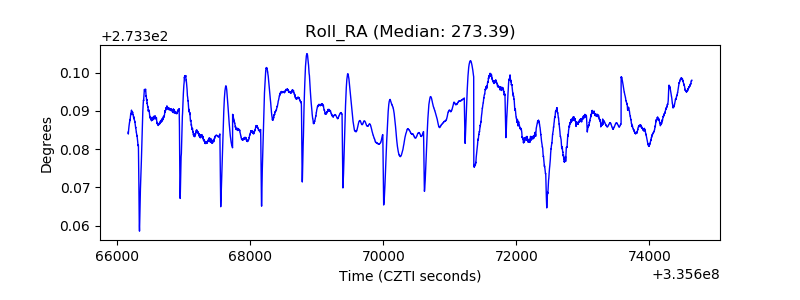 |
| Veto Counter |  |