| Param | Original file | Final file |
|---|---|---|
| Filename | modeM0/AS1A09_104T02_9000003826_26480cztM0_level2.evt | modeM0/AS1A09_104T02_9000003826_26480cztM0_level2_quad_clean.evt |
| Size (bytes) | 655,372,800 | 96,186,240 |
| Size | 625.0 MB | 91.7 MB |
| Events in quadrant A | 3,947,563 | 603,703 |
| Events in quadrant B | 4,081,168 | 614,372 |
| Events in quadrant C | 4,293,287 | 580,497 |
| Events in quadrant D | 6,968,254 | 541,762 |
| Mode M0 | |||
|---|---|---|---|
| Quadrant | BADHDUFLAG | Total packets | Discarded packets |
| A | 0 | 17116 | 0 |
| B | 0 | 17302 | 0 |
| C | 0 | 17950 | 0 |
| D | 0 | 26233 | 0 |
| Mode M9 | |||
|---|---|---|---|
| Quadrant | BADHDUFLAG | Total packets | Discarded packets |
| A | 0 | 6 | 0 |
| B | 0 | 6 | 0 |
| C | 0 | 6 | 0 |
| D | 0 | 6 | 0 |
| Quadrant | Total seconds | Saturated seconds | Saturation percentage |
|---|---|---|---|
| A | 8234 | 97 | 1.178042% |
| B | 8235 | 141 | 1.712204% |
| C | 8235 | 173 | 2.100789% |
| D | 8235 | 729 | 8.852459% |
Noise dominated data is calculated using 1-second bins in cleaned event files. If a bin has >2000 counts, and if more than 50% of those come from <1% of pixels, then it is considered to be noise-dominated and hence unusable.
| Quadrant | # 1 sec bins | Bins with >0 counts | Bins with >2000 counts | High rate bins dominated by noise | Noise dominated (total time) | Noise dominated (detector-on time) | Marked lightcurve |
|---|---|---|---|---|---|---|---|
| A | 8804 | 8235 | 0 | 0 | 0.00% | 0.00% | 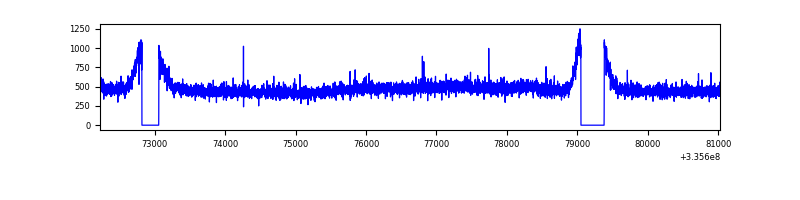 |
| B | 8805 | 8235 | 1 | 1 | 0.01% | 0.01% | 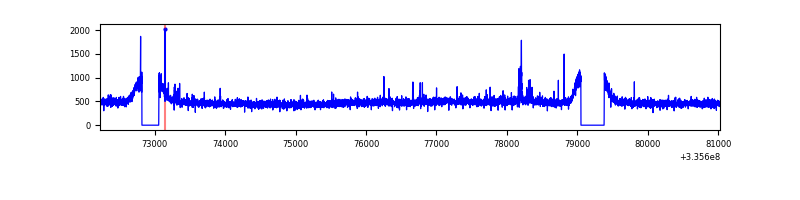 |
| C | 8805 | 8237 | 2 | 2 | 0.02% | 0.02% | 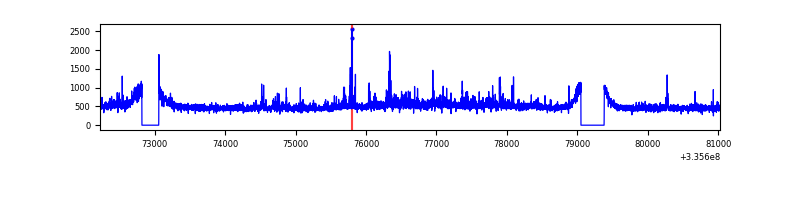 |
| D | 8805 | 8237 | 592 | 592 | 6.72% | 7.19% | 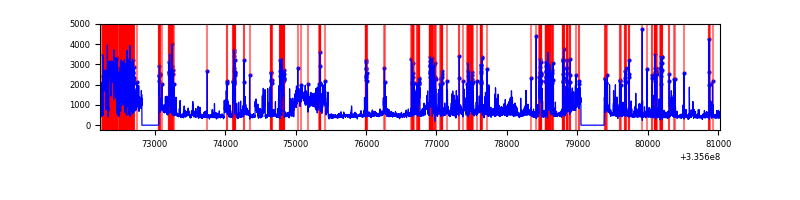 |
Top three noisy pixels from each quadrant. If the there are fewer than three noisy pixels in the level2.evt file, extra rows are filled as -1
| Pixel properties | Quadrant properties | ||||||
|---|---|---|---|---|---|---|---|
| Quadrant | DetID | PixID | Counts | Sigma | Mean | Median | Sigma |
| A | 13 | 254 | 13699 | 61.19 | 1023 | 1001 | 207.5 |
| A | 3 | 137 | 9668 | 41.76 | 1023 | 1001 | 207.5 |
| A | 0 | 226 | 8746 | 37.32 | 1023 | 1001 | 207.5 |
| B | 5 | 172 | 26180 | 127.33 | 1019 | 993 | 197.8 |
| B | 12 | 111 | 24766 | 120.18 | 1019 | 993 | 197.8 |
| B | 11 | 111 | 21738 | 104.87 | 1019 | 993 | 197.8 |
| C | 3 | 233 | 311711 | 1339.69 | 975 | 983 | 231.9 |
| C | 14 | 238 | 152943 | 655.17 | 975 | 983 | 231.9 |
| C | 8 | 128 | 12828 | 51.07 | 975 | 983 | 231.9 |
| D | 7 | 80 | 2173233 | 9456.36 | 953 | 931 | 229.7 |
| D | 1 | 52 | 845513 | 3676.59 | 953 | 931 | 229.7 |
| D | 11 | 176 | 190941 | 827.14 | 953 | 931 | 229.7 |
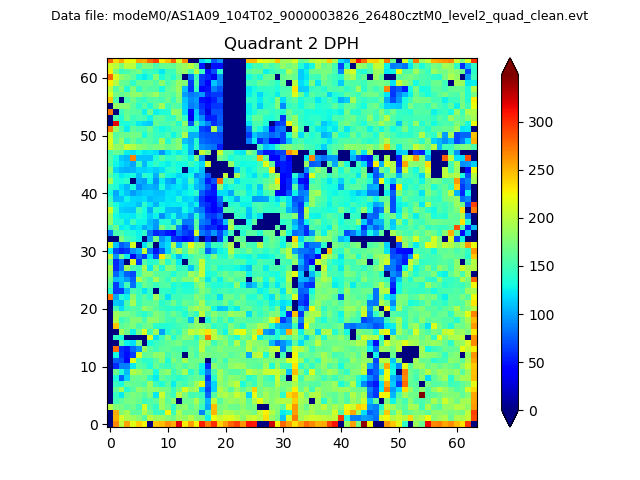
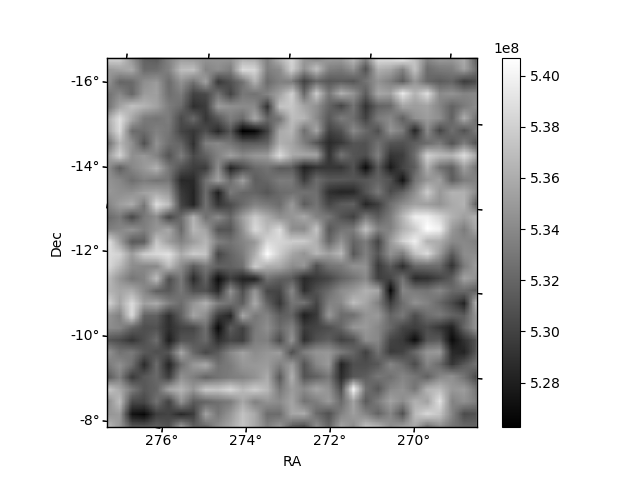
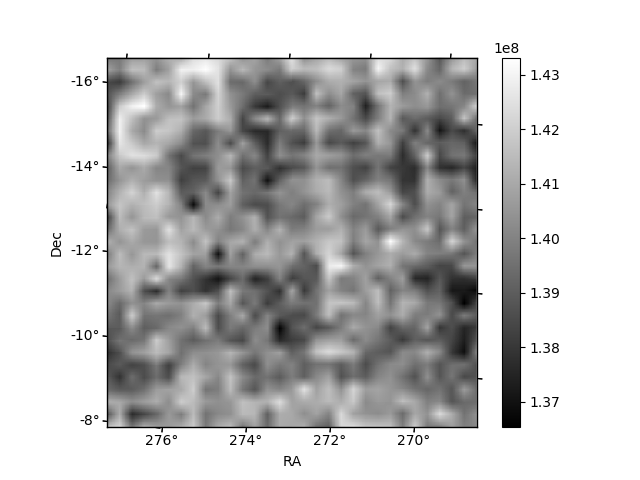
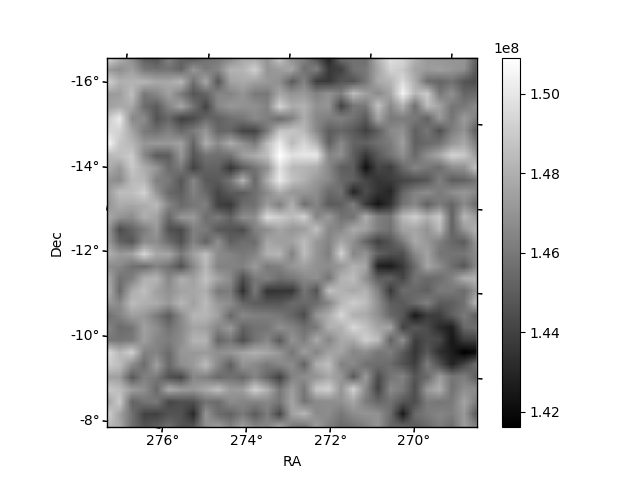
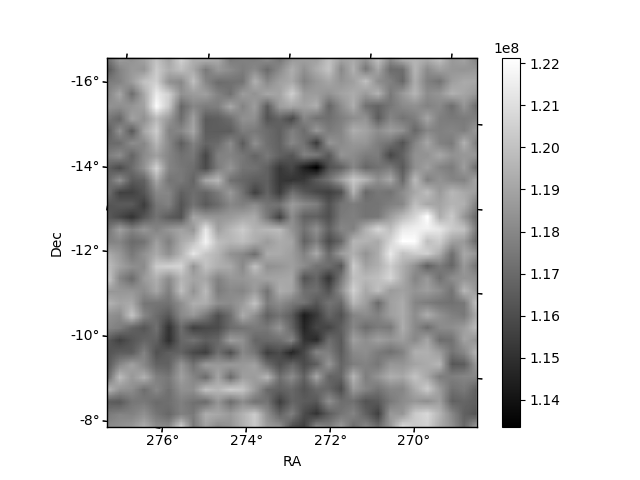
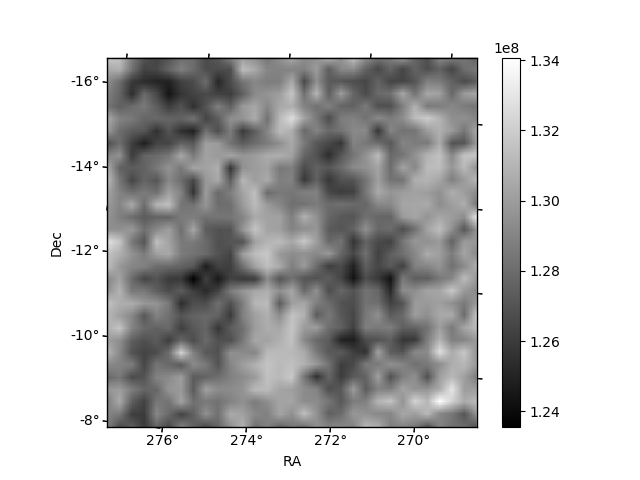
Histogram calculated using DETX and DETY for each event in the final _common_clean file
| Quadrant A | 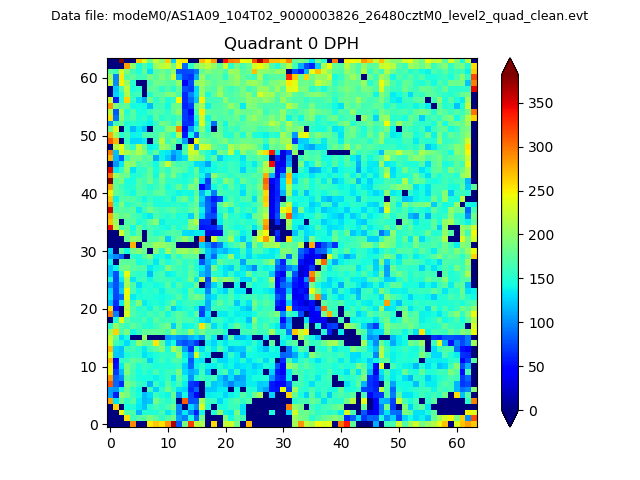 |
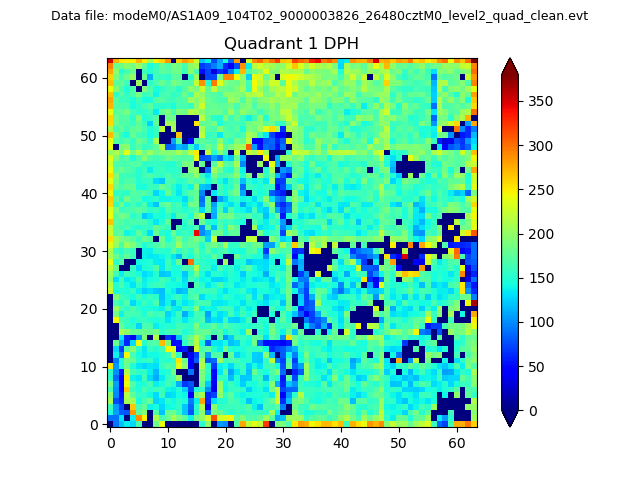 |
Quadrant B |
|---|---|---|---|
| Quadrant D | 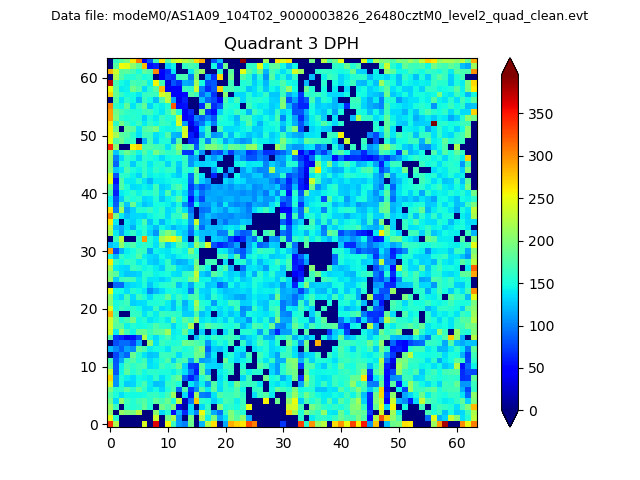 |
 |
Quadrant C |
| Plot type | Count rate plots | Images |
|---|---|---|
| Comparison with Poisson distribution Blue bars denote a histogram of data divided into 1 sec bins. Red curve is a Poisson curve with rate = median count rate of data. |
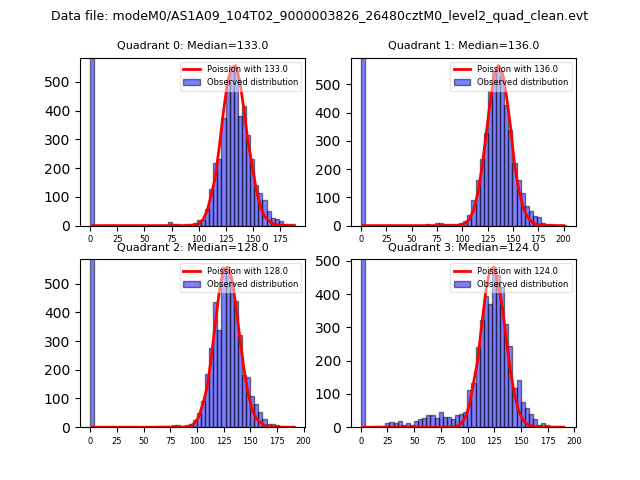 |
 |
| Quadrant-wise count rates Data is divided into 100 sec bins |
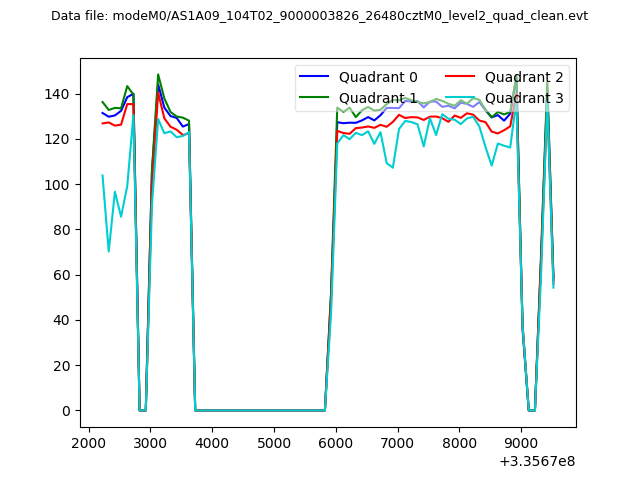 |
|
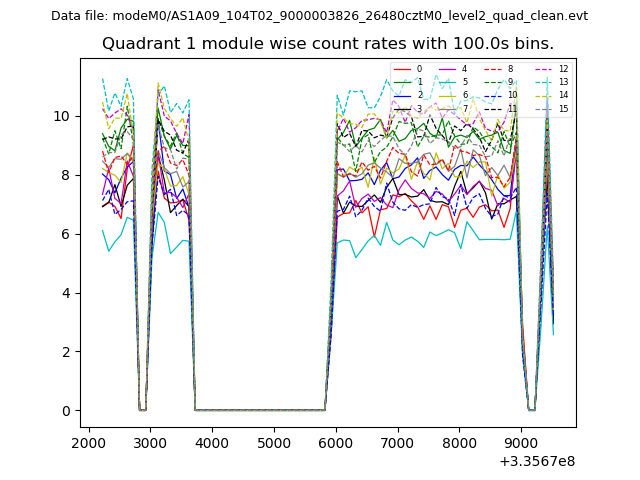
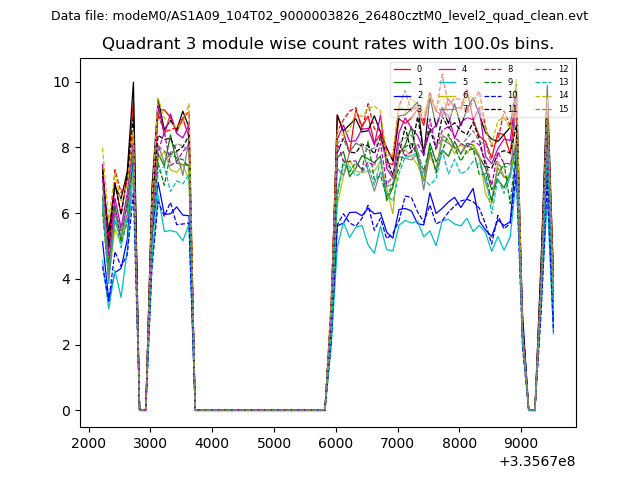
| Module-wise count rates for Quadrant A Data is divided into 100 sec bins |
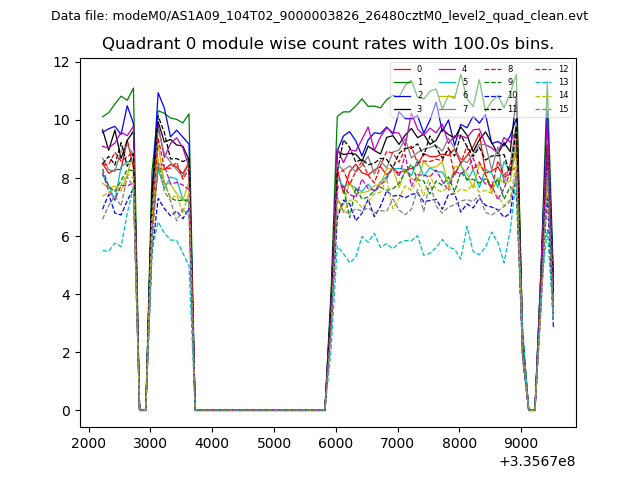 |
 |
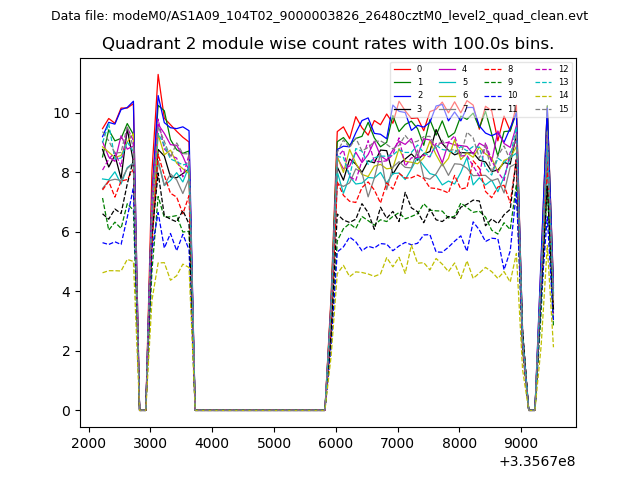
| Module-wise count rates for Quadrant B Data is divided into 100 sec bins |
 |
 |
| Module-wise count rates for Quadrant C Data is divided into 100 sec bins |
 |
 |
| Module-wise count rates for Quadrant D Data is divided into 100 sec bins |
 |
 |
| Parameter | Plot |
|---|---|
| CZT HV Monitor | 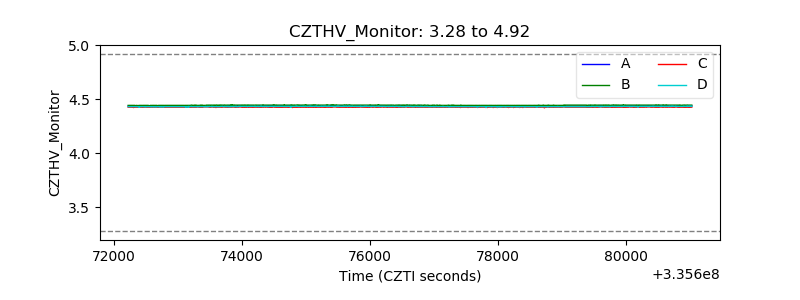 |
| D_VDD | 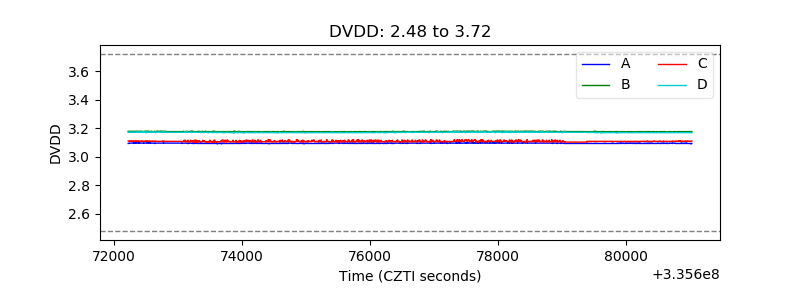 |
| Temperature 1 | 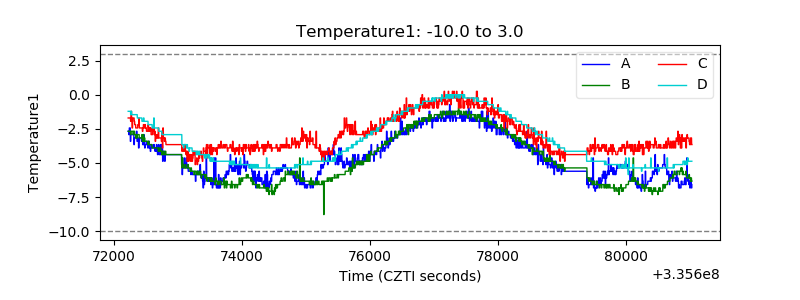 |
| Veto HV Monitor | 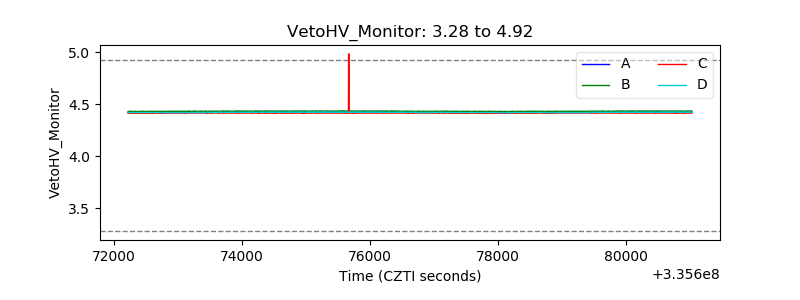 |
| Veto LLD | 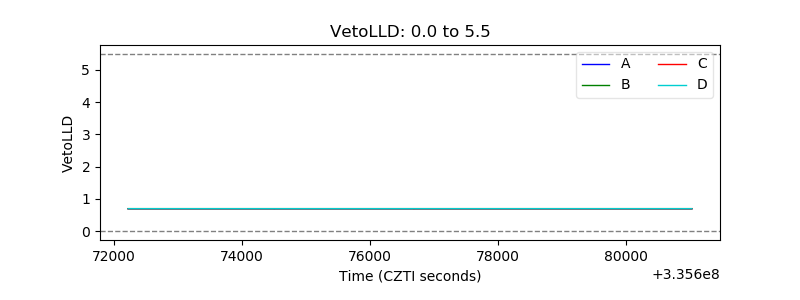 |
| Alpha Counter | 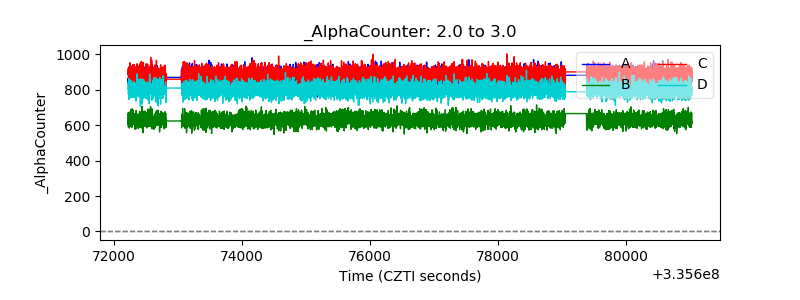 |
| _CPM_Rate | 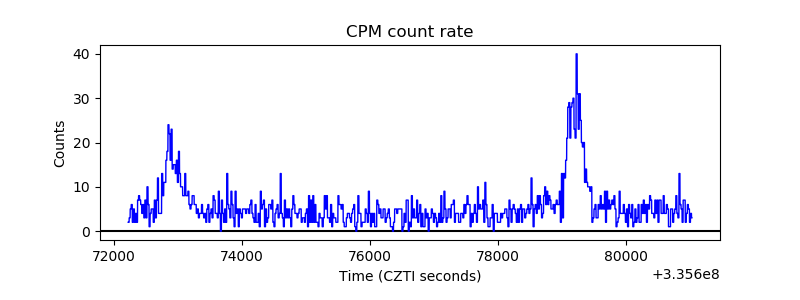 |
| CZT Counter | 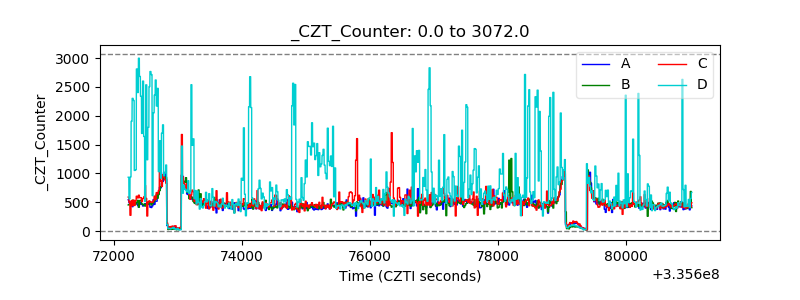 |
| +2.5 Volts monitor |  |
| +5 Volts monitor |  |
| _ROLL_ROT | 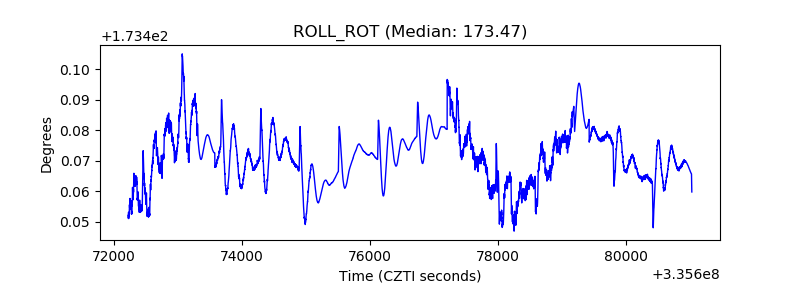 |
| _Roll_DEC | 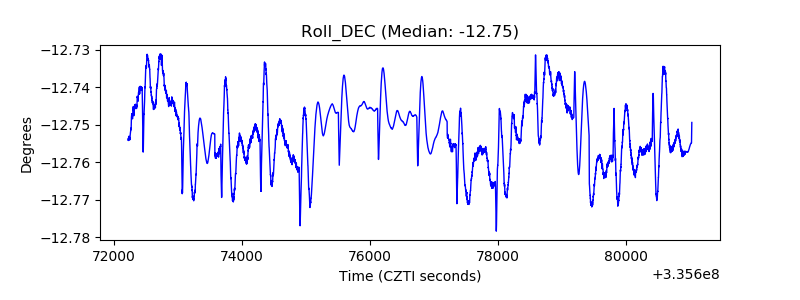 |
| _Roll_RA | 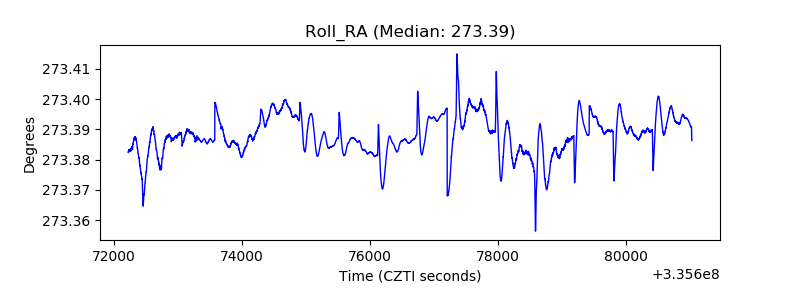 |
| Veto Counter | 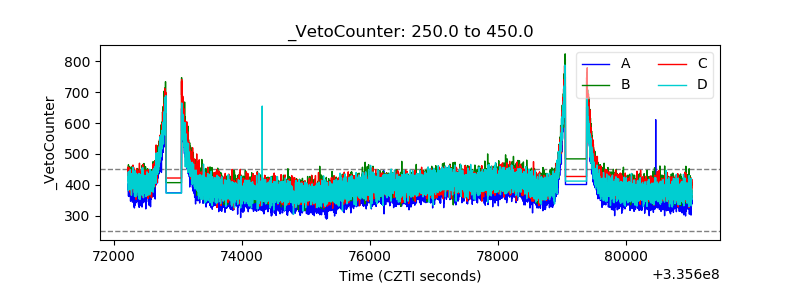 |