| Param | Original file | Final file |
|---|---|---|
| Filename | modeM0/AS1A09_104T02_9000003826_26483cztM0_level2.evt | modeM0/AS1A09_104T02_9000003826_26483cztM0_level2_quad_clean.evt |
| Size (bytes) | 324,308,160 | 39,473,280 |
| Size | 309.3 MB | 37.6 MB |
| Events in quadrant A | 1,874,991 | 240,891 |
| Events in quadrant B | 1,938,504 | 244,992 |
| Events in quadrant C | 1,953,560 | 231,511 |
| Events in quadrant D | 3,772,810 | 186,057 |
| Mode M0 | |||
|---|---|---|---|
| Quadrant | BADHDUFLAG | Total packets | Discarded packets |
| A | 0 | 8266 | 0 |
| B | 0 | 8348 | 0 |
| C | 0 | 8382 | 0 |
| D | 0 | 14015 | 0 |
| Quadrant | Total seconds | Saturated seconds | Saturation percentage |
|---|---|---|---|
| A | 4123 | 2 | 0.048508% |
| B | 4124 | 4 | 0.096993% |
| C | 4124 | 12 | 0.290980% |
| D | 4124 | 601 | 14.573230% |
Noise dominated data is calculated using 1-second bins in cleaned event files. If a bin has >2000 counts, and if more than 50% of those come from <1% of pixels, then it is considered to be noise-dominated and hence unusable.
| Quadrant | # 1 sec bins | Bins with >0 counts | Bins with >2000 counts | High rate bins dominated by noise | Noise dominated (total time) | Noise dominated (detector-on time) | Marked lightcurve |
|---|---|---|---|---|---|---|---|
| A | 4123 | 4123 | 0 | 0 | 0.00% | 0.00% |  |
| B | 4124 | 4124 | 2 | 2 | 0.05% | 0.05% |  |
| C | 4124 | 4124 | 1 | 1 | 0.02% | 0.02% |  |
| D | 4124 | 4124 | 518 | 518 | 12.56% | 12.56% |  |
Top three noisy pixels from each quadrant. If the there are fewer than three noisy pixels in the level2.evt file, extra rows are filled as -1
| Pixel properties | Quadrant properties | ||||||
|---|---|---|---|---|---|---|---|
| Quadrant | DetID | PixID | Counts | Sigma | Mean | Median | Sigma |
| A | 13 | 254 | 6587 | 61.53 | 485 | 476 | 99.3 |
| A | 3 | 137 | 4691 | 42.44 | 485 | 476 | 99.3 |
| A | 0 | 226 | 4145 | 36.94 | 485 | 476 | 99.3 |
| B | 3 | 112 | 16609 | 171.01 | 482 | 469 | 94.4 |
| B | 0 | 190 | 12985 | 132.61 | 482 | 469 | 94.4 |
| B | 12 | 111 | 11387 | 115.68 | 482 | 469 | 94.4 |
| C | 14 | 238 | 74091 | 673.82 | 462 | 465 | 109.3 |
| C | 3 | 233 | 67756 | 615.84 | 462 | 465 | 109.3 |
| C | 0 | 207 | 4876 | 40.37 | 462 | 465 | 109.3 |
| D | 7 | 80 | 1718585 | 16502.29 | 430 | 419 | 104.1 |
| D | 1 | 52 | 280098 | 2686.2 | 430 | 419 | 104.1 |
| D | 11 | 176 | 122233 | 1169.97 | 430 | 419 | 104.1 |
Histogram calculated using DETX and DETY for each event in the final _common_clean file
| Quadrant A | 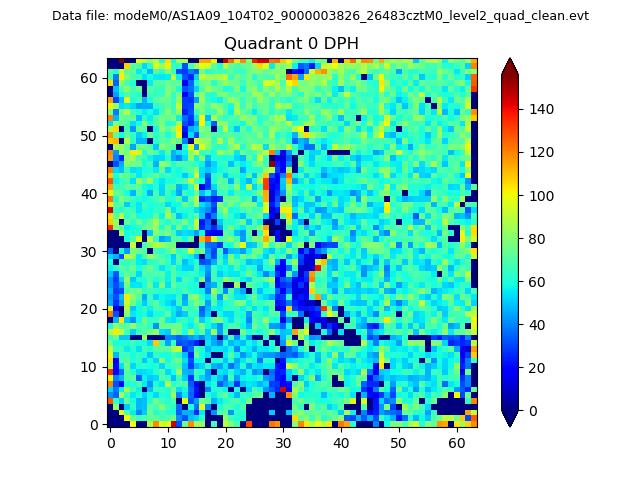 |
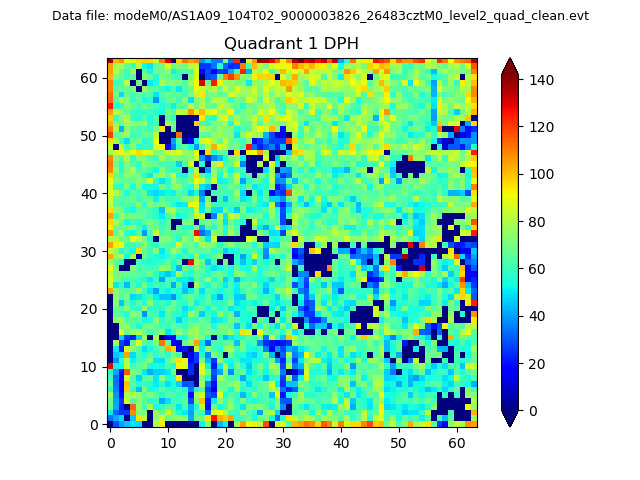 |
Quadrant B |
|---|---|---|---|
| Quadrant D | 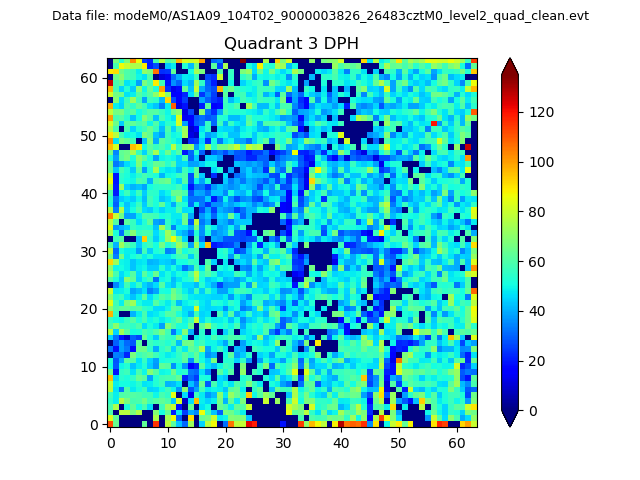 |
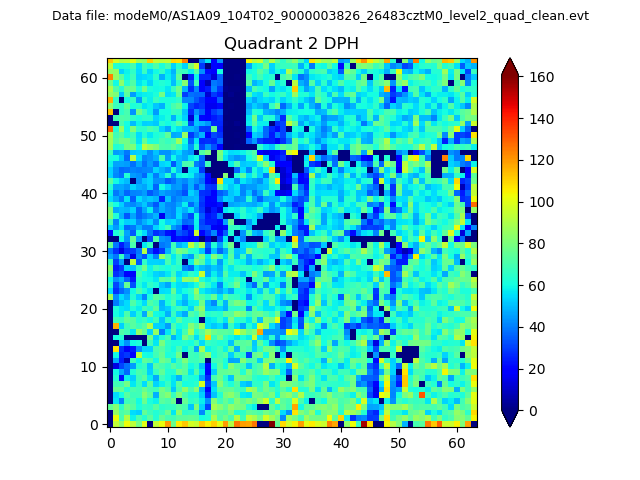 |
Quadrant C |
| Plot type | Count rate plots | Images |
|---|---|---|
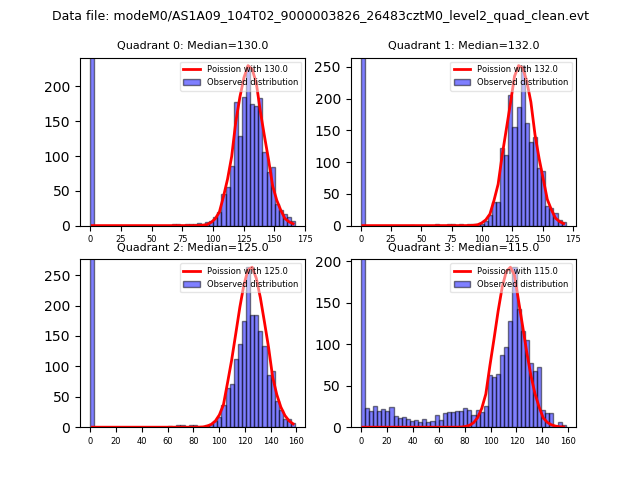
| Comparison with Poisson distribution Blue bars denote a histogram of data divided into 1 sec bins. Red curve is a Poisson curve with rate = median count rate of data. |
 |
 |
| Quadrant-wise count rates Data is divided into 100 sec bins |
 |
|
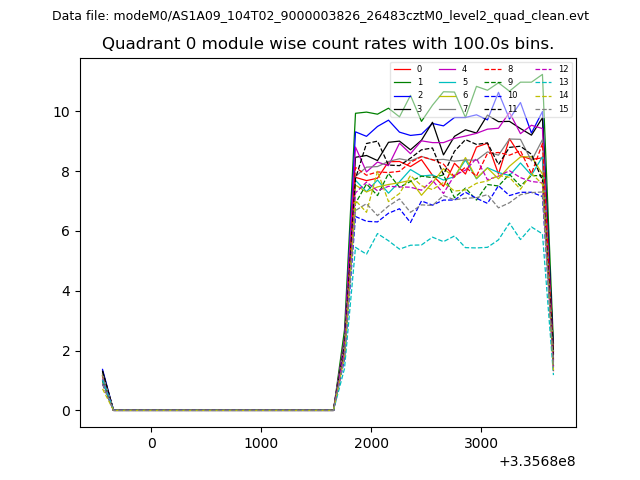
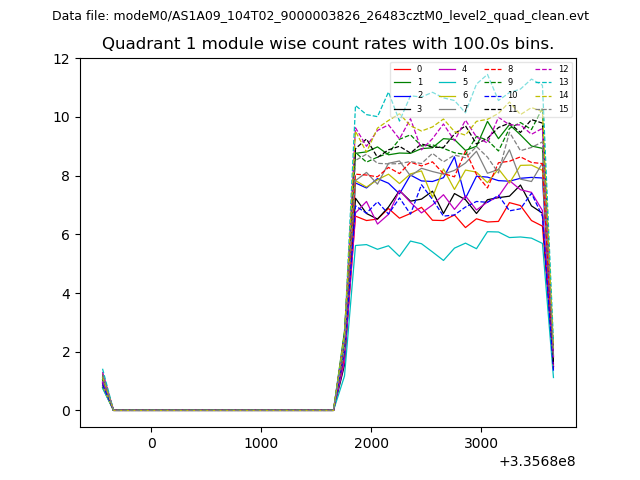
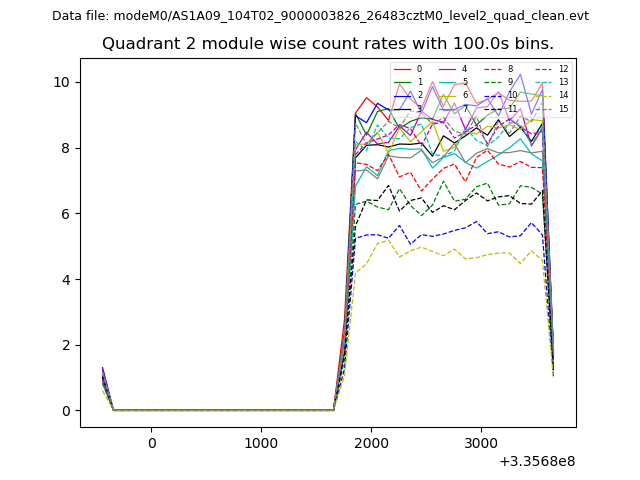
| Module-wise count rates for Quadrant A Data is divided into 100 sec bins |
 |
 |
| Module-wise count rates for Quadrant B Data is divided into 100 sec bins |
 |
 |
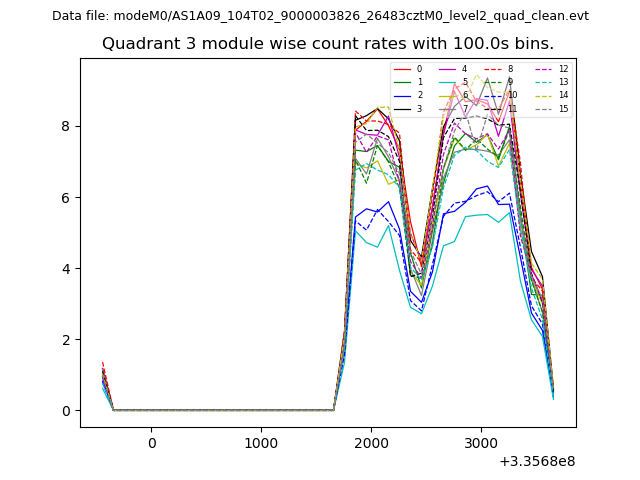
| Module-wise count rates for Quadrant C Data is divided into 100 sec bins |
 |
 |
| Module-wise count rates for Quadrant D Data is divided into 100 sec bins |
 |
 |
| Parameter | Plot |
|---|---|
| CZT HV Monitor | 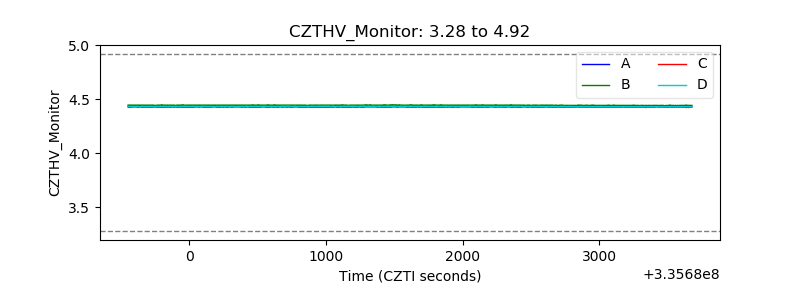 |
| D_VDD | 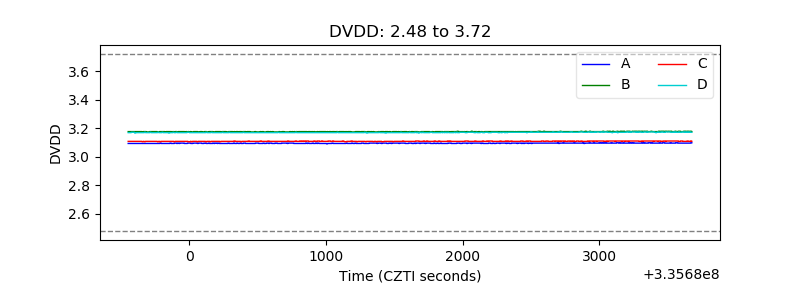 |
| Temperature 1 | 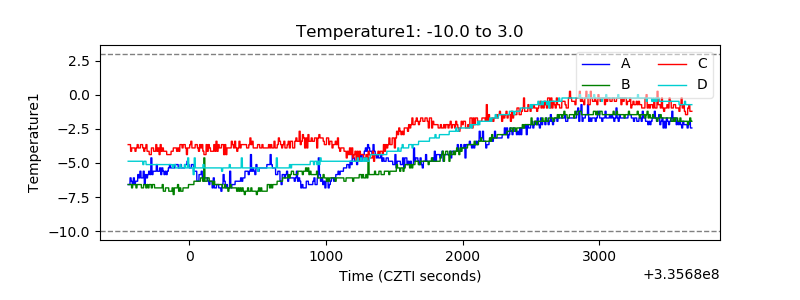 |
| Veto HV Monitor | 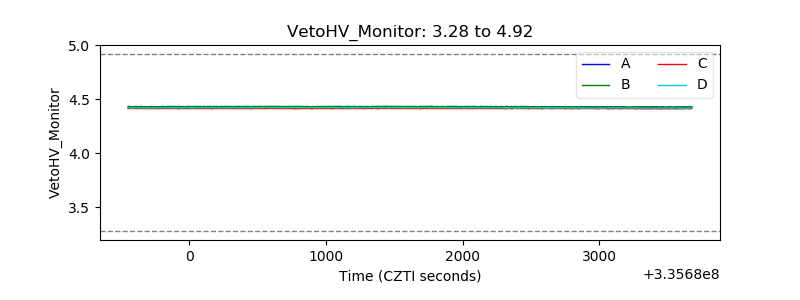 |
| Veto LLD | 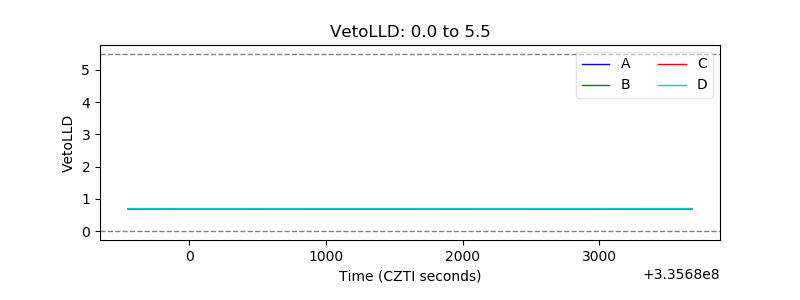 |
| Alpha Counter | 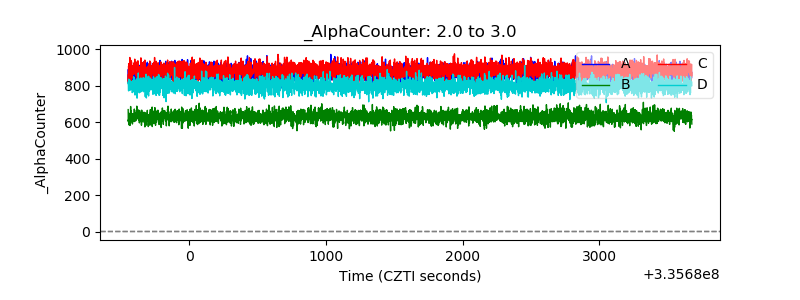 |
| _CPM_Rate | 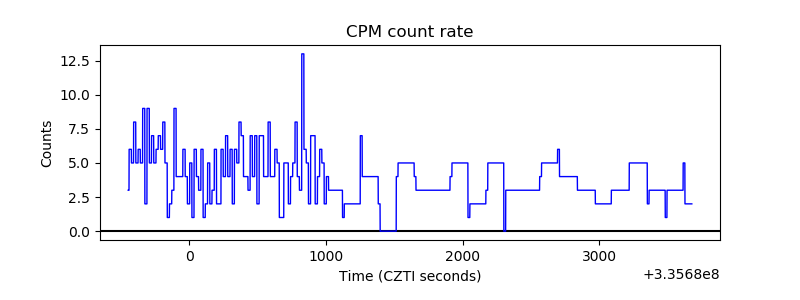 |
| CZT Counter | 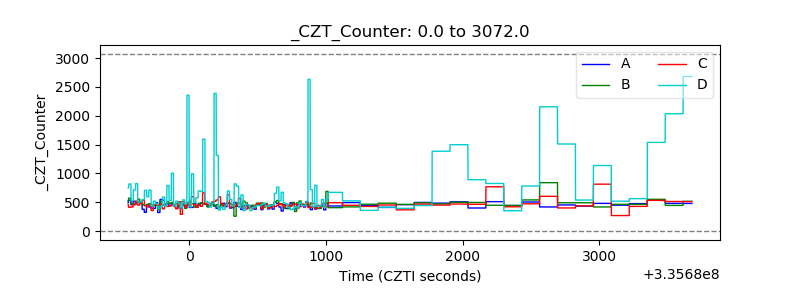 |
| +2.5 Volts monitor |  |
| +5 Volts monitor |  |
| _ROLL_ROT | 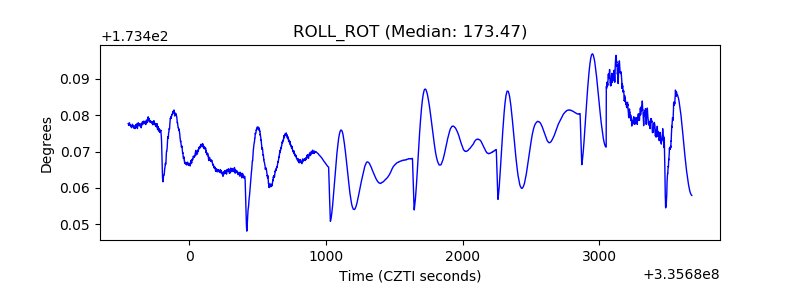 |
| _Roll_DEC | 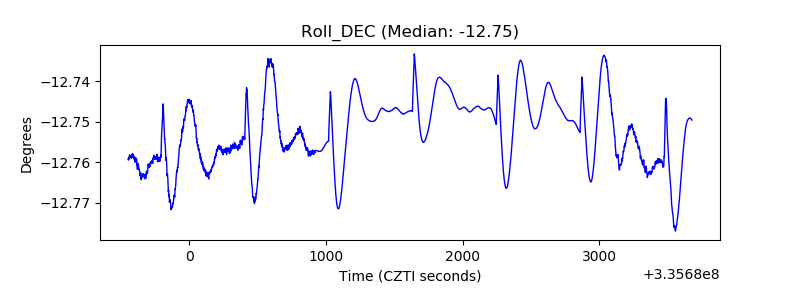 |
| _Roll_RA | 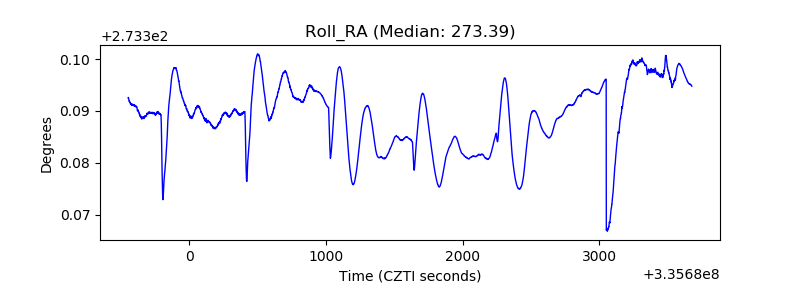 |
| Veto Counter | 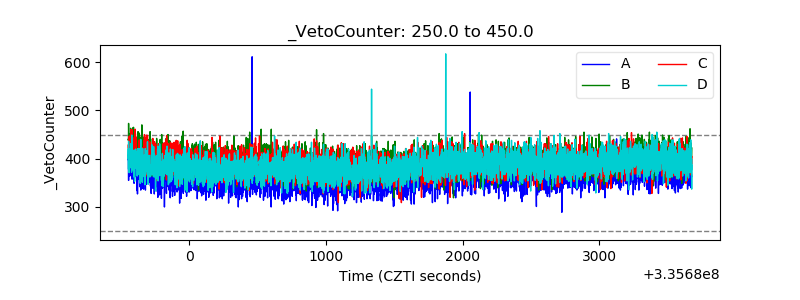 |