| Param | Original file | Final file |
|---|---|---|
| Filename | modeM0/AS1A09_104T02_9000003826_26642cztM0_level2.evt | modeM0/AS1A09_104T02_9000003826_26642cztM0_level2_quad_clean.evt |
| Size (bytes) | 583,945,920 | 107,352,000 |
| Size | 556.9 MB | 102.4 MB |
| Events in quadrant A | 3,746,555 | 708,998 |
| Events in quadrant B | 4,241,620 | 696,823 |
| Events in quadrant C | 3,792,221 | 689,181 |
| Events in quadrant D | 5,360,306 | 599,540 |
| Mode M0 | |||
|---|---|---|---|
| Quadrant | BADHDUFLAG | Total packets | Discarded packets |
| A | 0 | 16298 | 0 |
| B | 0 | 17570 | 0 |
| C | 0 | 16326 | 0 |
| D | 0 | 20878 | 0 |
| Mode M9 | |||
|---|---|---|---|
| Quadrant | BADHDUFLAG | Total packets | Discarded packets |
| A | 0 | 18 | 14 |
| B | 0 | 18 | 13 |
| C | 0 | 16 | 11 |
| D | 0 | 19 | 15 |
| Quadrant | Total seconds | Saturated seconds | Saturation percentage |
|---|---|---|---|
| A | 7883 | 29 | 0.367880% |
| B | 7765 | 29 | 0.373471% |
| C | 7920 | 60 | 0.757576% |
| D | 7261 | 537 | 7.395676% |
Noise dominated data is calculated using 1-second bins in cleaned event files. If a bin has >2000 counts, and if more than 50% of those come from <1% of pixels, then it is considered to be noise-dominated and hence unusable.
| Quadrant | # 1 sec bins | Bins with >0 counts | Bins with >2000 counts | High rate bins dominated by noise | Noise dominated (total time) | Noise dominated (detector-on time) | Marked lightcurve |
|---|---|---|---|---|---|---|---|
| A | 14106 | 9099 | 2 | 2 | 0.01% | 0.02% | 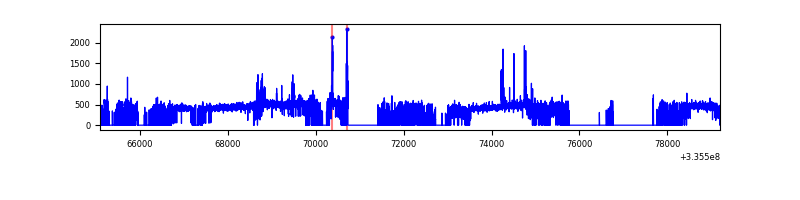 |
| B | 14102 | 8904 | 0 | 0 | 0.00% | 0.00% | 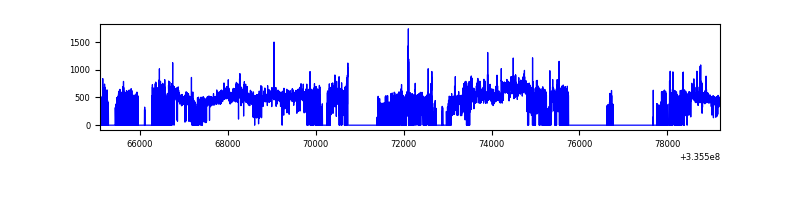 |
| C | 14104 | 9067 | 8 | 8 | 0.06% | 0.09% | 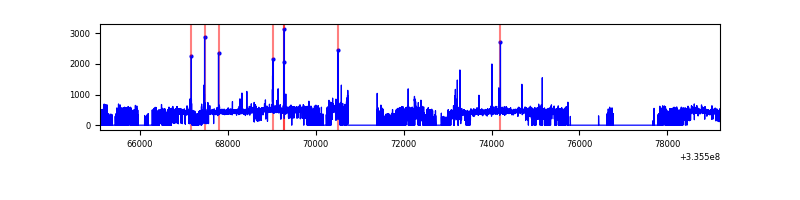 |
| D | 14069 | 8309 | 341 | 341 | 2.42% | 4.10% | 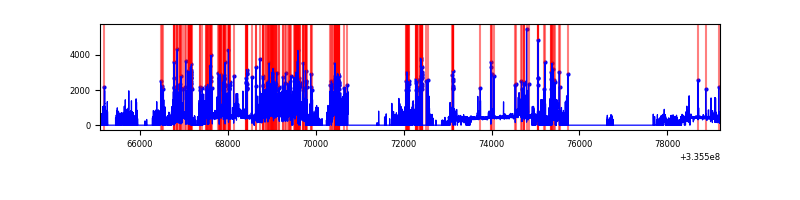 |
Top three noisy pixels from each quadrant. If the there are fewer than three noisy pixels in the level2.evt file, extra rows are filled as -1
| Pixel properties | Quadrant properties | ||||||
|---|---|---|---|---|---|---|---|
| Quadrant | DetID | PixID | Counts | Sigma | Mean | Median | Sigma |
| A | 0 | 13 | 145562 | 766.37 | 933 | 917 | 188.7 |
| A | 13 | 254 | 12526 | 61.51 | 933 | 917 | 188.7 |
| A | 3 | 137 | 8378 | 39.53 | 933 | 917 | 188.7 |
| B | 0 | 189 | 489066 | 2797.42 | 913 | 894 | 174.5 |
| B | 3 | 112 | 154463 | 880.01 | 913 | 894 | 174.5 |
| B | 12 | 111 | 20298 | 111.19 | 913 | 894 | 174.5 |
| C | 14 | 238 | 145561 | 683.69 | 897 | 903 | 211.6 |
| C | 3 | 233 | 58014 | 269.92 | 897 | 903 | 211.6 |
| C | 15 | 208 | 48951 | 227.08 | 897 | 903 | 211.6 |
| D | 1 | 52 | 1668364 | 8443.52 | 798 | 782 | 197.5 |
| D | 7 | 80 | 458703 | 2318.6 | 798 | 782 | 197.5 |
| D | 12 | 233 | 103157 | 518.36 | 798 | 782 | 197.5 |
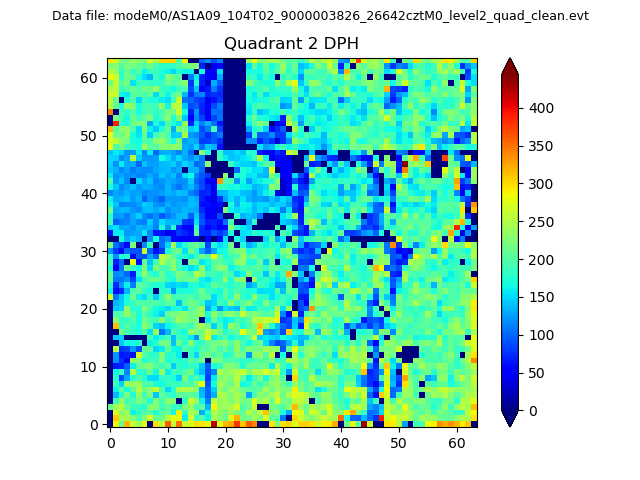
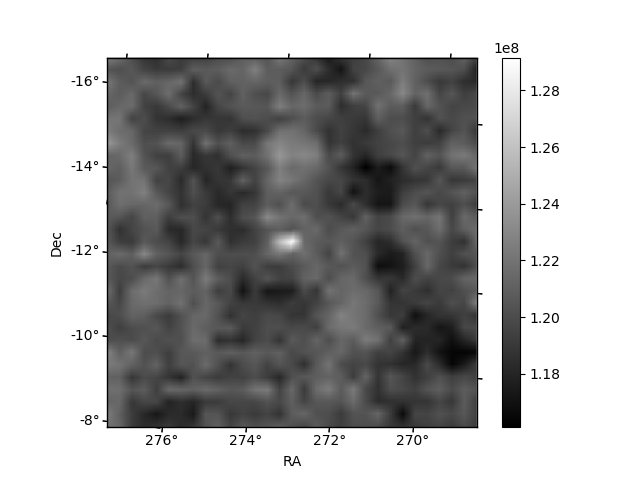
Histogram calculated using DETX and DETY for each event in the final _common_clean file
| Quadrant A | 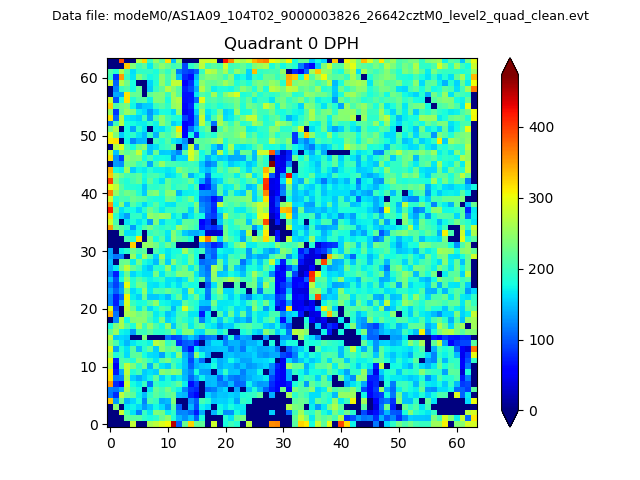 |
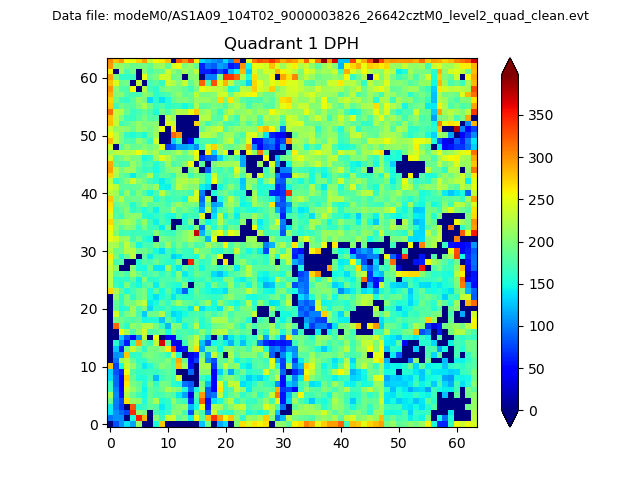 |
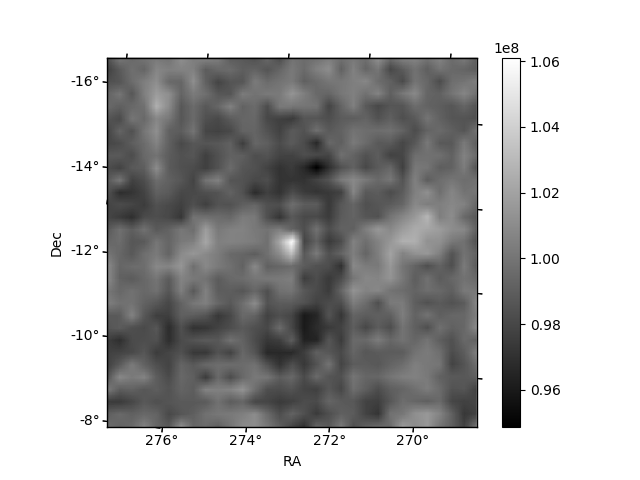
Quadrant B |
|---|---|---|---|
| Quadrant D | 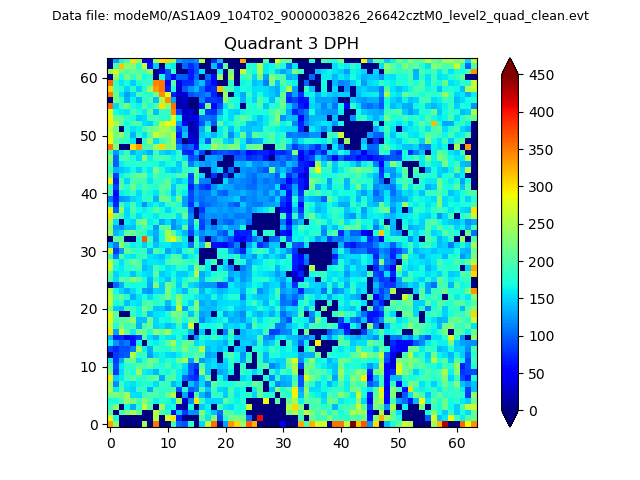 |
 |
Quadrant C |
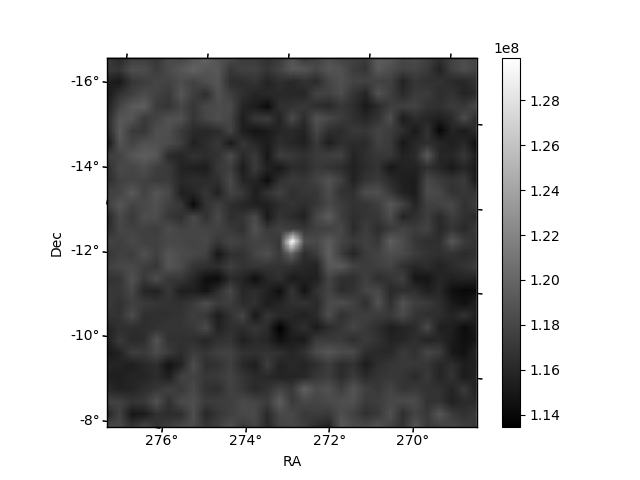
| Plot type | Count rate plots | Images |
|---|---|---|
| Comparison with Poisson distribution Blue bars denote a histogram of data divided into 1 sec bins. Red curve is a Poisson curve with rate = median count rate of data. |
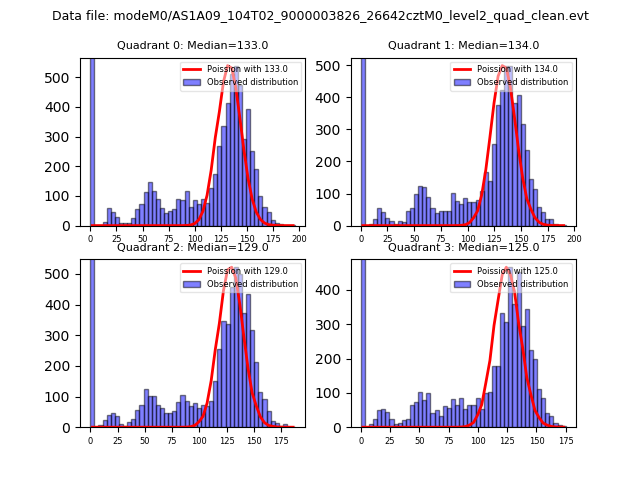 |
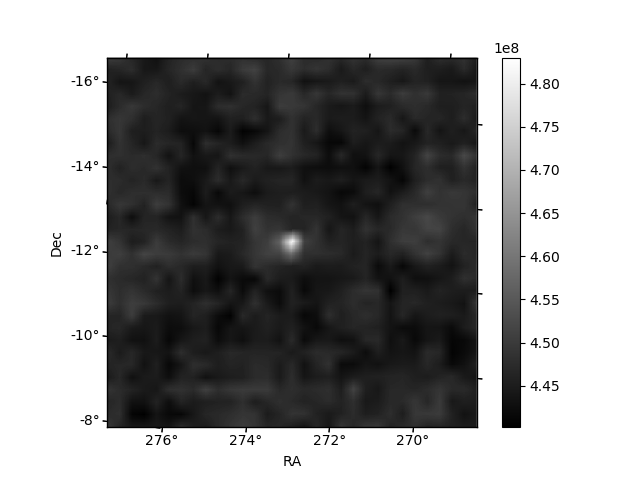 |
| Quadrant-wise count rates Data is divided into 100 sec bins |
 |
|
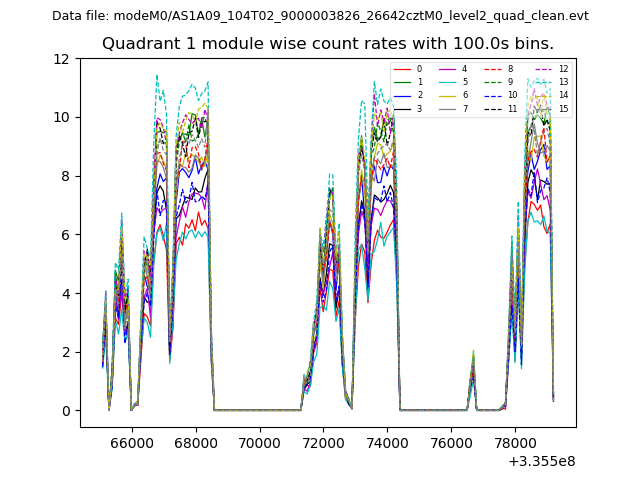
| Module-wise count rates for Quadrant A Data is divided into 100 sec bins |
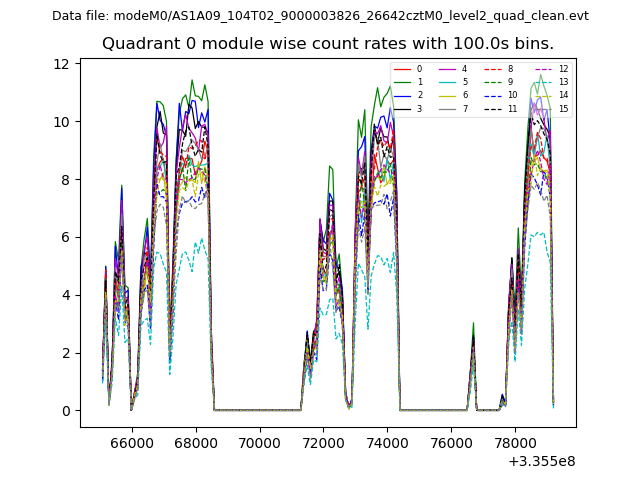 |
 |
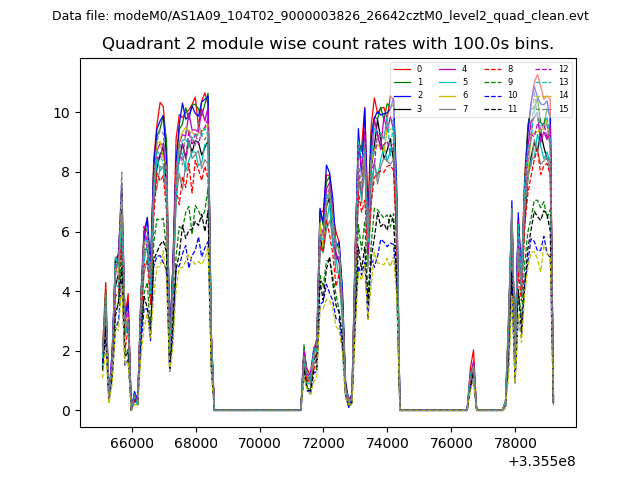
| Module-wise count rates for Quadrant B Data is divided into 100 sec bins |
 |
 |
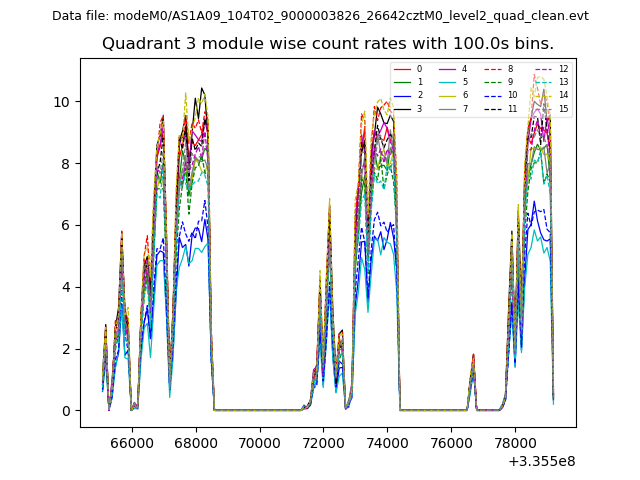
| Module-wise count rates for Quadrant C Data is divided into 100 sec bins |
 |
 |
| Module-wise count rates for Quadrant D Data is divided into 100 sec bins |
 |
 |
| Parameter | Plot |
|---|---|
| CZT HV Monitor |  |
| D_VDD | 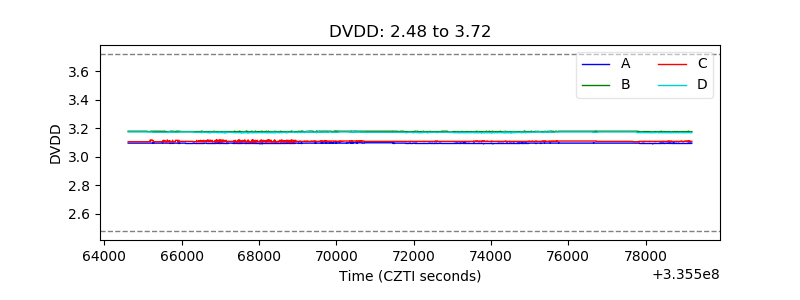 |
| Temperature 1 | 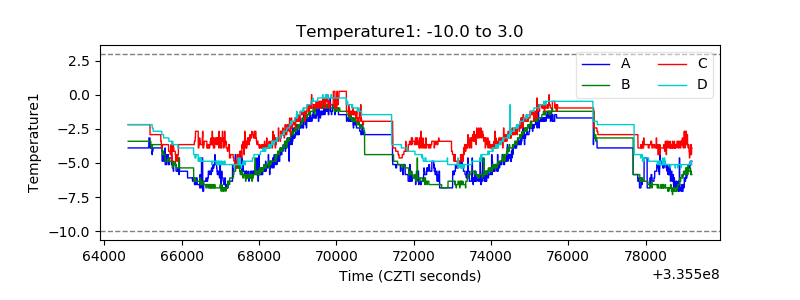 |
| Veto HV Monitor | 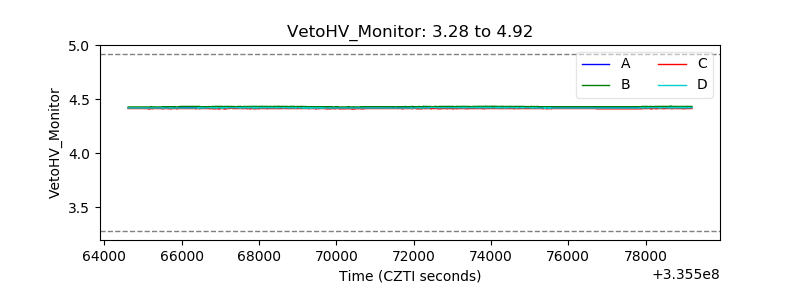 |
| Veto LLD | 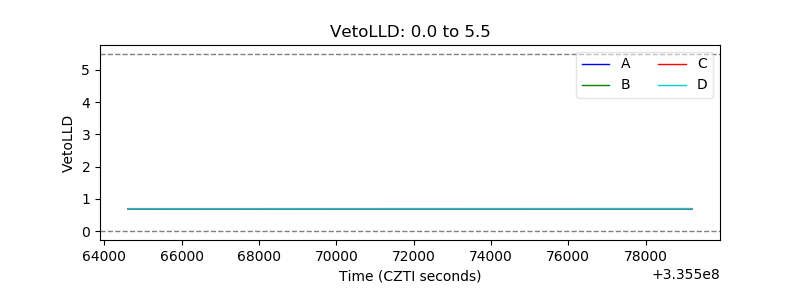 |
| Alpha Counter | 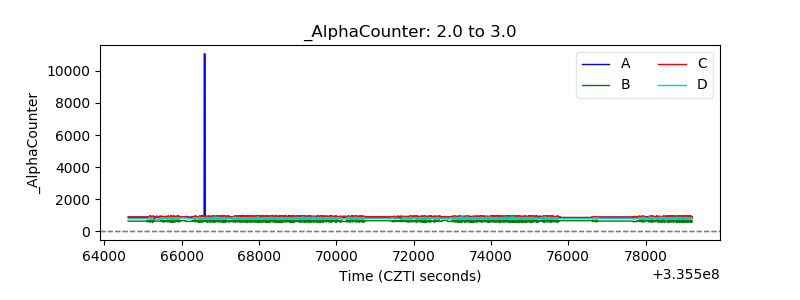 |
| _CPM_Rate | 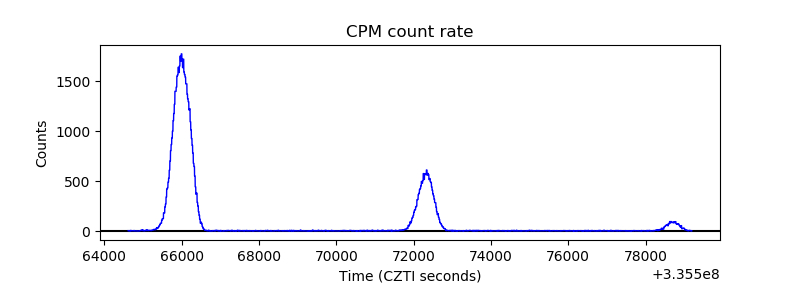 |
| CZT Counter | 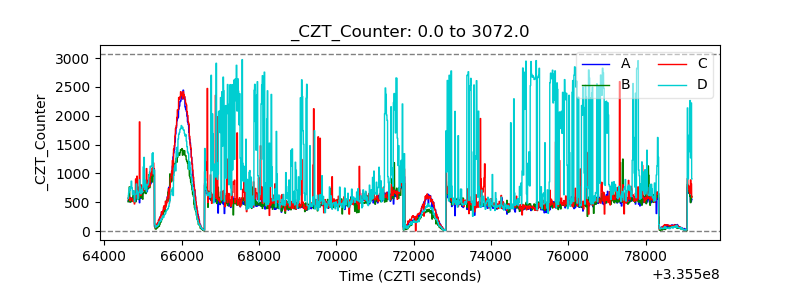 |
| +2.5 Volts monitor | 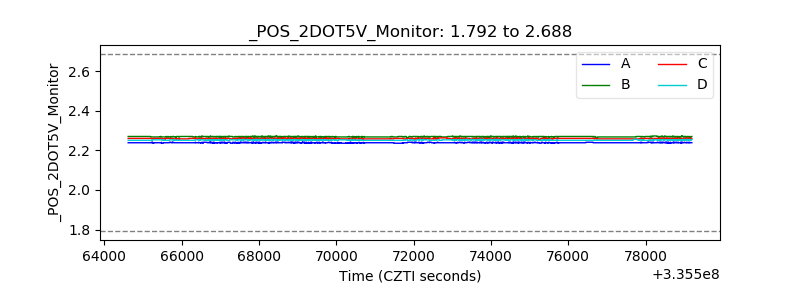 |
| +5 Volts monitor |  |
| _ROLL_ROT | 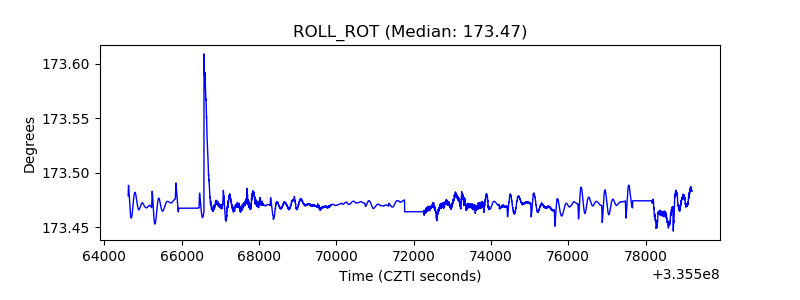 |
| _Roll_DEC | 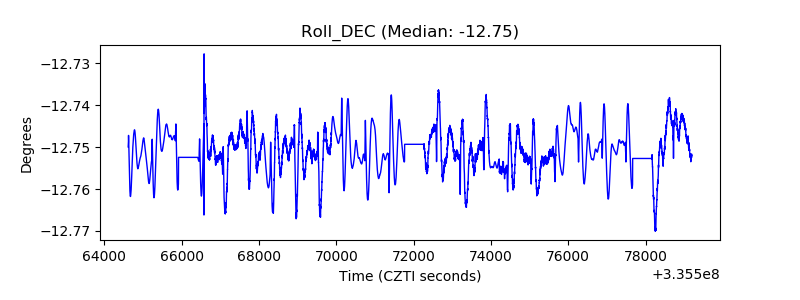 |
| _Roll_RA | 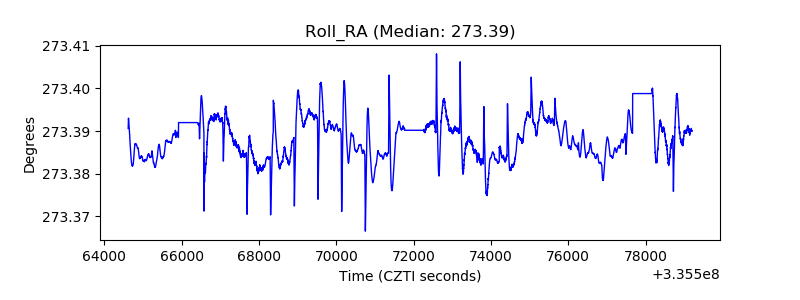 |
| Veto Counter | 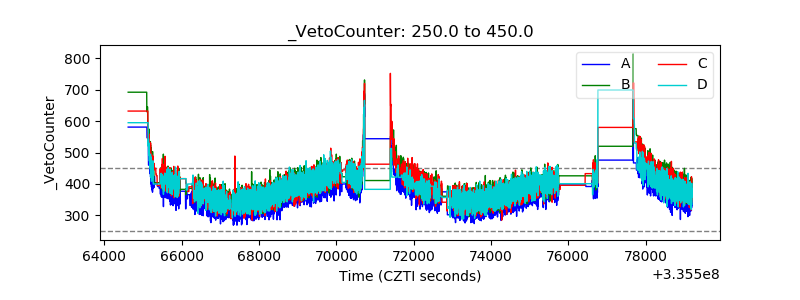 |