| Param | Original file | Final file |
|---|---|---|
| Filename | modeM0/AS1A07_146T01_9000003828cztM0_level2.fits | modeM0/AS1A07_146T01_9000003828cztM0_level2_quad_clean.evt |
| Size (bytes) | 240,140,160 | 177,410,880 |
| Size | 229.0 MB | 169.2 MB |
| Events in quadrant A | 1,498,870 | 979,884 |
| Events in quadrant B | 1,423,414 | 988,727 |
| Events in quadrant C | 1,446,598 | 922,330 |
| Events in quadrant D | 1,244,962 | 821,814 |
| Mode M0 | |||
|---|---|---|---|
| Quadrant | BADHDUFLAG | Total packets | Discarded packets |
| A | 0 | 49938 | 0 |
| B | 0 | 50333 | 0 |
| C | 0 | 51351 | 0 |
| D | 0 | 65404 | 0 |
| Mode SS | |||
|---|---|---|---|
| Quadrant | BADHDUFLAG | Total packets | Discarded packets |
| A | 0 | 492 | 0 |
| B | 0 | 492 | 0 |
| C | 0 | 492 | 0 |
| D | 0 | 492 | 0 |
| Mode M9 | |||
|---|---|---|---|
| Quadrant | BADHDUFLAG | Total packets | Discarded packets |
| A | 0 | 42 | 0 |
| B | 0 | 42 | 0 |
| C | 0 | 42 | 0 |
| D | 0 | 42 | 0 |
| Quadrant | Total seconds | Saturated seconds | Saturation percentage |
|---|---|---|---|
| A | 24109 | 235 | 0.974740% |
| B | 24109 | 265 | 1.099175% |
| C | 24109 | 316 | 1.310714% |
| D | 24109 | 1334 | 5.533203% |
Noise dominated data is calculated using 1-second bins in cleaned event files. If a bin has >2000 counts, and if more than 50% of those come from <1% of pixels, then it is considered to be noise-dominated and hence unusable.
| Quadrant | # 1 sec bins | Bins with >0 counts | Bins with >2000 counts | High rate bins dominated by noise | Noise dominated (total time) | Noise dominated (detector-on time) | Marked lightcurve |
|---|---|---|---|---|---|---|---|
| A | 28299 | 24105 | 0 | 0 | 0.00% | 0.00% |  |
| B | 28299 | 24107 | 0 | 0 | 0.00% | 0.00% |  |
| C | 28299 | 24105 | 0 | 0 | 0.00% | 0.00% |  |
| D | 28299 | 24098 | 0 | 0 | 0.00% | 0.00% |  |
Top three noisy pixels from each quadrant. If the there are fewer than three noisy pixels in the level2.evt file, extra rows are filled as -1
| Pixel properties | Quadrant properties | ||||||
|---|---|---|---|---|---|---|---|
| Quadrant | DetID | PixID | Counts | Sigma | Mean | Median | Sigma |
| A | 0 | 29 | 1243 | 9.11 | 390 | 368 | 96.0 |
| A | 7 | 110 | 1210 | 8.77 | 390 | 368 | 96.0 |
| A | 0 | 30 | 1107 | 7.7 | 390 | 368 | 96.0 |
| B | 2 | 9 | 1158 | 10.7 | 376 | 359 | 74.7 |
| B | 2 | 8 | 998 | 8.56 | 376 | 359 | 74.7 |
| B | 5 | 128 | 984 | 8.37 | 376 | 359 | 74.7 |
| C | 1 | 80 | 1108 | 7.68 | 382 | 357 | 97.7 |
| C | 1 | 81 | 1107 | 7.67 | 382 | 357 | 97.7 |
| C | 12 | 241 | 1048 | 7.07 | 382 | 357 | 97.7 |
| D | 7 | 3 | 904 | 6.11 | 356 | 325 | 94.8 |
| D | 3 | 14 | 904 | 6.11 | 356 | 325 | 94.8 |
| D | 3 | 159 | 896 | 6.02 | 356 | 325 | 94.8 |
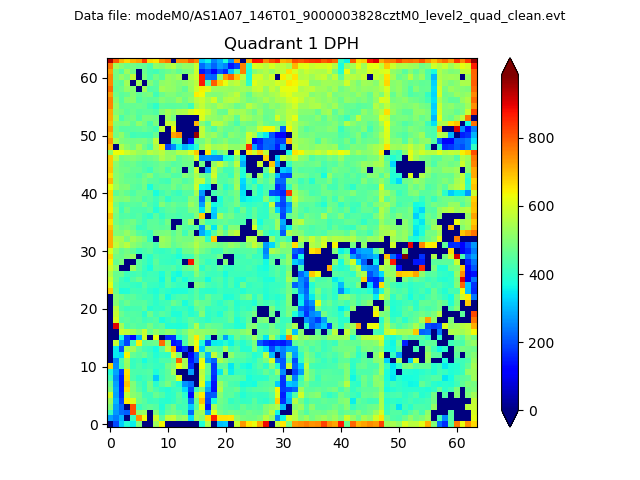
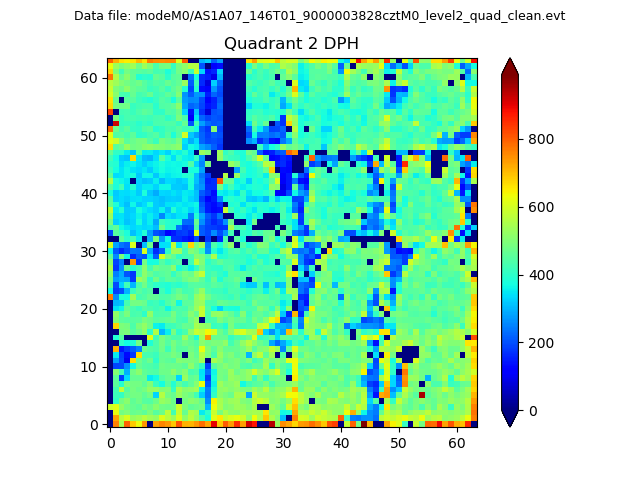
Histogram calculated using DETX and DETY for each event in the final _common_clean file
| Quadrant A |  |
 |
Quadrant B |
|---|---|---|---|
| Quadrant D |  |
 |
Quadrant C |
| Plot type | Count rate plots | Images |
|---|---|---|
| Comparison with Poisson distribution Blue bars denote a histogram of data divided into 1 sec bins. Red curve is a Poisson curve with rate = median count rate of data. |
 |
 |
| Quadrant-wise count rates Data is divided into 100 sec bins |
 |
|
| Module-wise count rates for Quadrant A Data is divided into 100 sec bins |
 |
 |
| Module-wise count rates for Quadrant B Data is divided into 100 sec bins |
 |
 |
| Module-wise count rates for Quadrant C Data is divided into 100 sec bins |
 |
 |
| Module-wise count rates for Quadrant D Data is divided into 100 sec bins |
 |
 |
| Parameter | Plot |
|---|---|
| CZT HV Monitor |  |
| D_VDD |  |
| Temperature 1 |  |
| Veto HV Monitor |  |
| Veto LLD |  |
| Alpha Counter |  |
| _CPM_Rate |  |
| CZT Counter |  |
| +2.5 Volts monitor |  |
| +5 Volts monitor |  |
| _ROLL_ROT |  |
| _Roll_DEC |  |
| _Roll_RA |  |
| Veto Counter |  |