| Param | Original file | Final file |
|---|---|---|
| Filename | modeM0/AS1A07_146T01_9000003828_26483cztM0_level2.evt | modeM0/AS1A07_146T01_9000003828_26483cztM0_level2_quad_clean.evt |
| Size (bytes) | 912,769,920 | 160,680,960 |
| Size | 870.5 MB | 153.2 MB |
| Events in quadrant A | 6,020,793 | 1,013,050 |
| Events in quadrant B | 6,146,032 | 1,035,772 |
| Events in quadrant C | 6,446,294 | 981,857 |
| Events in quadrant D | 8,168,088 | 954,942 |
| Mode M0 | |||
|---|---|---|---|
| Quadrant | BADHDUFLAG | Total packets | Discarded packets |
| A | 0 | 25868 | 0 |
| B | 0 | 26049 | 0 |
| C | 0 | 26673 | 0 |
| D | 0 | 32711 | 0 |
| Mode M9 | |||
|---|---|---|---|
| Quadrant | BADHDUFLAG | Total packets | Discarded packets |
| A | 0 | 20 | 0 |
| B | 0 | 20 | 0 |
| C | 0 | 20 | 0 |
| D | 0 | 20 | 0 |
| Quadrant | Total seconds | Saturated seconds | Saturation percentage |
|---|---|---|---|
| A | 12735 | 118 | 0.926580% |
| B | 12735 | 116 | 0.910876% |
| C | 12735 | 149 | 1.170004% |
| D | 12735 | 506 | 3.973302% |
Noise dominated data is calculated using 1-second bins in cleaned event files. If a bin has >2000 counts, and if more than 50% of those come from <1% of pixels, then it is considered to be noise-dominated and hence unusable.
| Quadrant | # 1 sec bins | Bins with >0 counts | Bins with >2000 counts | High rate bins dominated by noise | Noise dominated (total time) | Noise dominated (detector-on time) | Marked lightcurve |
|---|---|---|---|---|---|---|---|
| A | 14760 | 12736 | 0 | 0 | 0.00% | 0.00% | 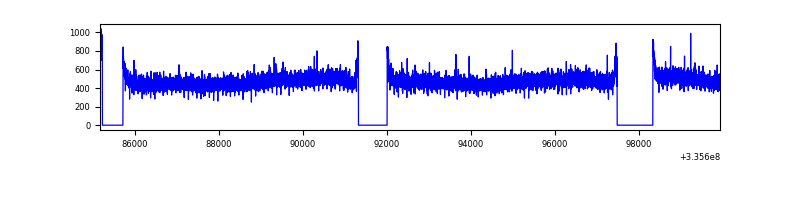 |
| B | 14760 | 12737 | 2 | 2 | 0.01% | 0.02% | 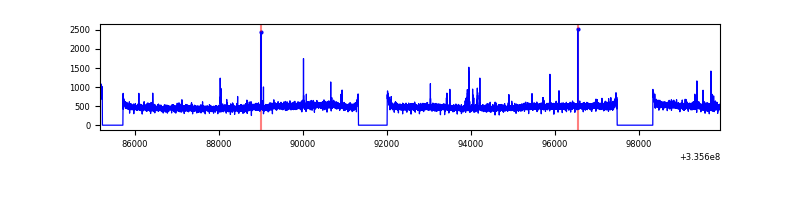 |
| C | 14760 | 12736 | 2 | 2 | 0.01% | 0.02% | 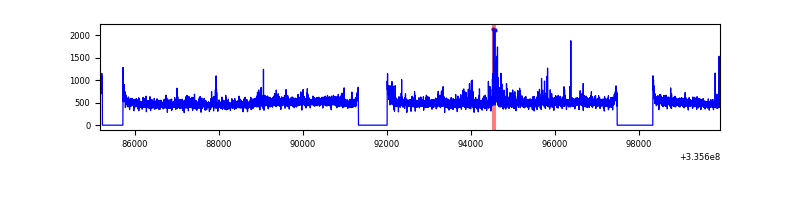 |
| D | 14760 | 12737 | 379 | 379 | 2.57% | 2.98% | 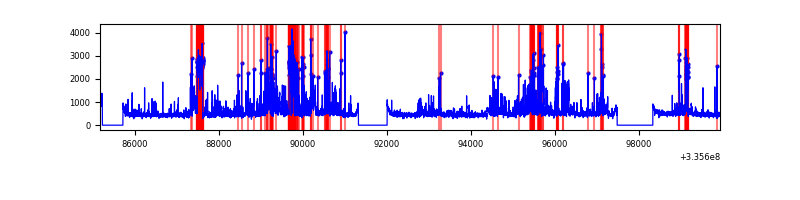 |
Top three noisy pixels from each quadrant. If the there are fewer than three noisy pixels in the level2.evt file, extra rows are filled as -1
| Pixel properties | Quadrant properties | ||||||
|---|---|---|---|---|---|---|---|
| Quadrant | DetID | PixID | Counts | Sigma | Mean | Median | Sigma |
| A | 13 | 254 | 19463 | 57.08 | 1560 | 1525 | 314.3 |
| A | 3 | 137 | 14708 | 41.95 | 1560 | 1525 | 314.3 |
| A | 0 | 226 | 13234 | 37.26 | 1560 | 1525 | 314.3 |
| B | 12 | 111 | 36941 | 119.84 | 1545 | 1506 | 295.7 |
| B | 0 | 190 | 34373 | 111.15 | 1545 | 1506 | 295.7 |
| B | 11 | 111 | 33205 | 107.2 | 1545 | 1506 | 295.7 |
| C | 3 | 233 | 316217 | 902.92 | 1492 | 1504 | 348.5 |
| C | 14 | 238 | 236670 | 674.7 | 1492 | 1504 | 348.5 |
| C | 14 | 176 | 53128 | 148.11 | 1492 | 1504 | 348.5 |
| D | 7 | 80 | 1240129 | 3462.87 | 1493 | 1455 | 357.7 |
| D | 1 | 52 | 925614 | 2583.61 | 1493 | 1455 | 357.7 |
| D | 12 | 233 | 261530 | 727.07 | 1493 | 1455 | 357.7 |
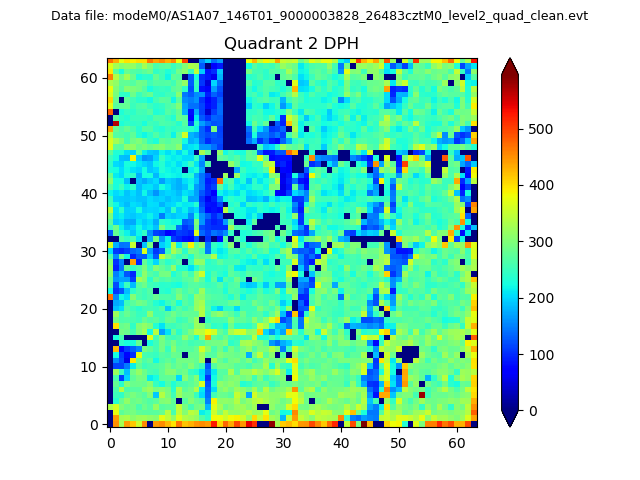
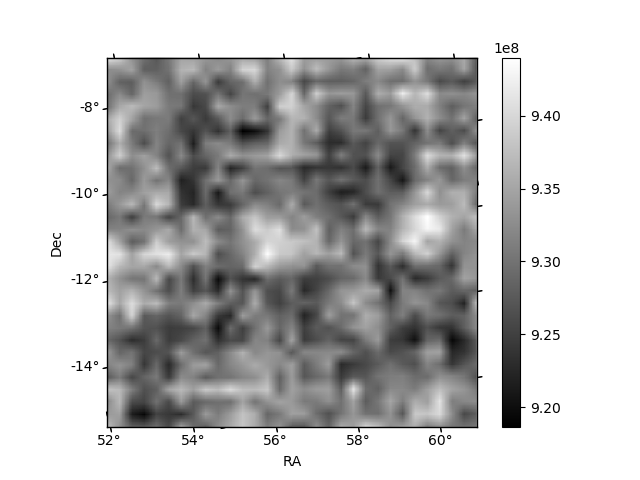
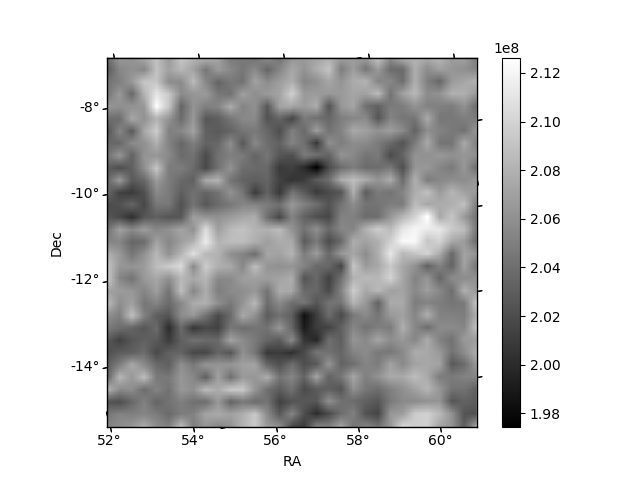
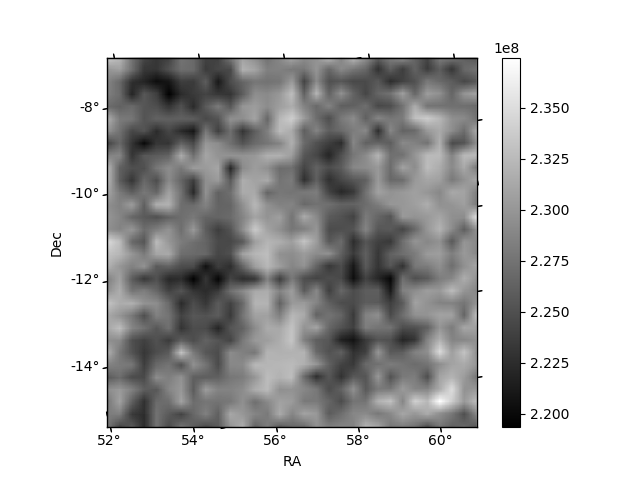
Histogram calculated using DETX and DETY for each event in the final _common_clean file
| Quadrant A | 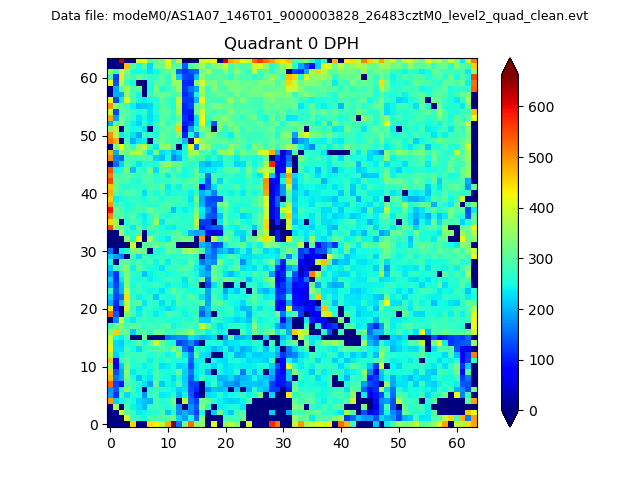 |
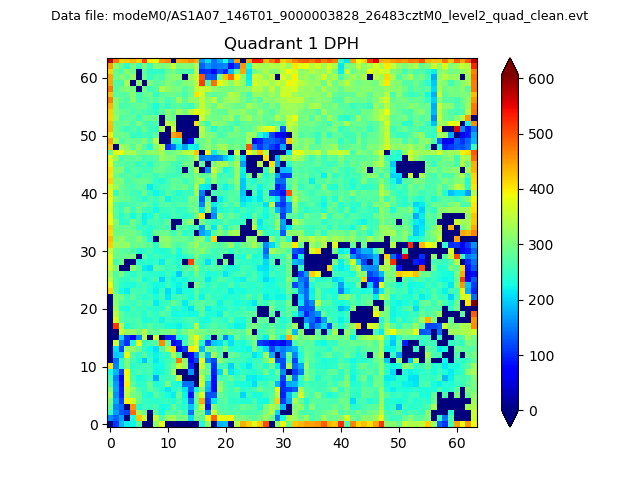 |
Quadrant B |
|---|---|---|---|
| Quadrant D | 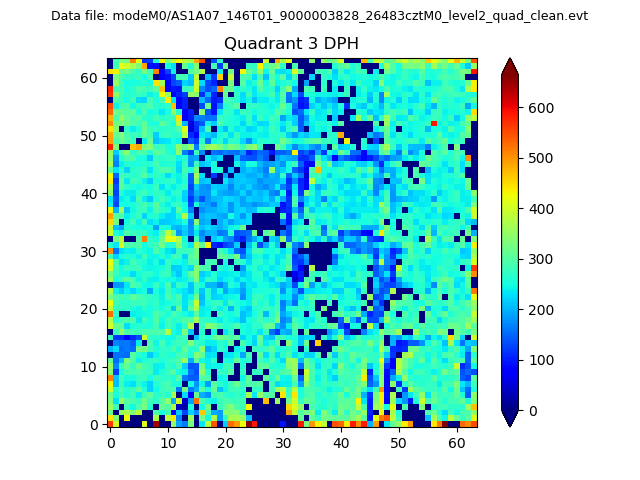 |
 |
Quadrant C |
| Plot type | Count rate plots | Images |
|---|---|---|
| Comparison with Poisson distribution Blue bars denote a histogram of data divided into 1 sec bins. Red curve is a Poisson curve with rate = median count rate of data. |
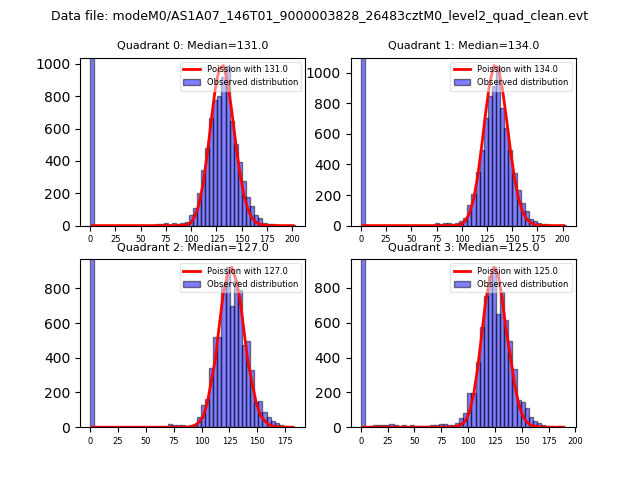 |
 |
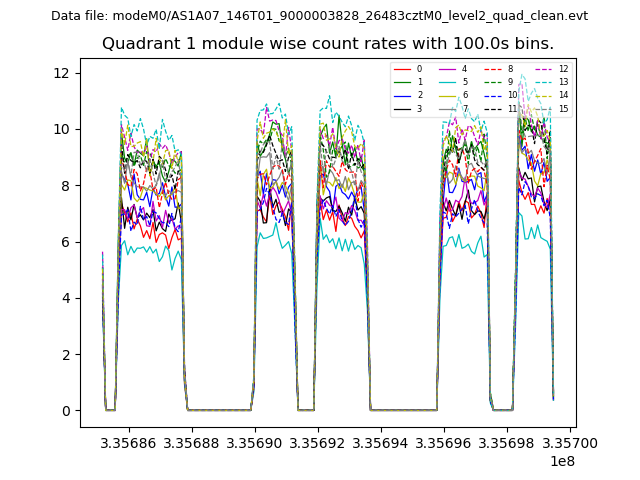
| Quadrant-wise count rates Data is divided into 100 sec bins |
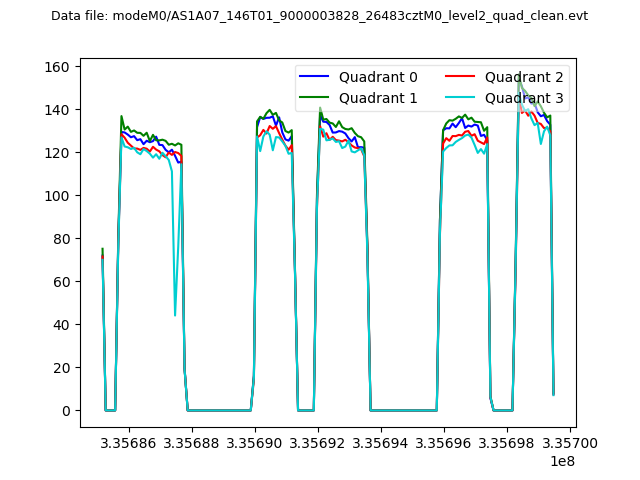 |
|
| Module-wise count rates for Quadrant A Data is divided into 100 sec bins |
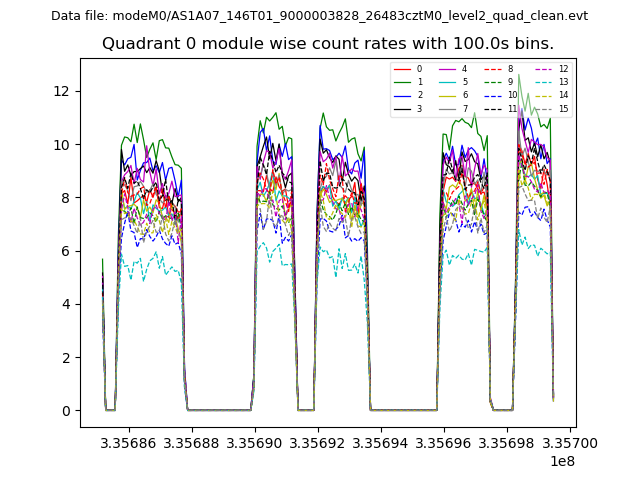 |
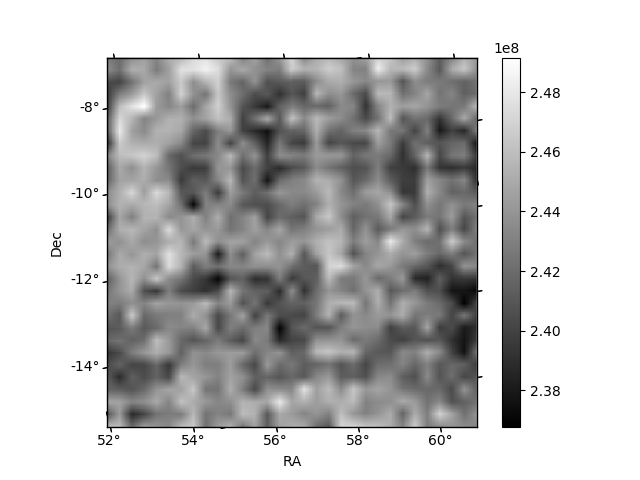 |
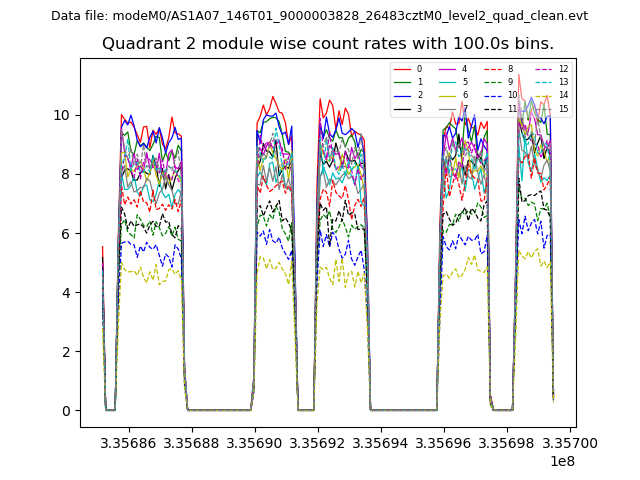
| Module-wise count rates for Quadrant B Data is divided into 100 sec bins |
 |
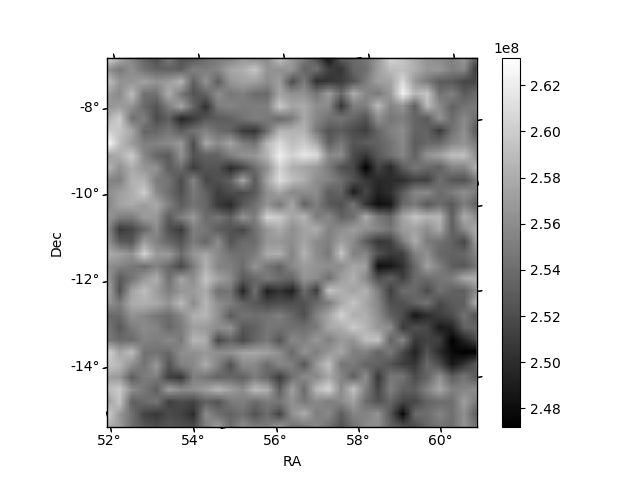 |
| Module-wise count rates for Quadrant C Data is divided into 100 sec bins |
 |
 |
| Module-wise count rates for Quadrant D Data is divided into 100 sec bins |
 |
 |
| Parameter | Plot |
|---|---|
| CZT HV Monitor |  |
| D_VDD | 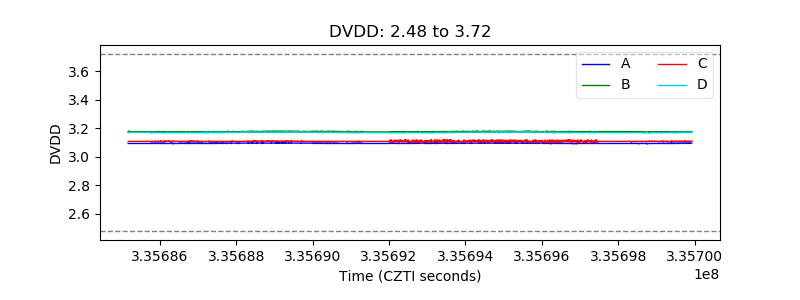 |
| Temperature 1 | 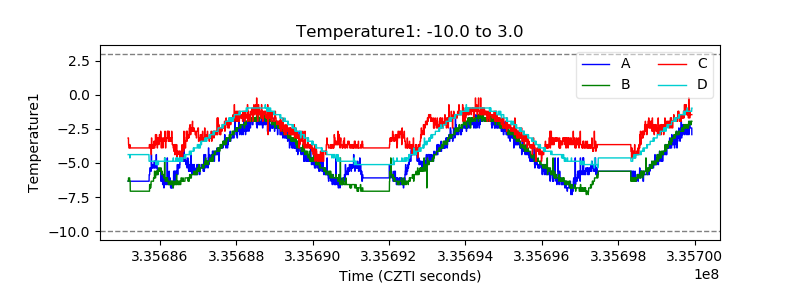 |
| Veto HV Monitor | 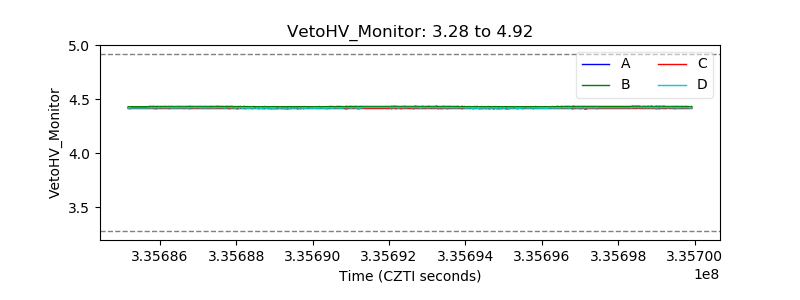 |
| Veto LLD | 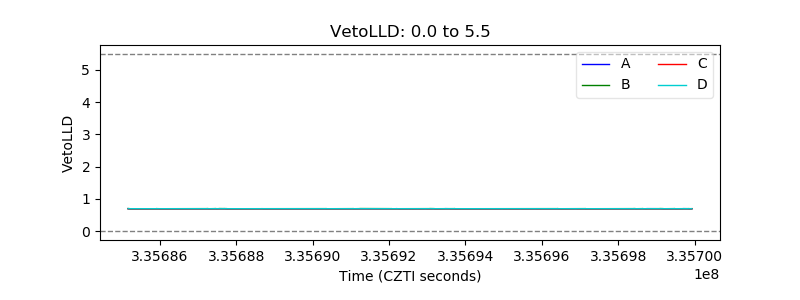 |
| Alpha Counter | 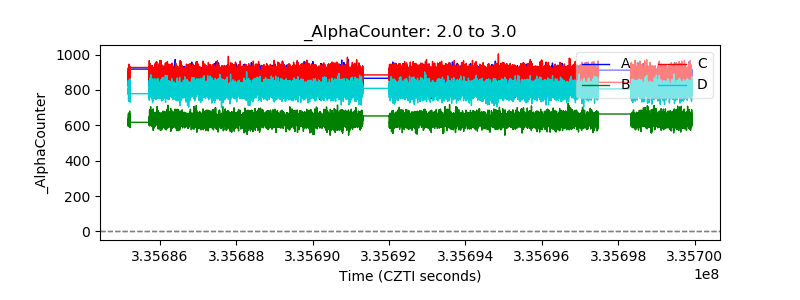 |
| _CPM_Rate | 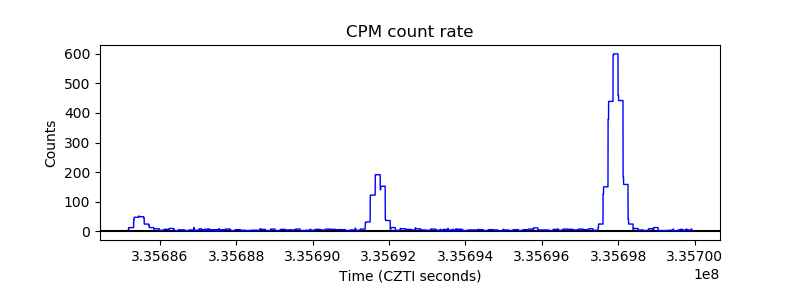 |
| CZT Counter | 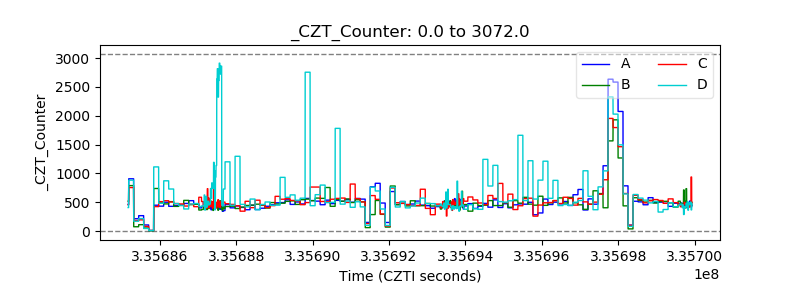 |
| +2.5 Volts monitor |  |
| +5 Volts monitor |  |
| _ROLL_ROT | 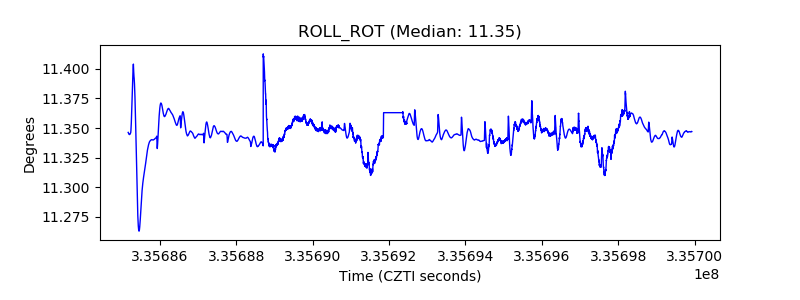 |
| _Roll_DEC |  |
| _Roll_RA | 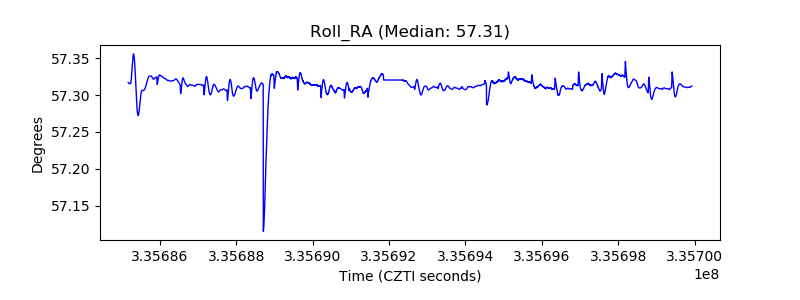 |
| Veto Counter | 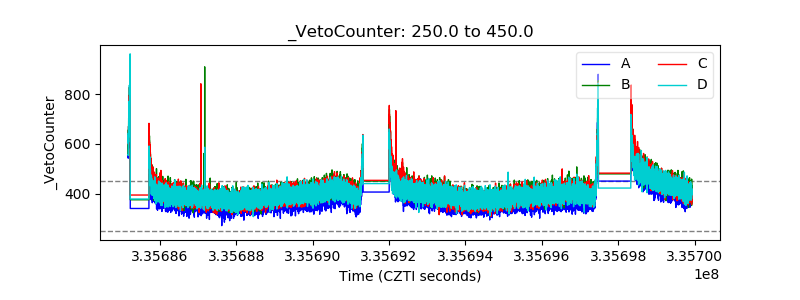 |