| Param | Original file | Final file |
|---|---|---|
| Filename | modeM0/AS1A07_146T01_9000003828_26484cztM0_level2.evt | modeM0/AS1A07_146T01_9000003828_26484cztM0_level2_quad_clean.evt |
| Size (bytes) | 434,059,200 | 72,509,760 |
| Size | 414.0 MB | 69.2 MB |
| Events in quadrant A | 3,023,082 | 449,448 |
| Events in quadrant B | 3,098,695 | 457,423 |
| Events in quadrant C | 3,102,104 | 431,054 |
| Events in quadrant D | 3,503,654 | 428,161 |
| Mode M0 | |||
|---|---|---|---|
| Quadrant | BADHDUFLAG | Total packets | Discarded packets |
| A | 0 | 12759 | 0 |
| B | 0 | 12910 | 0 |
| C | 0 | 12904 | 0 |
| D | 0 | 14273 | 0 |
| Mode M9 | |||
|---|---|---|---|
| Quadrant | BADHDUFLAG | Total packets | Discarded packets |
| A | 0 | 10 | 0 |
| B | 0 | 10 | 0 |
| C | 0 | 10 | 0 |
| D | 0 | 10 | 0 |
| Quadrant | Total seconds | Saturated seconds | Saturation percentage |
|---|---|---|---|
| A | 6147 | 51 | 0.829673% |
| B | 6147 | 70 | 1.138767% |
| C | 6147 | 64 | 1.041158% |
| D | 6147 | 81 | 1.317716% |
Noise dominated data is calculated using 1-second bins in cleaned event files. If a bin has >2000 counts, and if more than 50% of those come from <1% of pixels, then it is considered to be noise-dominated and hence unusable.
| Quadrant | # 1 sec bins | Bins with >0 counts | Bins with >2000 counts | High rate bins dominated by noise | Noise dominated (total time) | Noise dominated (detector-on time) | Marked lightcurve |
|---|---|---|---|---|---|---|---|
| A | 7167 | 6147 | 0 | 0 | 0.00% | 0.00% | 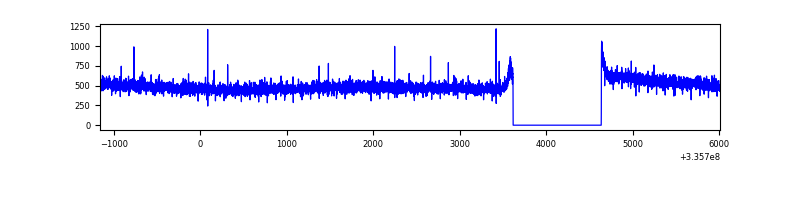 |
| B | 7167 | 6147 | 4 | 4 | 0.06% | 0.07% | 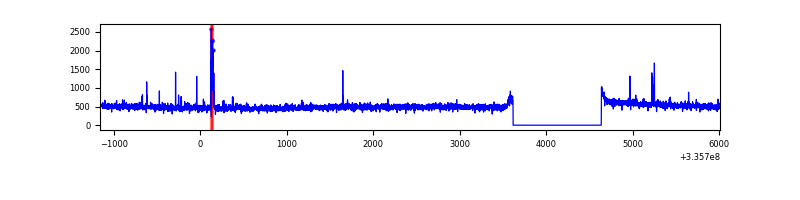 |
| C | 7167 | 6147 | 0 | 0 | 0.00% | 0.00% | 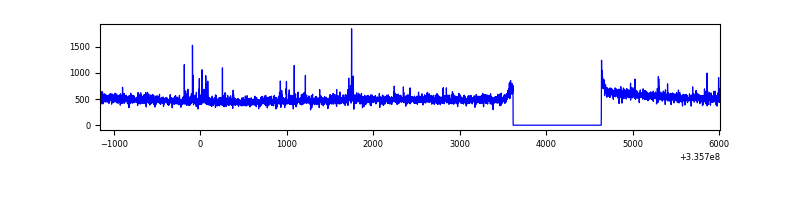 |
| D | 7167 | 6147 | 42 | 42 | 0.59% | 0.68% | 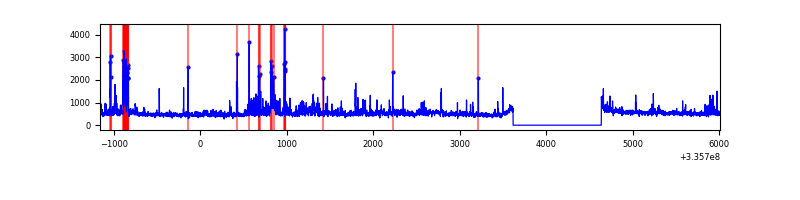 |
Top three noisy pixels from each quadrant. If the there are fewer than three noisy pixels in the level2.evt file, extra rows are filled as -1
| Pixel properties | Quadrant properties | ||||||
|---|---|---|---|---|---|---|---|
| Quadrant | DetID | PixID | Counts | Sigma | Mean | Median | Sigma |
| A | 13 | 254 | 9251 | 53.91 | 783 | 766 | 157.4 |
| A | 3 | 137 | 7123 | 40.39 | 783 | 766 | 157.4 |
| A | 0 | 226 | 6649 | 37.38 | 783 | 766 | 157.4 |
| B | 15 | 33 | 46171 | 309.97 | 770 | 753 | 146.5 |
| B | 12 | 111 | 18024 | 117.87 | 770 | 753 | 146.5 |
| B | 11 | 111 | 16145 | 105.05 | 770 | 753 | 146.5 |
| C | 14 | 238 | 118110 | 675.84 | 743 | 748 | 173.7 |
| C | 3 | 233 | 47270 | 267.9 | 743 | 748 | 173.7 |
| C | 14 | 176 | 33779 | 190.21 | 743 | 748 | 173.7 |
| D | 7 | 80 | 394140 | 2156.46 | 758 | 740 | 182.4 |
| D | 1 | 52 | 140954 | 768.6 | 758 | 740 | 182.4 |
| D | 12 | 233 | 32606 | 174.68 | 758 | 740 | 182.4 |
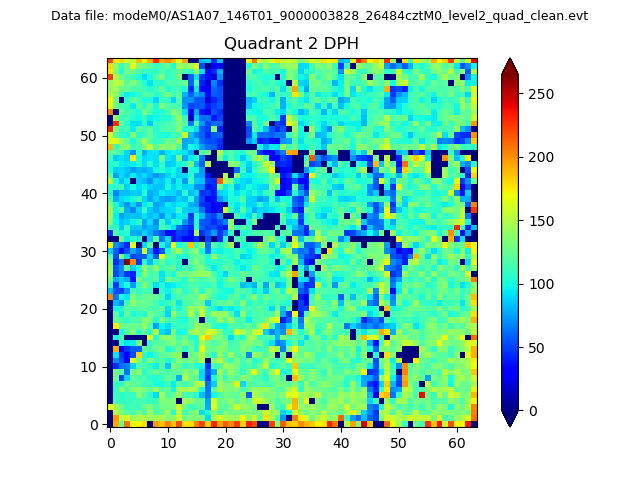
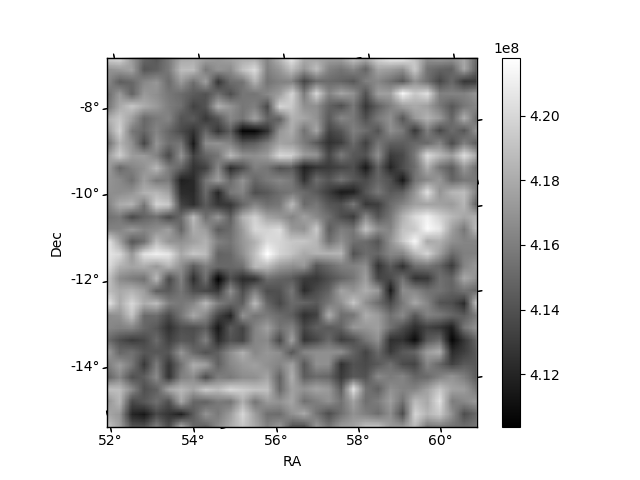
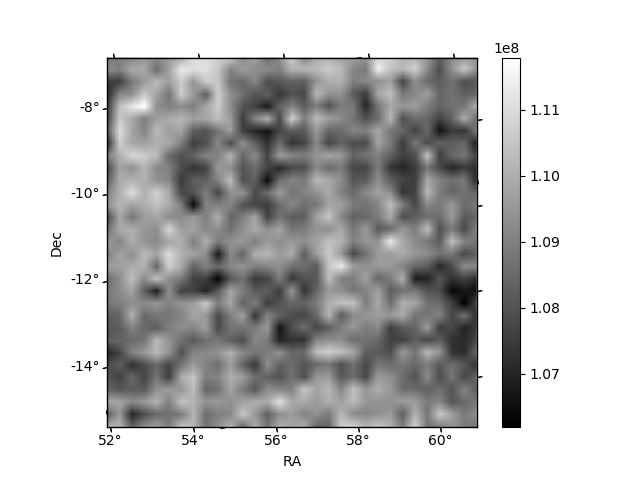
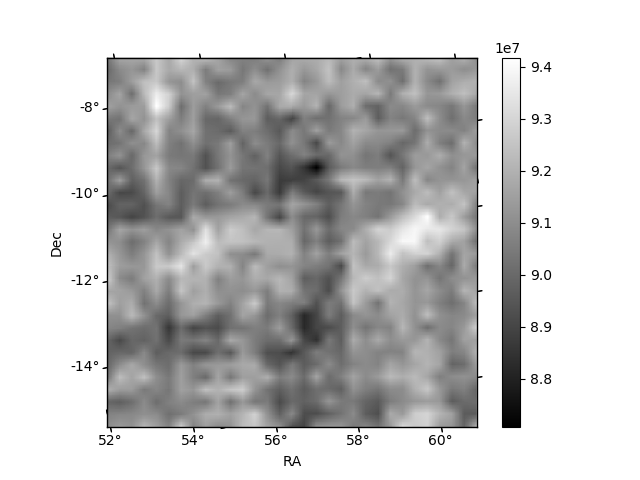
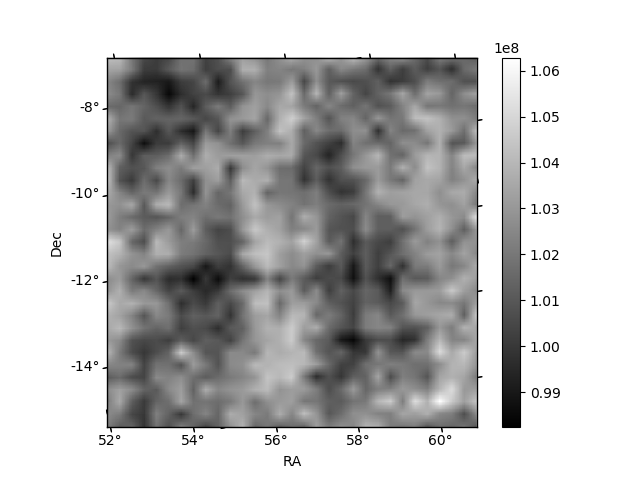
Histogram calculated using DETX and DETY for each event in the final _common_clean file
| Quadrant A | 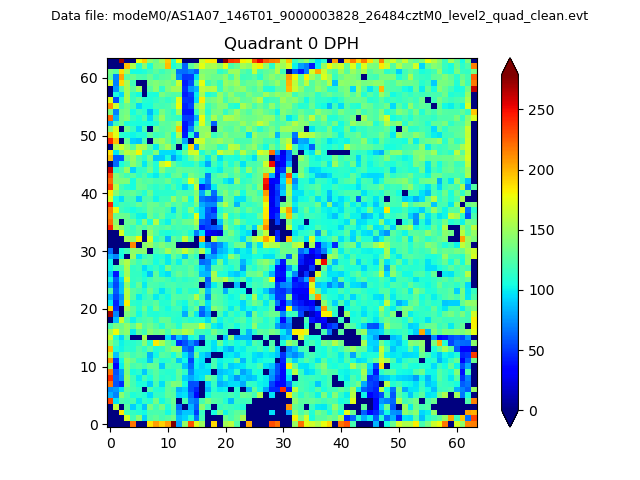 |
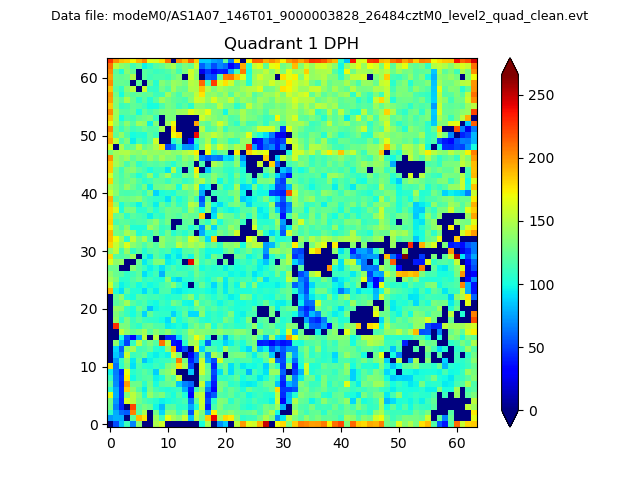 |
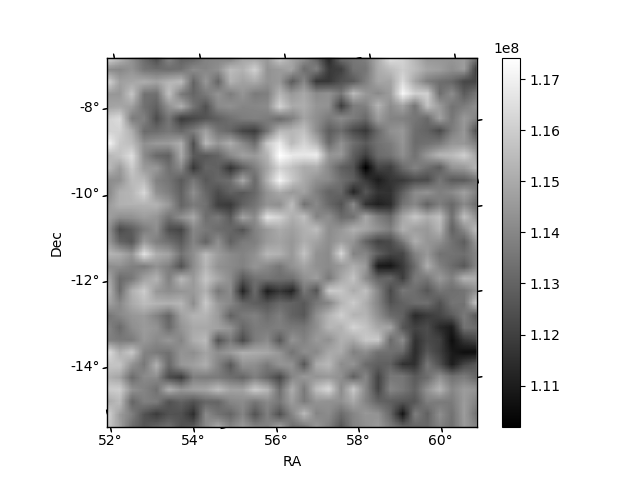
Quadrant B |
|---|---|---|---|
| Quadrant D | 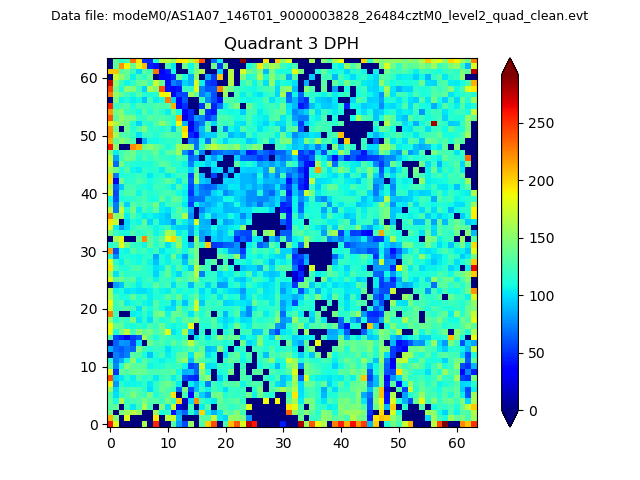 |
 |
Quadrant C |
| Plot type | Count rate plots | Images |
|---|---|---|
| Comparison with Poisson distribution Blue bars denote a histogram of data divided into 1 sec bins. Red curve is a Poisson curve with rate = median count rate of data. |
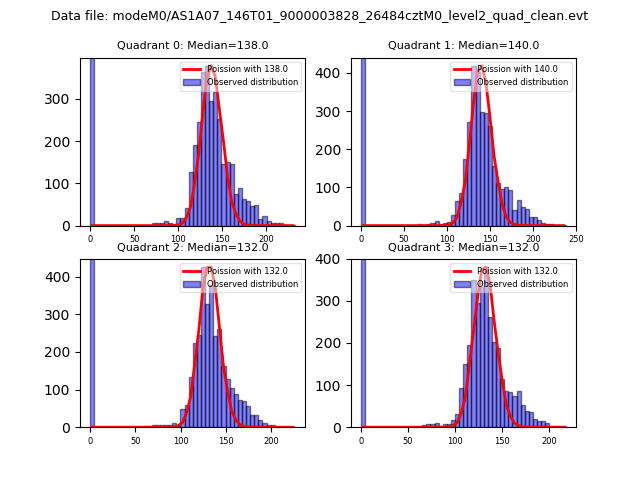 |
 |
| Quadrant-wise count rates Data is divided into 100 sec bins |
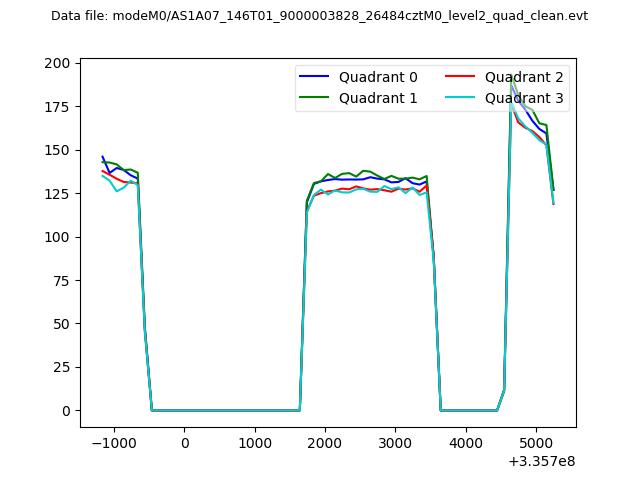 |
|
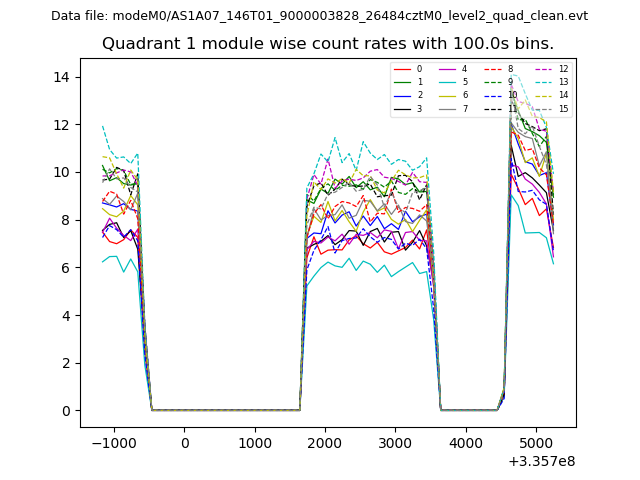
| Module-wise count rates for Quadrant A Data is divided into 100 sec bins |
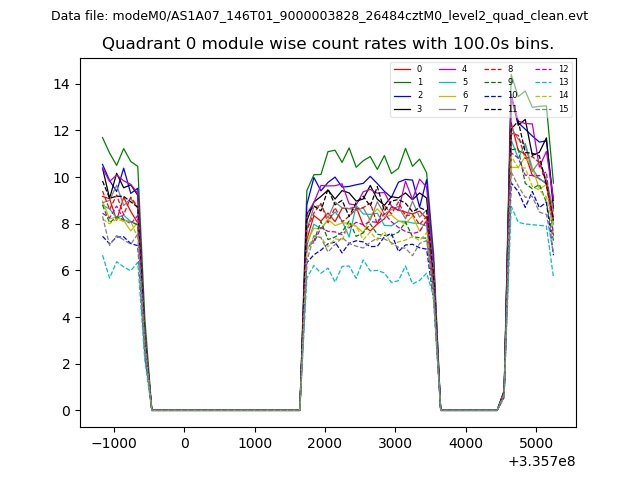 |
 |
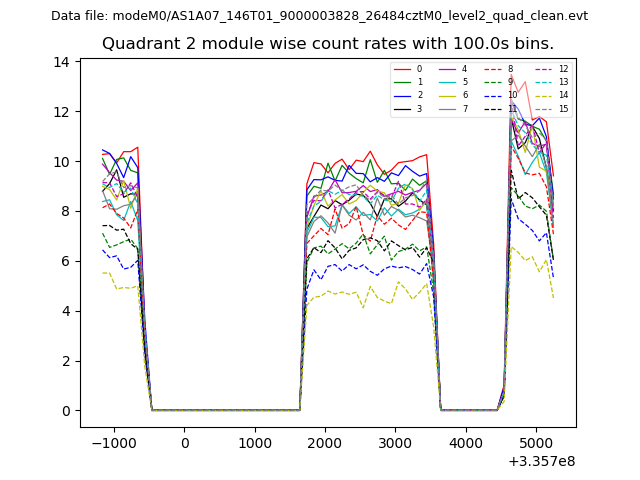
| Module-wise count rates for Quadrant B Data is divided into 100 sec bins |
 |
 |
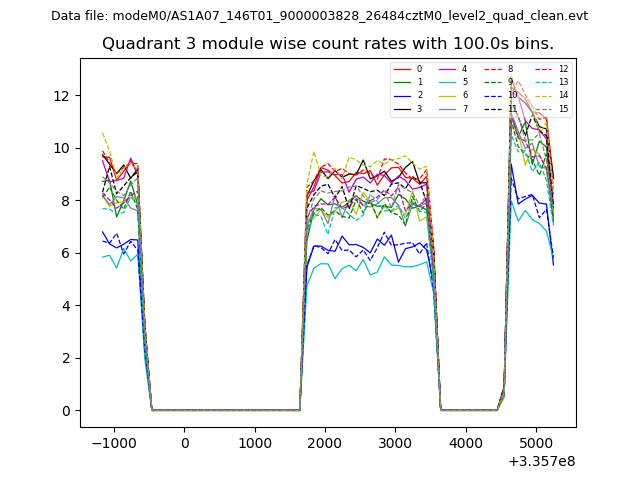
| Module-wise count rates for Quadrant C Data is divided into 100 sec bins |
 |
 |
| Module-wise count rates for Quadrant D Data is divided into 100 sec bins |
 |
 |
| Parameter | Plot |
|---|---|
| CZT HV Monitor | 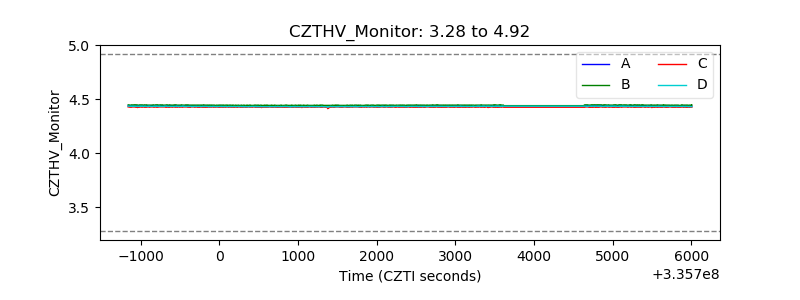 |
| D_VDD | 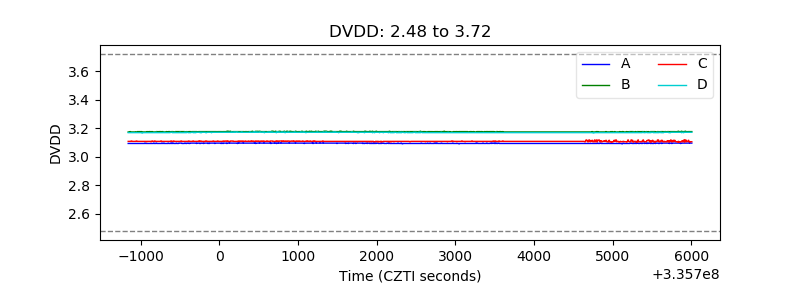 |
| Temperature 1 | 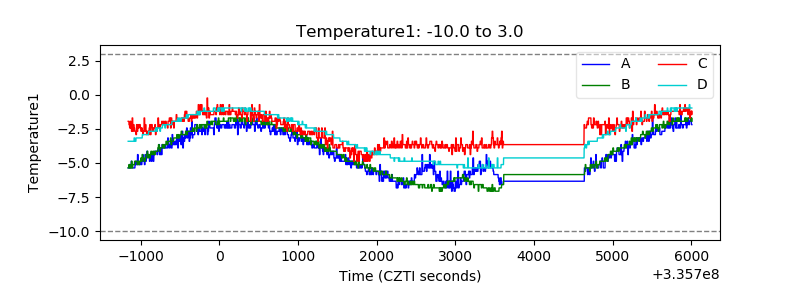 |
| Veto HV Monitor | 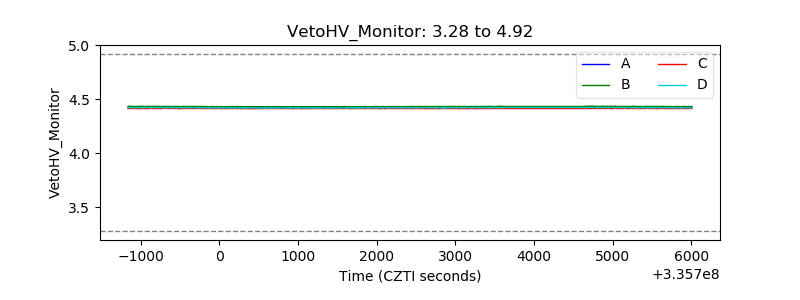 |
| Veto LLD | 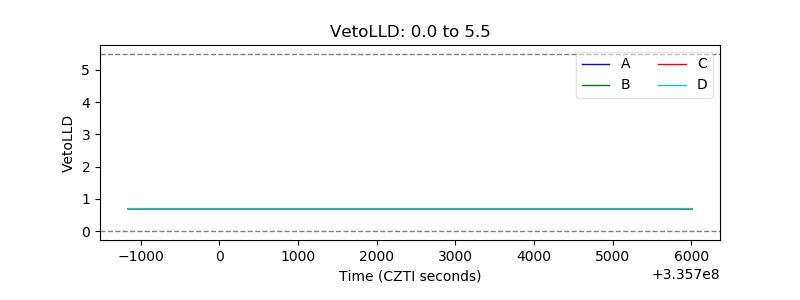 |
| Alpha Counter | 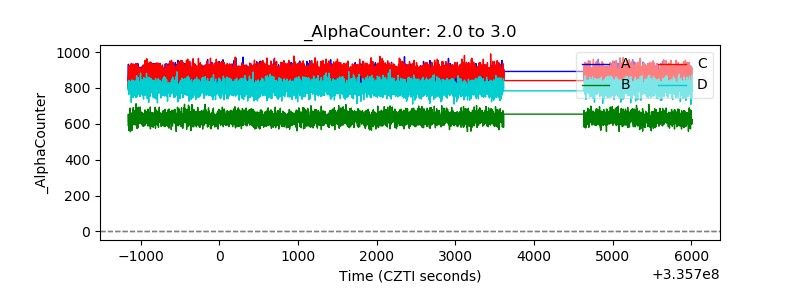 |
| _CPM_Rate | 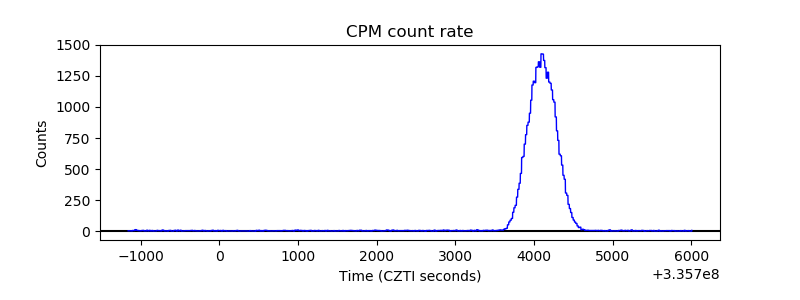 |
| CZT Counter | 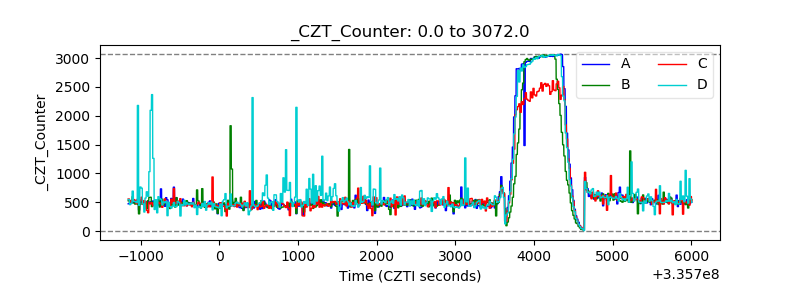 |
| +2.5 Volts monitor | 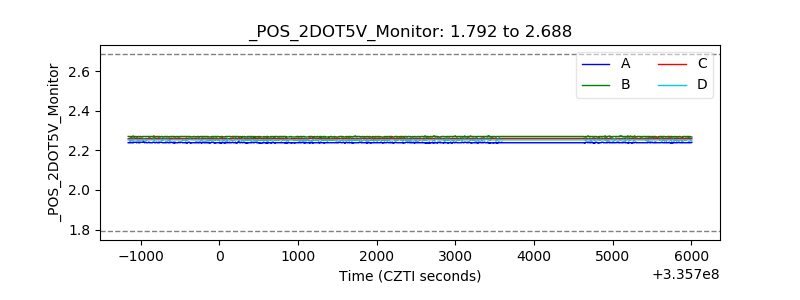 |
| +5 Volts monitor |  |
| _ROLL_ROT | 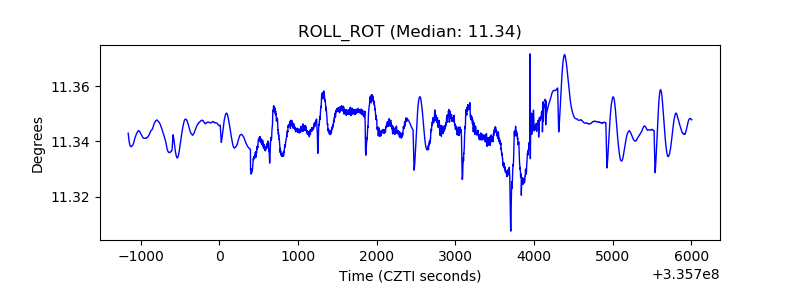 |
| _Roll_DEC | 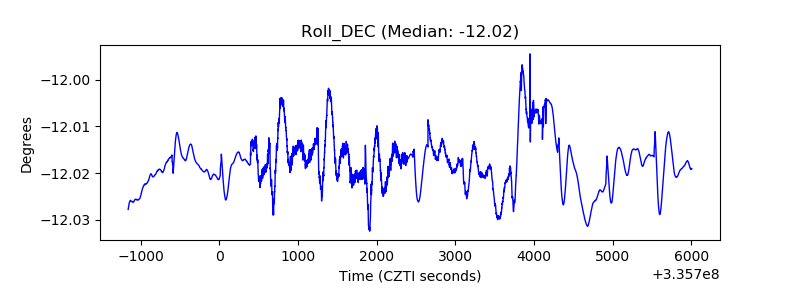 |
| _Roll_RA | 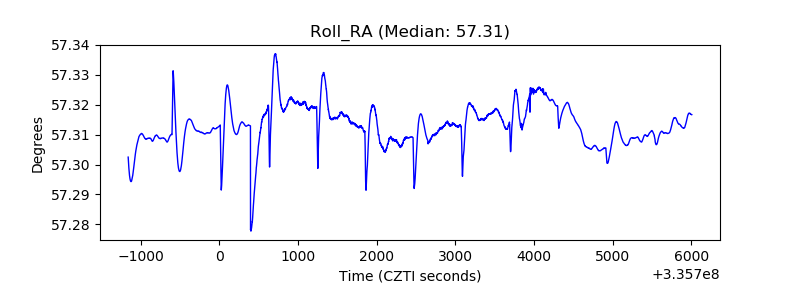 |
| Veto Counter | 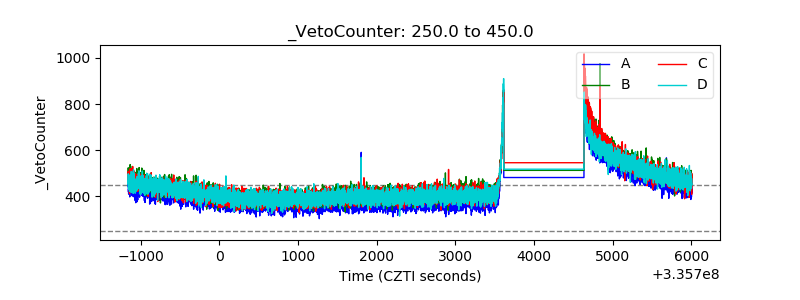 |