| Param | Original file | Final file |
|---|---|---|
| Filename | modeM0/AS1A07_146T01_9000003828_26486cztM0_level2.evt | modeM0/AS1A07_146T01_9000003828_26486cztM0_level2_quad_clean.evt |
| Size (bytes) | 509,172,480 | 69,330,240 |
| Size | 485.6 MB | 66.1 MB |
| Events in quadrant A | 3,315,542 | 427,438 |
| Events in quadrant B | 3,353,120 | 433,591 |
| Events in quadrant C | 3,447,346 | 405,795 |
| Events in quadrant D | 4,871,443 | 386,881 |
| Mode M0 | |||
|---|---|---|---|
| Quadrant | BADHDUFLAG | Total packets | Discarded packets |
| A | 0 | 13819 | 0 |
| B | 0 | 13875 | 0 |
| C | 0 | 14132 | 0 |
| D | 0 | 18638 | 0 |
| Mode M9 | |||
|---|---|---|---|
| Quadrant | BADHDUFLAG | Total packets | Discarded packets |
| A | 0 | 12 | 0 |
| B | 0 | 12 | 0 |
| C | 0 | 12 | 0 |
| D | 0 | 12 | 0 |
| Quadrant | Total seconds | Saturated seconds | Saturation percentage |
|---|---|---|---|
| A | 6384 | 71 | 1.112155% |
| B | 6384 | 84 | 1.315789% |
| C | 6383 | 106 | 1.660661% |
| D | 6384 | 464 | 7.268170% |
Noise dominated data is calculated using 1-second bins in cleaned event files. If a bin has >2000 counts, and if more than 50% of those come from <1% of pixels, then it is considered to be noise-dominated and hence unusable.
| Quadrant | # 1 sec bins | Bins with >0 counts | Bins with >2000 counts | High rate bins dominated by noise | Noise dominated (total time) | Noise dominated (detector-on time) | Marked lightcurve |
|---|---|---|---|---|---|---|---|
| A | 7529 | 6384 | 0 | 0 | 0.00% | 0.00% | 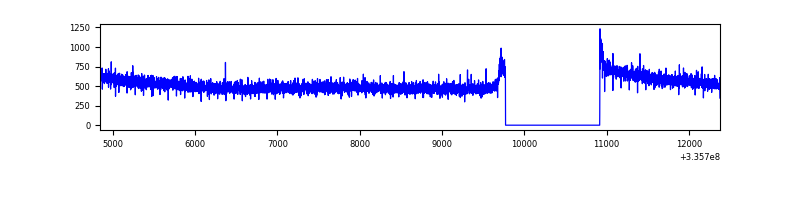 |
| B | 7529 | 6384 | 0 | 0 | 0.00% | 0.00% | 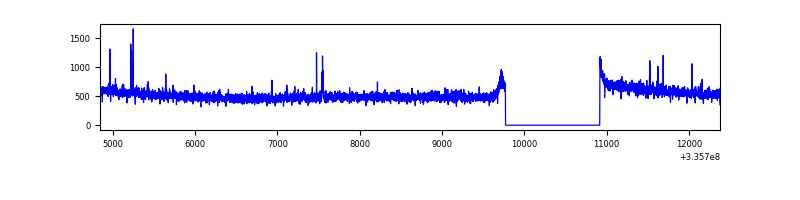 |
| C | 7528 | 6383 | 1 | 1 | 0.01% | 0.02% | 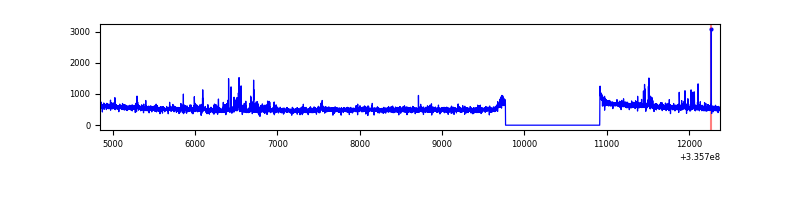 |
| D | 7529 | 6384 | 349 | 349 | 4.64% | 5.47% | 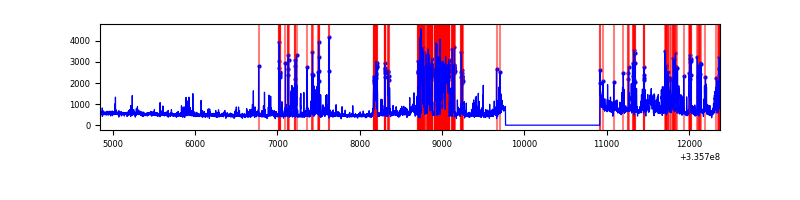 |
Top three noisy pixels from each quadrant. If the there are fewer than three noisy pixels in the level2.evt file, extra rows are filled as -1
| Pixel properties | Quadrant properties | ||||||
|---|---|---|---|---|---|---|---|
| Quadrant | DetID | PixID | Counts | Sigma | Mean | Median | Sigma |
| A | 13 | 254 | 9876 | 52.64 | 860 | 843 | 171.6 |
| A | 3 | 137 | 7518 | 38.9 | 860 | 843 | 171.6 |
| A | 0 | 226 | 7418 | 38.32 | 860 | 843 | 171.6 |
| B | 12 | 111 | 19030 | 113.09 | 847 | 826 | 161.0 |
| B | 11 | 111 | 17178 | 101.58 | 847 | 826 | 161.0 |
| B | 0 | 190 | 15403 | 90.55 | 847 | 826 | 161.0 |
| C | 14 | 238 | 131499 | 687.24 | 813 | 820 | 190.2 |
| C | 3 | 233 | 96017 | 500.64 | 813 | 820 | 190.2 |
| C | 4 | 254 | 30090 | 153.93 | 813 | 820 | 190.2 |
| D | 1 | 52 | 1144100 | 5874.78 | 815 | 796 | 194.6 |
| D | 7 | 80 | 484600 | 2485.99 | 815 | 796 | 194.6 |
| D | 12 | 233 | 72527 | 368.58 | 815 | 796 | 194.6 |
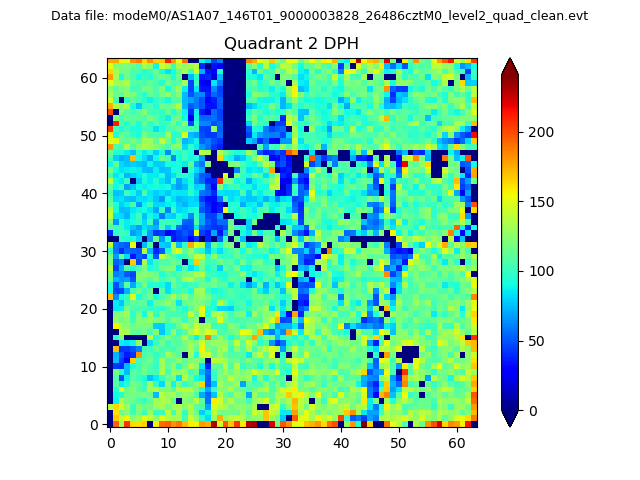
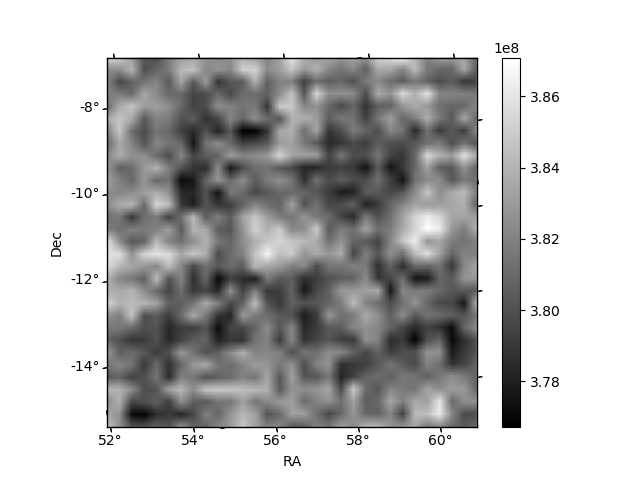
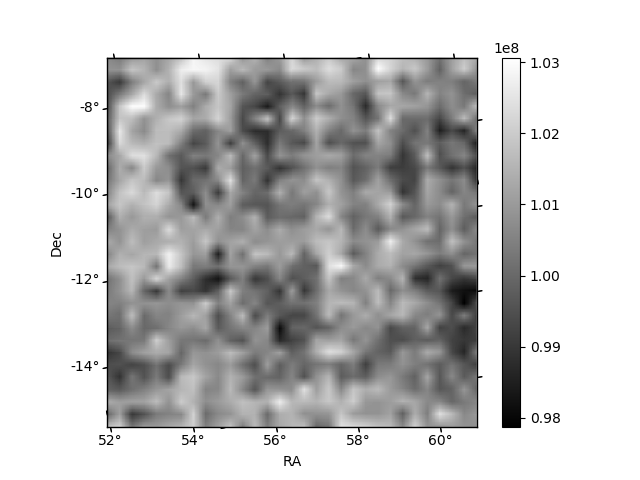
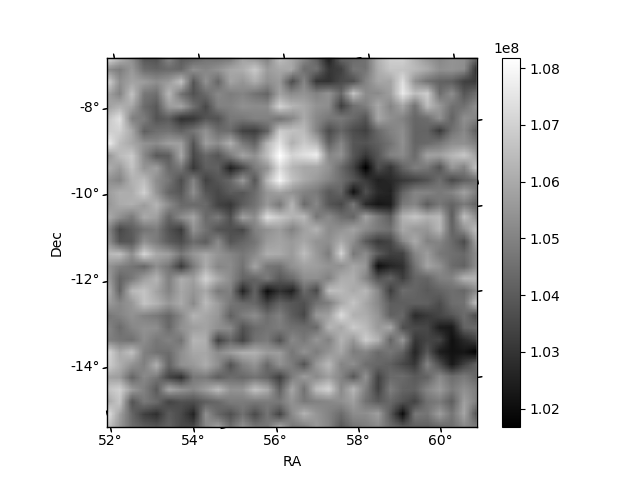
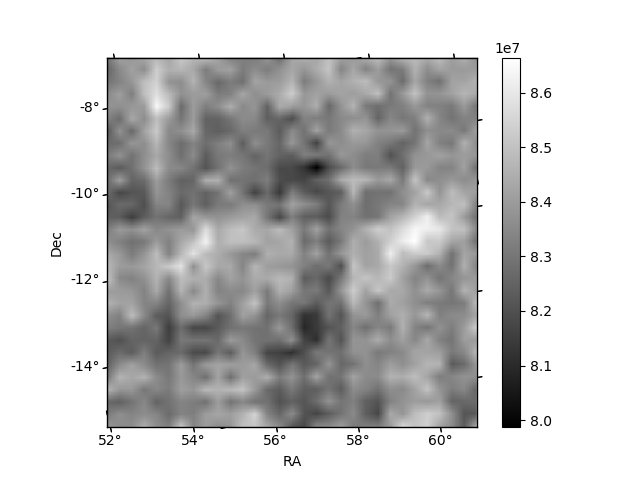
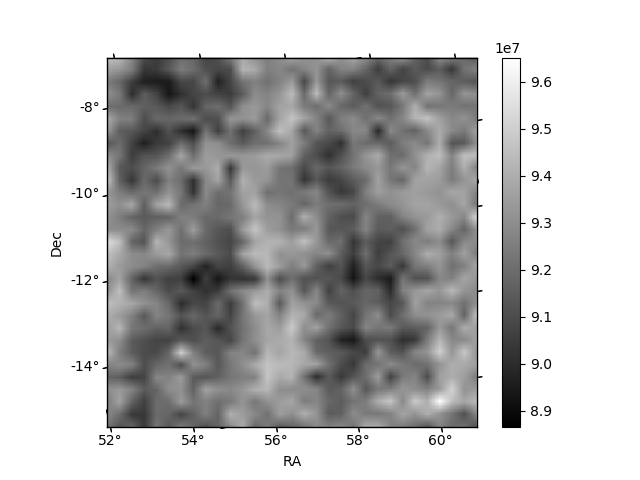
Histogram calculated using DETX and DETY for each event in the final _common_clean file
| Quadrant A | 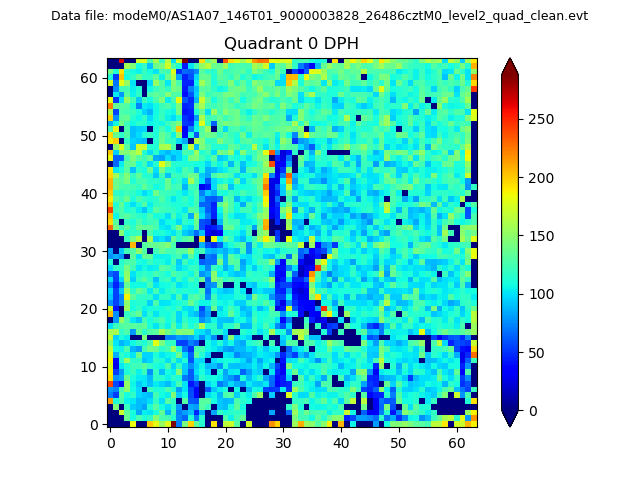 |
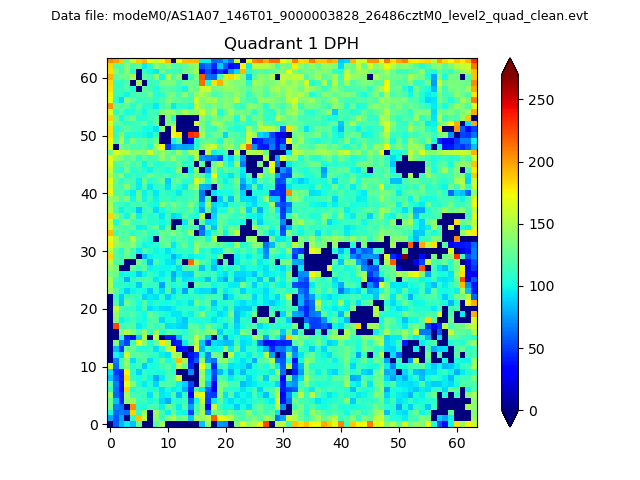 |
Quadrant B |
|---|---|---|---|
| Quadrant D | 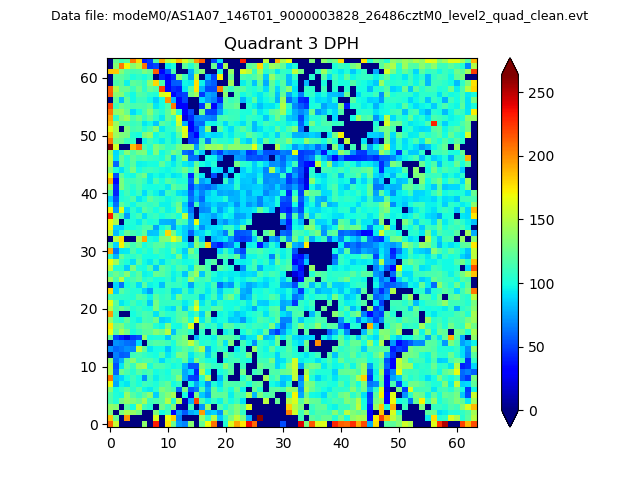 |
 |
Quadrant C |
| Plot type | Count rate plots | Images |
|---|---|---|
| Comparison with Poisson distribution Blue bars denote a histogram of data divided into 1 sec bins. Red curve is a Poisson curve with rate = median count rate of data. |
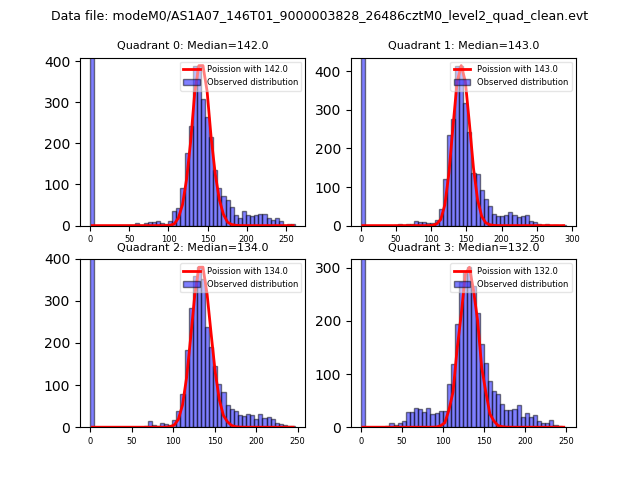 |
 |
| Quadrant-wise count rates Data is divided into 100 sec bins |
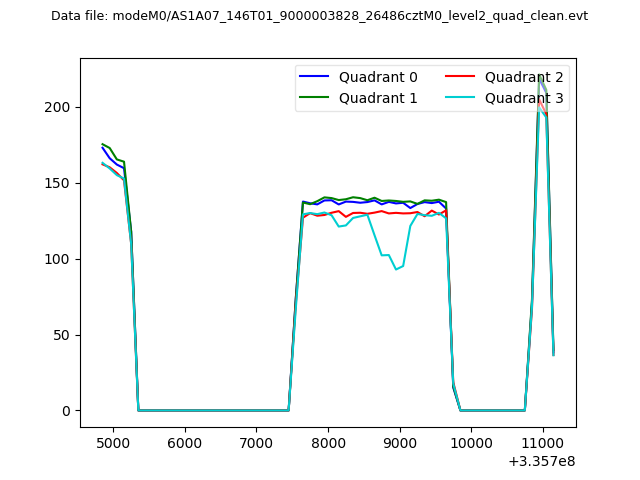 |
|
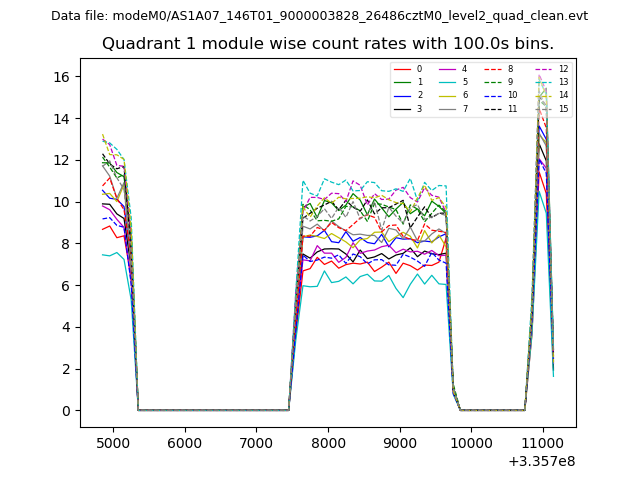
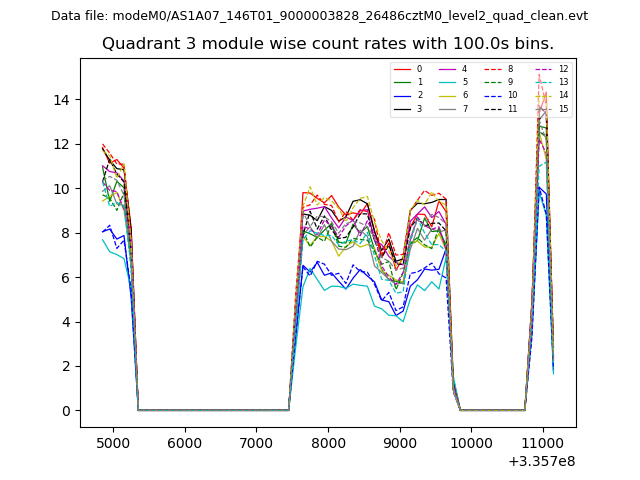
| Module-wise count rates for Quadrant A Data is divided into 100 sec bins |
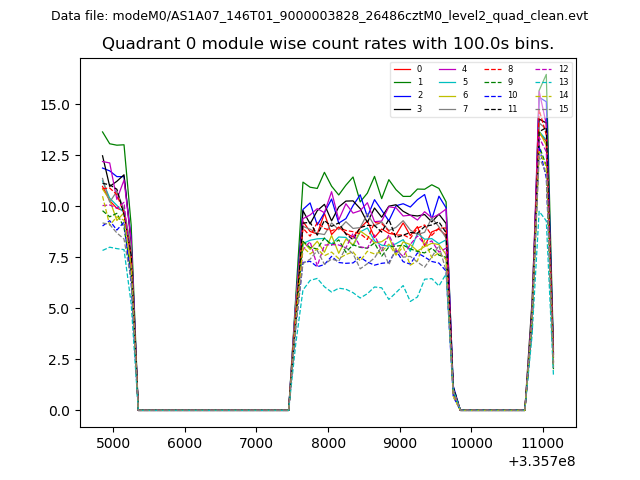 |
 |
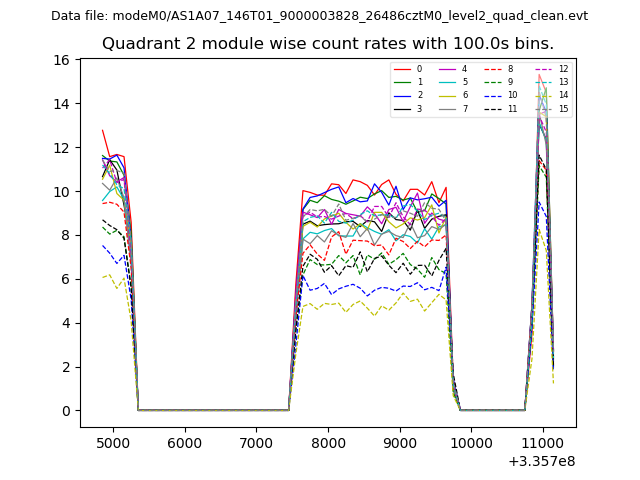
| Module-wise count rates for Quadrant B Data is divided into 100 sec bins |
 |
 |
| Module-wise count rates for Quadrant C Data is divided into 100 sec bins |
 |
 |
| Module-wise count rates for Quadrant D Data is divided into 100 sec bins |
 |
 |
| Parameter | Plot |
|---|---|
| CZT HV Monitor | 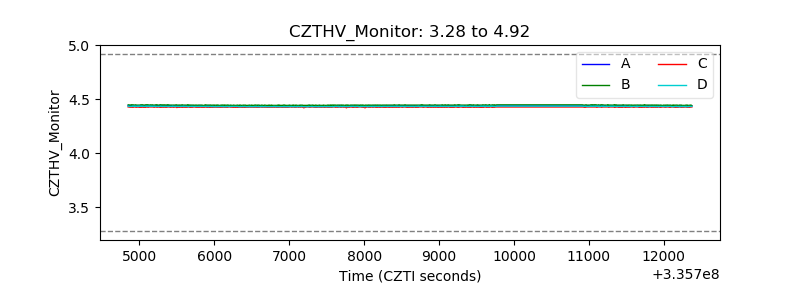 |
| D_VDD | 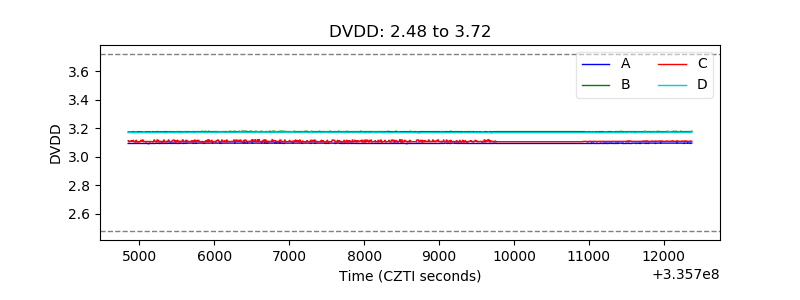 |
| Temperature 1 | 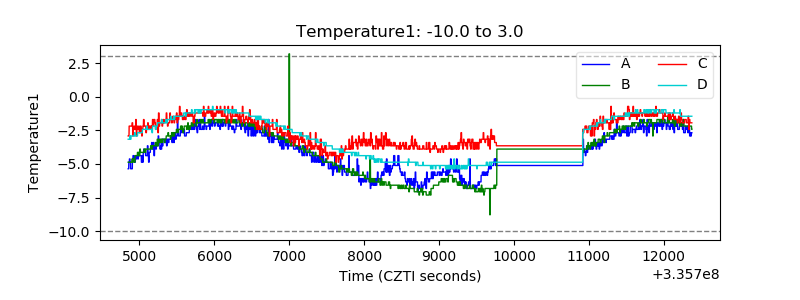 |
| Veto HV Monitor | 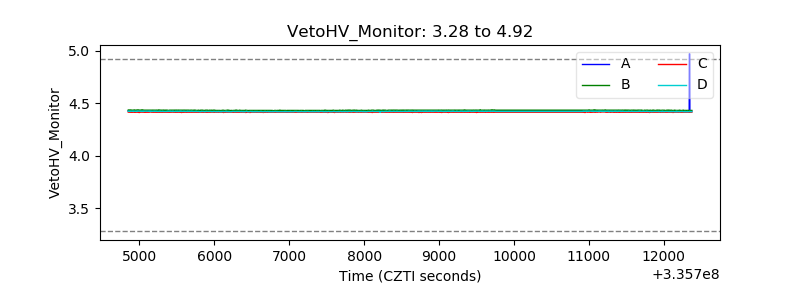 |
| Veto LLD | 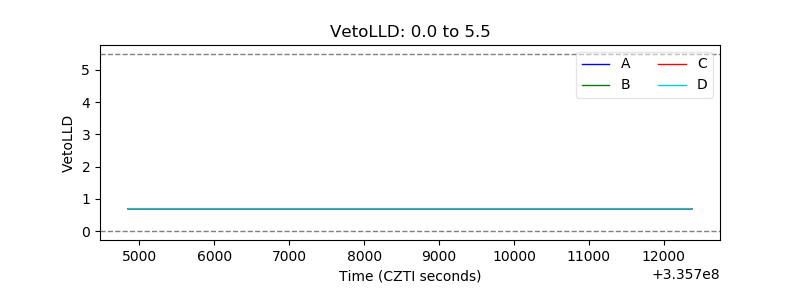 |
| Alpha Counter |  |
| _CPM_Rate | 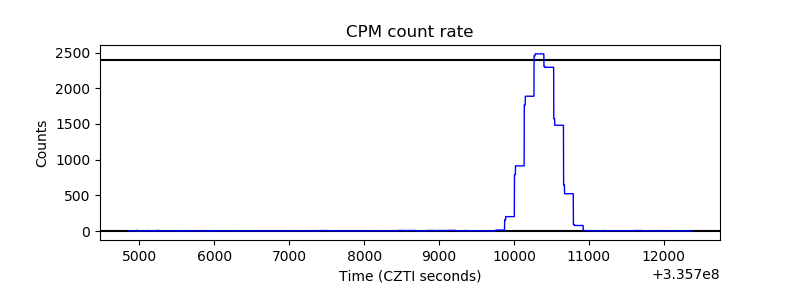 |
| CZT Counter | 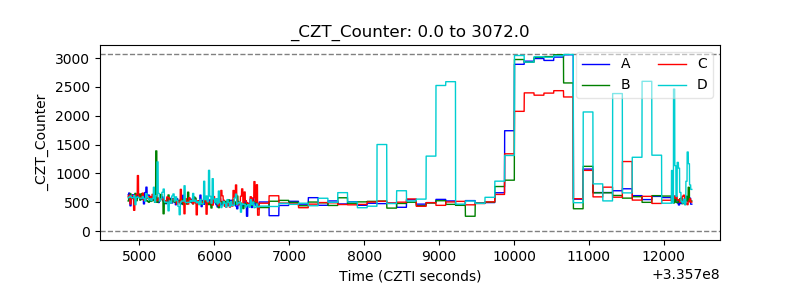 |
| +2.5 Volts monitor |  |
| +5 Volts monitor |  |
| _ROLL_ROT | 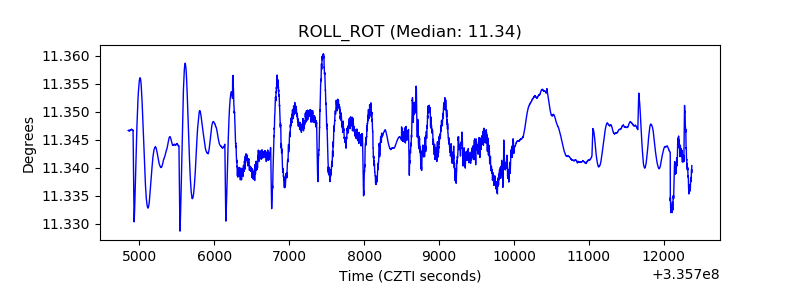 |
| _Roll_DEC | 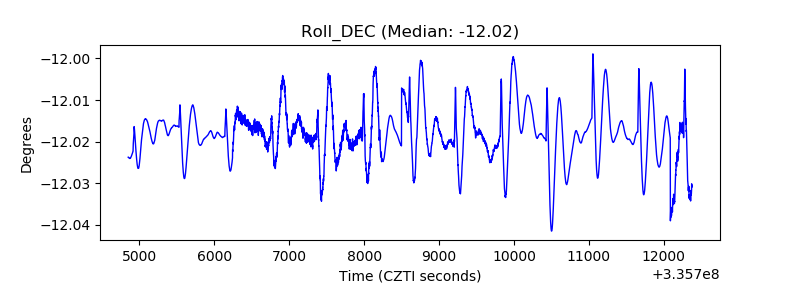 |
| _Roll_RA | 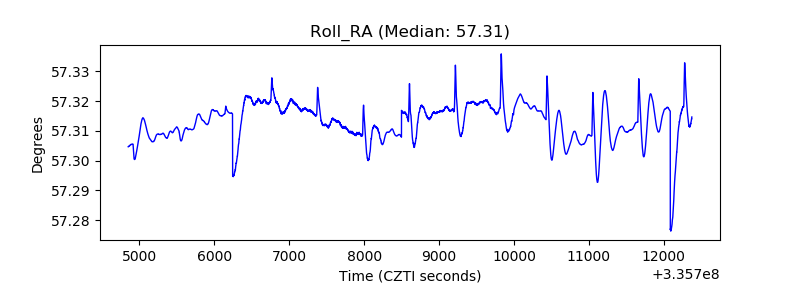 |
| Veto Counter | 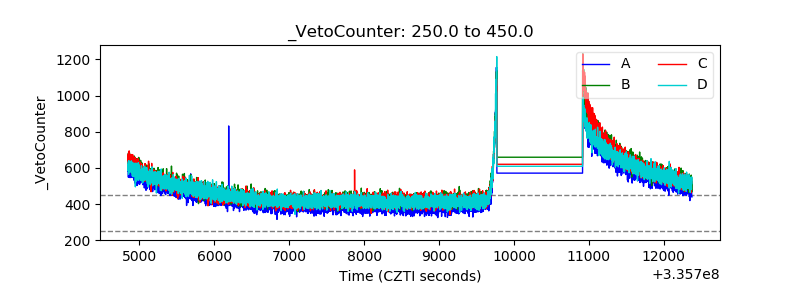 |