| Param | Original file | Final file |
|---|---|---|
| Filename | modeM0/AS1A07_146T01_9000003828_26487cztM0_level2.evt | modeM0/AS1A07_146T01_9000003828_26487cztM0_level2_quad_clean.evt |
| Size (bytes) | 241,433,280 | 13,060,800 |
| Size | 230.2 MB | 12.5 MB |
| Events in quadrant A | 1,423,547 | 54,607 |
| Events in quadrant B | 1,431,958 | 55,450 |
| Events in quadrant C | 1,504,845 | 51,410 |
| Events in quadrant D | 2,777,530 | 50,956 |
| Mode M0 | |||
|---|---|---|---|
| Quadrant | BADHDUFLAG | Total packets | Discarded packets |
| A | 0 | 5820 | 0 |
| B | 0 | 5863 | 0 |
| C | 0 | 6121 | 0 |
| D | 0 | 10068 | 0 |
| Quadrant | Total seconds | Saturated seconds | Saturation percentage |
|---|---|---|---|
| A | 2540 | 6 | 0.236220% |
| B | 2541 | 8 | 0.314837% |
| C | 2541 | 33 | 1.298701% |
| D | 2541 | 395 | 15.545061% |
Noise dominated data is calculated using 1-second bins in cleaned event files. If a bin has >2000 counts, and if more than 50% of those come from <1% of pixels, then it is considered to be noise-dominated and hence unusable.
| Quadrant | # 1 sec bins | Bins with >0 counts | Bins with >2000 counts | High rate bins dominated by noise | Noise dominated (total time) | Noise dominated (detector-on time) | Marked lightcurve |
|---|---|---|---|---|---|---|---|
| A | 2540 | 2540 | 0 | 0 | 0.00% | 0.00% | 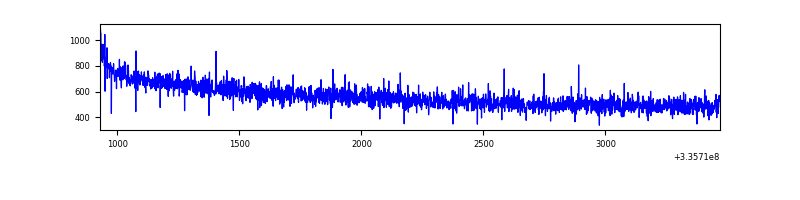 |
| B | 2541 | 2541 | 0 | 0 | 0.00% | 0.00% | 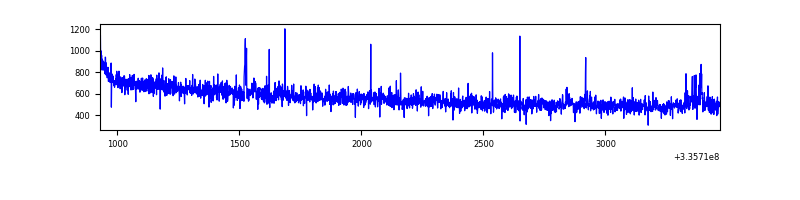 |
| C | 2541 | 2541 | 5 | 5 | 0.20% | 0.20% | 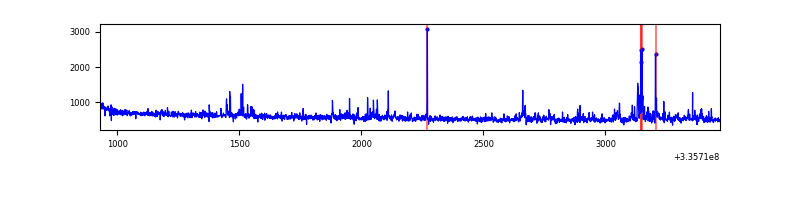 |
| D | 2541 | 2541 | 329 | 329 | 12.95% | 12.95% | 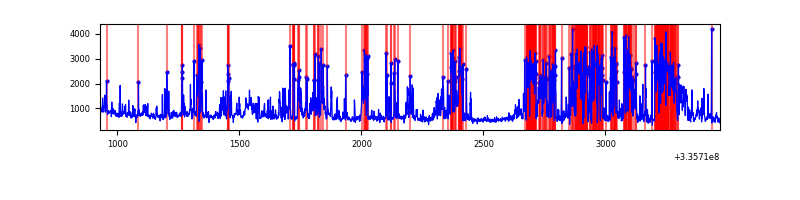 |
Top three noisy pixels from each quadrant. If the there are fewer than three noisy pixels in the level2.evt file, extra rows are filled as -1
| Pixel properties | Quadrant properties | ||||||
|---|---|---|---|---|---|---|---|
| Quadrant | DetID | PixID | Counts | Sigma | Mean | Median | Sigma |
| A | 13 | 254 | 3978 | 48.83 | 369 | 363 | 74.0 |
| A | 0 | 226 | 3272 | 39.29 | 369 | 363 | 74.0 |
| A | 3 | 137 | 3033 | 36.07 | 369 | 363 | 74.0 |
| B | 0 | 190 | 13309 | 190.19 | 361 | 354 | 68.1 |
| B | 12 | 111 | 7548 | 105.61 | 361 | 354 | 68.1 |
| B | 11 | 111 | 6901 | 96.11 | 361 | 354 | 68.1 |
| C | 4 | 254 | 95923 | 1190.54 | 344 | 347 | 80.3 |
| C | 14 | 238 | 56808 | 703.3 | 344 | 347 | 80.3 |
| C | 3 | 233 | 9814 | 117.93 | 344 | 347 | 80.3 |
| D | 1 | 52 | 882934 | 10755.75 | 338 | 331 | 82.1 |
| D | 7 | 80 | 528018 | 6430.6 | 338 | 331 | 82.1 |
| D | 12 | 233 | 53958 | 653.52 | 338 | 331 | 82.1 |
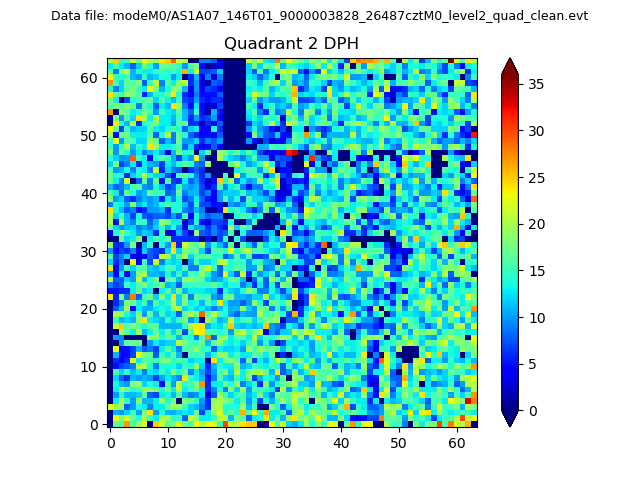
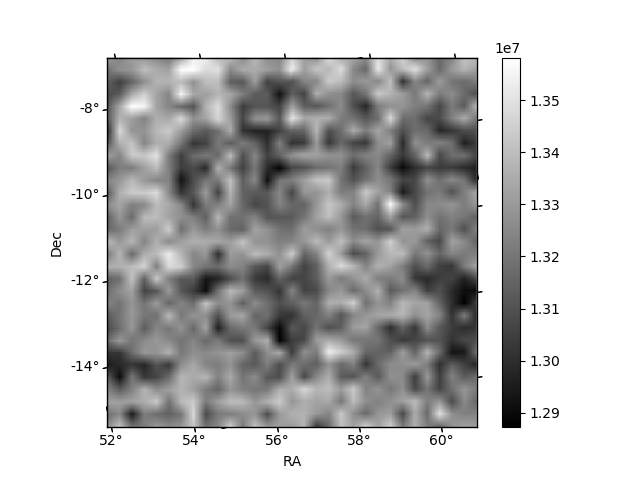
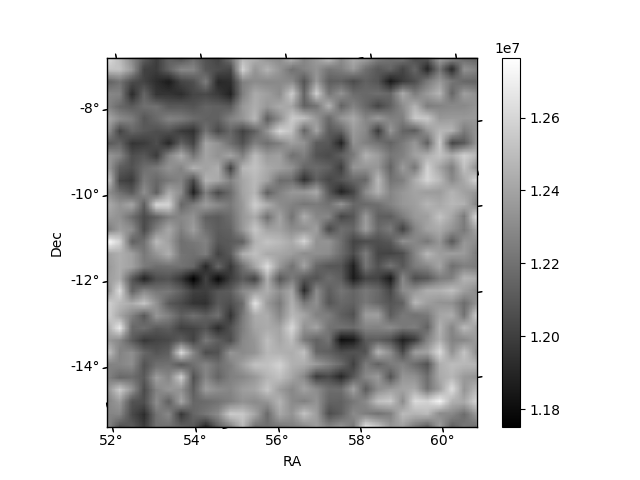
Histogram calculated using DETX and DETY for each event in the final _common_clean file
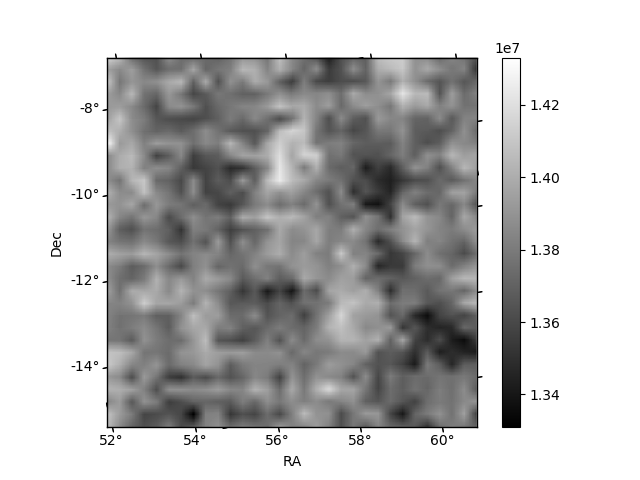
| Quadrant A | 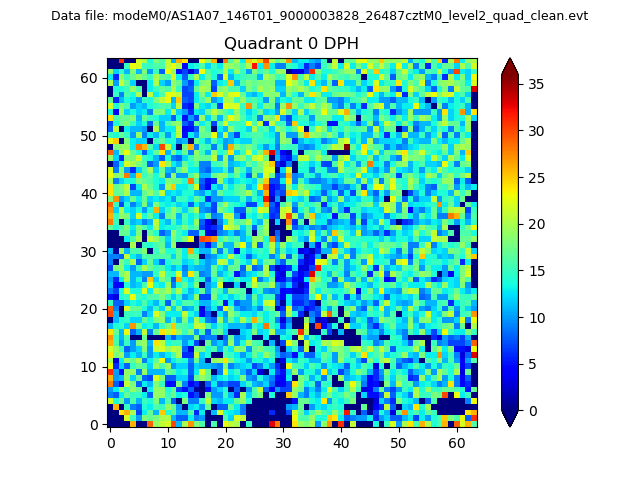 |
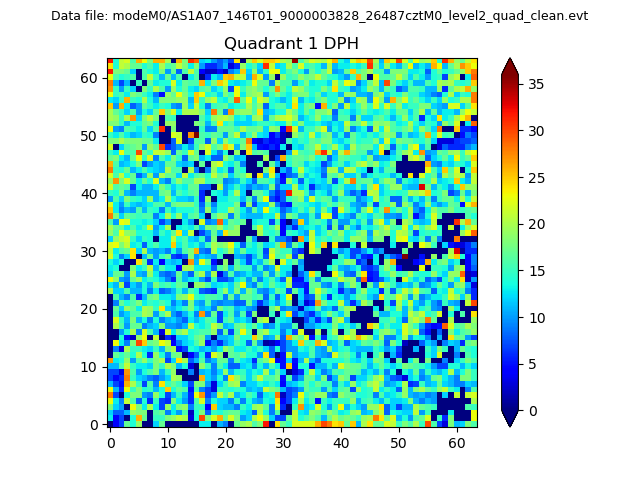 |
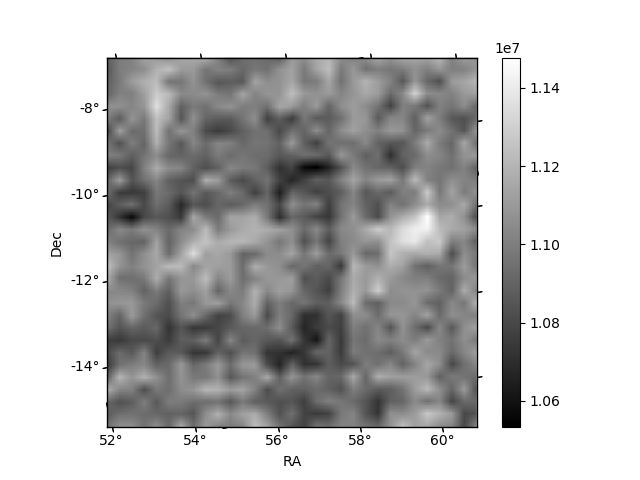
Quadrant B |
|---|---|---|---|
| Quadrant D | 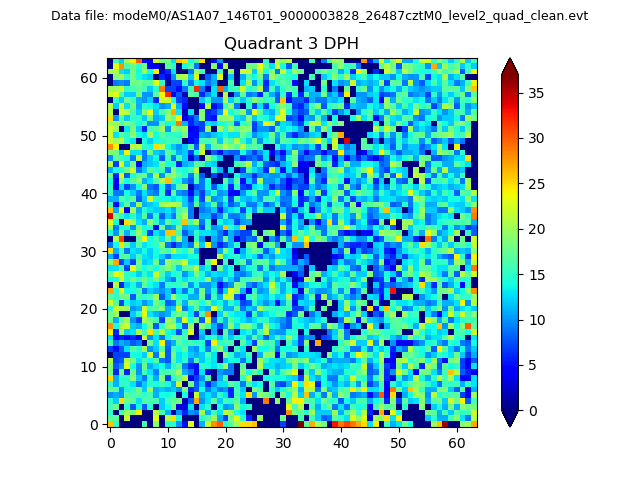 |
 |
Quadrant C |
| Plot type | Count rate plots | Images |
|---|---|---|
| Comparison with Poisson distribution Blue bars denote a histogram of data divided into 1 sec bins. Red curve is a Poisson curve with rate = median count rate of data. |
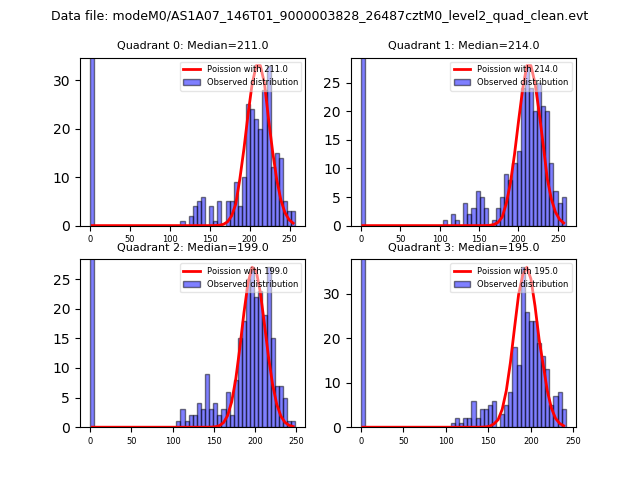 |
 |
| Quadrant-wise count rates Data is divided into 100 sec bins |
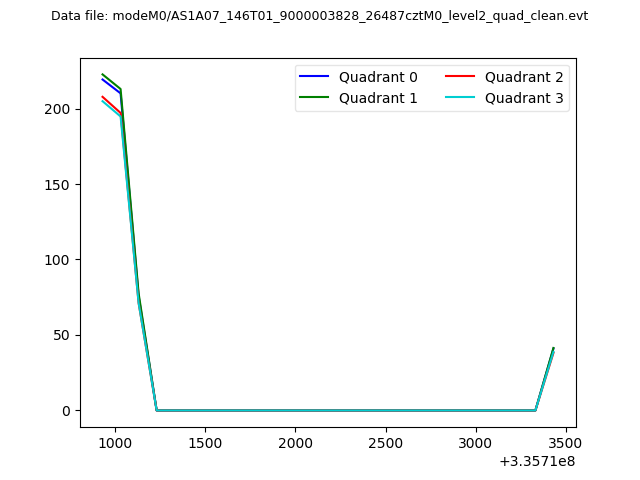 |
|
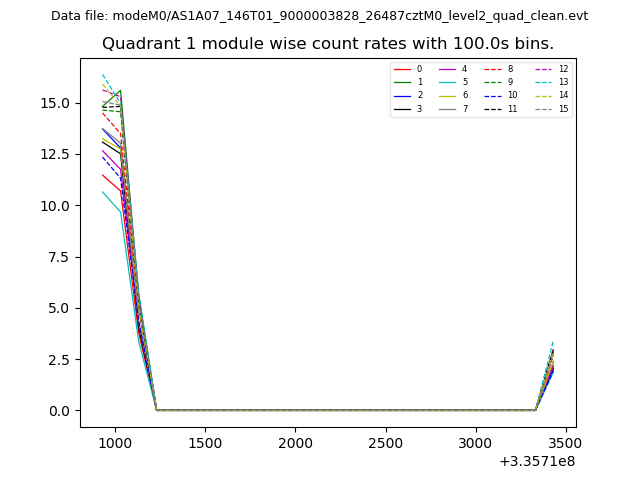
| Module-wise count rates for Quadrant A Data is divided into 100 sec bins |
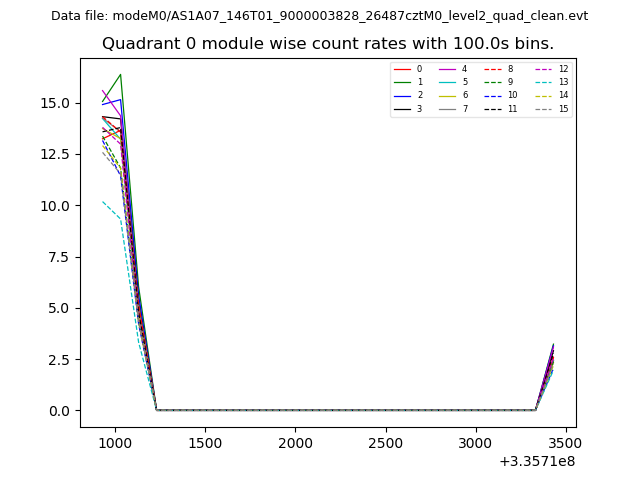 |
 |
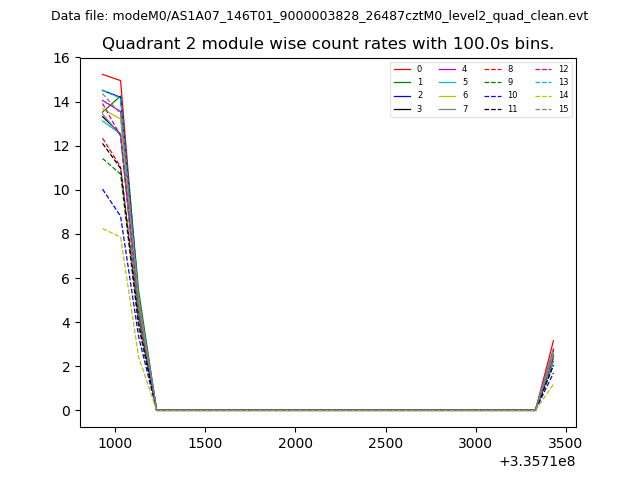
| Module-wise count rates for Quadrant B Data is divided into 100 sec bins |
 |
 |
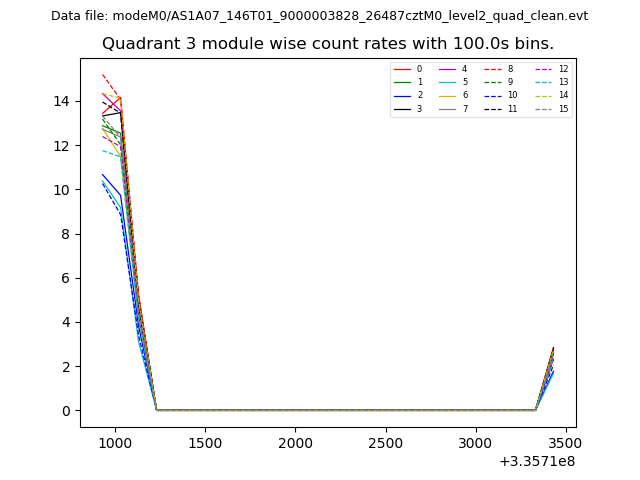
| Module-wise count rates for Quadrant C Data is divided into 100 sec bins |
 |
 |
| Module-wise count rates for Quadrant D Data is divided into 100 sec bins |
 |
 |
| Parameter | Plot |
|---|---|
| CZT HV Monitor | 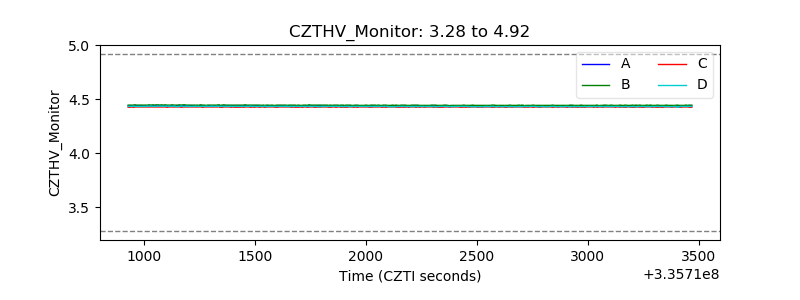 |
| D_VDD | 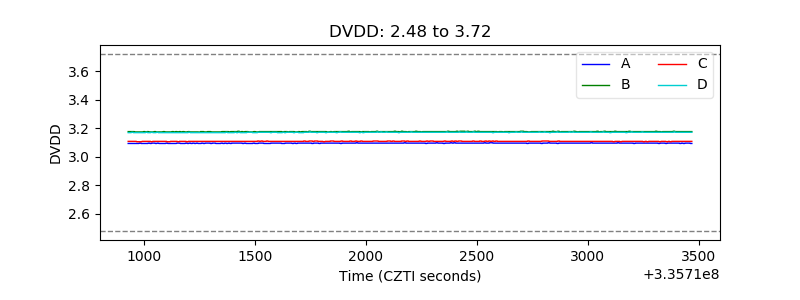 |
| Temperature 1 | 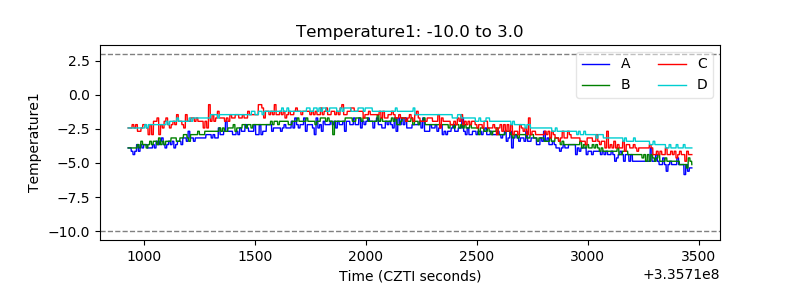 |
| Veto HV Monitor | 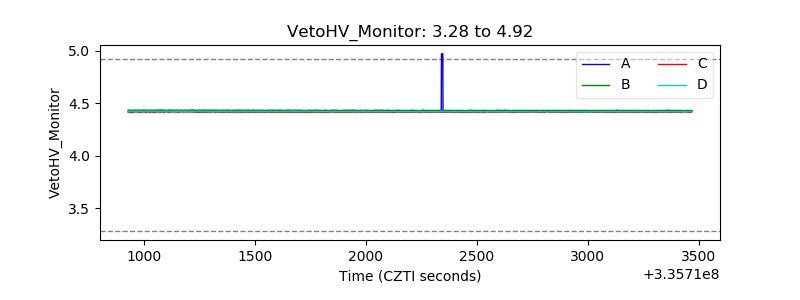 |
| Veto LLD | 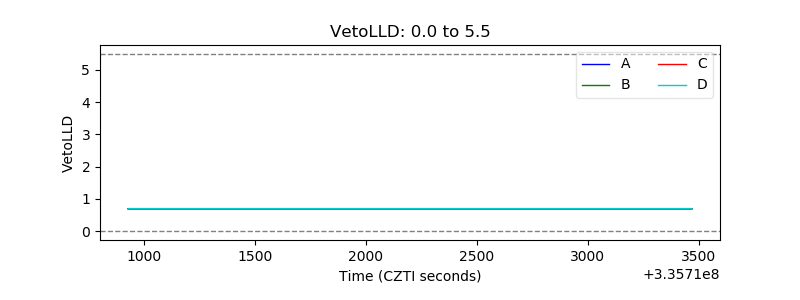 |
| Alpha Counter | 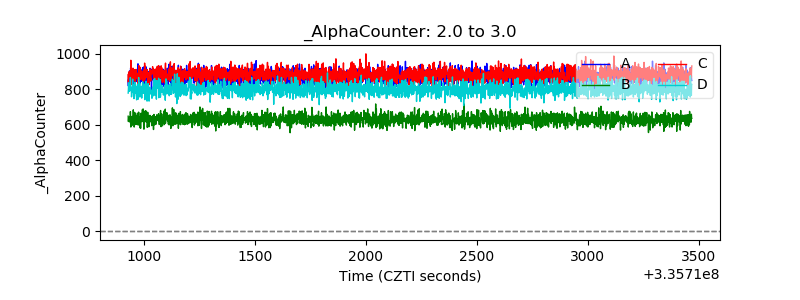 |
| _CPM_Rate | 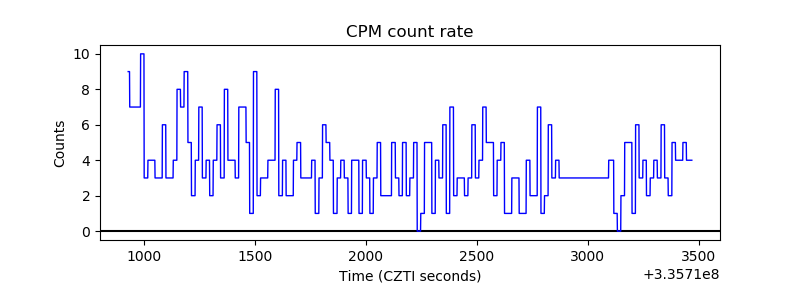 |
| CZT Counter | 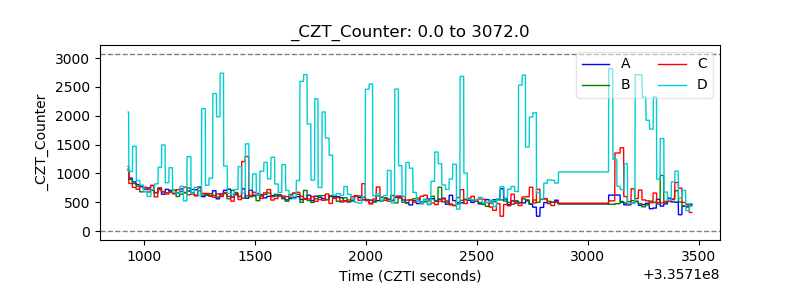 |
| +2.5 Volts monitor |  |
| +5 Volts monitor |  |
| _ROLL_ROT | 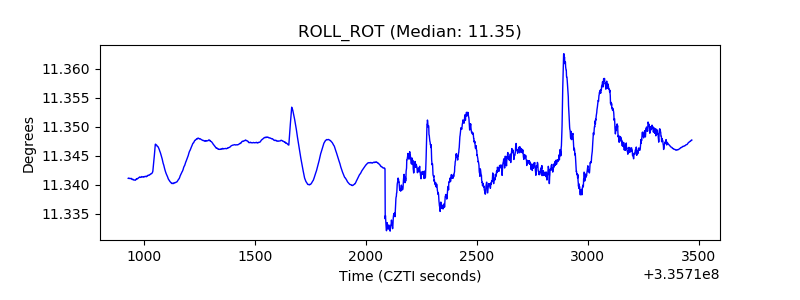 |
| _Roll_DEC | 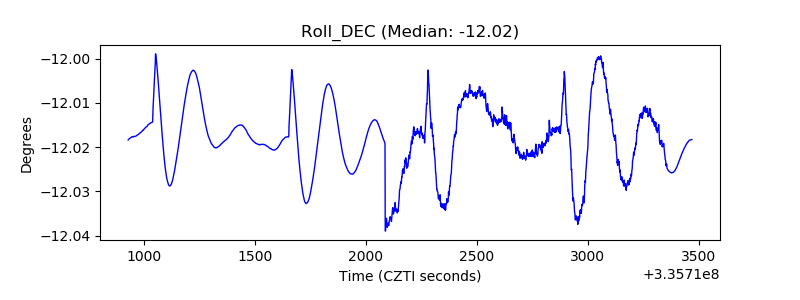 |
| _Roll_RA |  |
| Veto Counter | 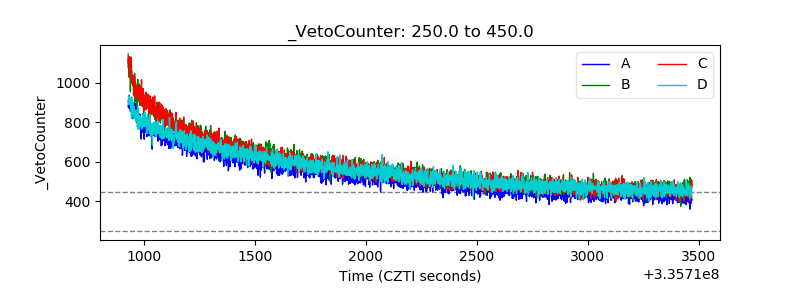 |