| Param | Original file | Final file |
|---|---|---|
| Filename | modeM0/AS1A09_038T05_9000003830cztM0_level2.fits | modeM0/AS1A09_038T05_9000003830cztM0_level2_quad_clean.evt |
| Size (bytes) | 72,048,960 | 45,152,640 |
| Size | 68.7 MB | 43.1 MB |
| Events in quadrant A | 473,036 | 248,435 |
| Events in quadrant B | 451,160 | 247,566 |
| Events in quadrant C | 439,112 | 220,688 |
| Events in quadrant D | 364,154 | 195,120 |
| Mode M9 | |||
|---|---|---|---|
| Quadrant | BADHDUFLAG | Total packets | Discarded packets |
| A | 0 | 20 | 0 |
| B | 0 | 20 | 0 |
| C | 0 | 20 | 0 |
| D | 0 | 20 | 0 |
| Mode SS | |||
|---|---|---|---|
| Quadrant | BADHDUFLAG | Total packets | Discarded packets |
| A | 0 | 134 | 0 |
| B | 0 | 134 | 0 |
| C | 0 | 134 | 0 |
| D | 0 | 134 | 0 |
| Mode M0 | |||
|---|---|---|---|
| Quadrant | BADHDUFLAG | Total packets | Discarded packets |
| A | 0 | 14083 | 0 |
| B | 0 | 14265 | 0 |
| C | 0 | 16058 | 0 |
| D | 0 | 23811 | 0 |
| Quadrant | Total seconds | Saturated seconds | Saturation percentage |
|---|---|---|---|
| A | 6513 | 123 | 1.888531% |
| B | 6513 | 144 | 2.210963% |
| C | 6513 | 354 | 5.435283% |
| D | 6513 | 928 | 14.248426% |
Noise dominated data is calculated using 1-second bins in cleaned event files. If a bin has >2000 counts, and if more than 50% of those come from <1% of pixels, then it is considered to be noise-dominated and hence unusable.
| Quadrant | # 1 sec bins | Bins with >0 counts | Bins with >2000 counts | High rate bins dominated by noise | Noise dominated (total time) | Noise dominated (detector-on time) | Marked lightcurve |
|---|---|---|---|---|---|---|---|
| A | 7792 | 6511 | 0 | 0 | 0.00% | 0.00% | 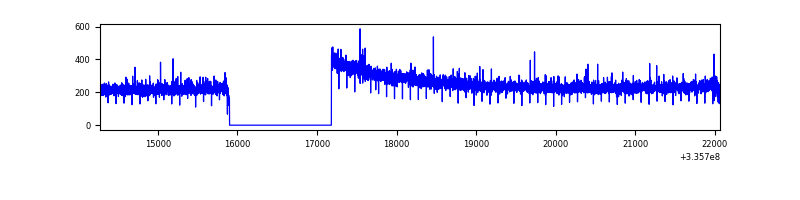 |
| B | 7792 | 6511 | 0 | 0 | 0.00% | 0.00% |  |
| C | 7792 | 6510 | 0 | 0 | 0.00% | 0.00% |  |
| D | 7792 | 6457 | 0 | 0 | 0.00% | 0.00% | 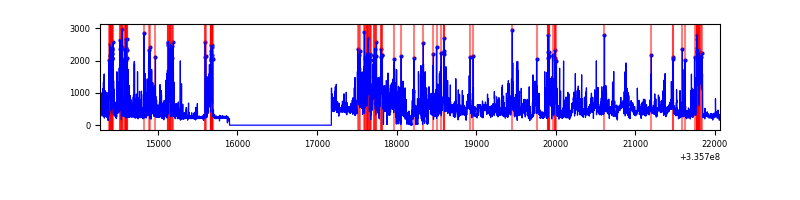 |
Top three noisy pixels from each quadrant. If the there are fewer than three noisy pixels in the level2.evt file, extra rows are filled as -1
| Pixel properties | Quadrant properties | ||||||
|---|---|---|---|---|---|---|---|
| Quadrant | DetID | PixID | Counts | Sigma | Mean | Median | Sigma |
| A | 0 | 29 | 386 | 8.64 | 123 | 118 | 31.0 |
| A | 7 | 110 | 364 | 7.93 | 123 | 118 | 31.0 |
| A | 9 | 19 | 357 | 7.71 | 123 | 118 | 31.0 |
| B | 2 | 9 | 361 | 9.89 | 119 | 116 | 24.8 |
| B | 5 | 128 | 303 | 7.55 | 119 | 116 | 24.8 |
| B | 3 | 80 | 297 | 7.3 | 119 | 116 | 24.8 |
| C | 1 | 81 | 351 | 7.95 | 116 | 110 | 30.3 |
| C | 1 | 80 | 339 | 7.55 | 116 | 110 | 30.3 |
| C | 12 | 241 | 312 | 6.66 | 116 | 110 | 30.3 |
| D | 4 | 246 | 298 | 7.07 | 103 | 96 | 28.6 |
| D | 7 | 3 | 283 | 6.55 | 103 | 96 | 28.6 |
| D | 10 | 113 | 277 | 6.34 | 103 | 96 | 28.6 |
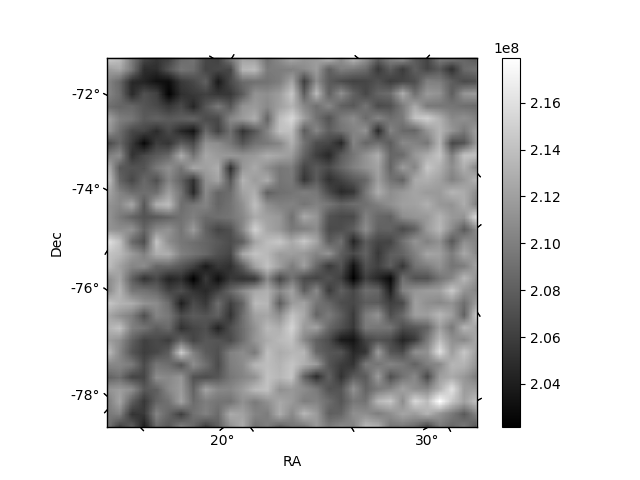
Histogram calculated using DETX and DETY for each event in the final _common_clean file
| Quadrant A | 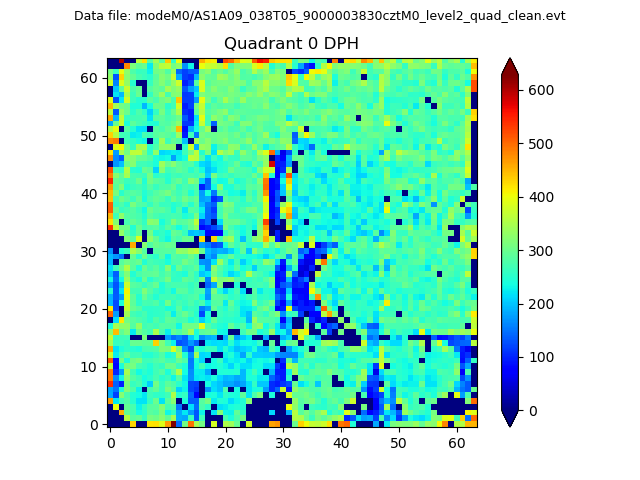 |
 |
Quadrant B |
|---|---|---|---|
| Quadrant D | 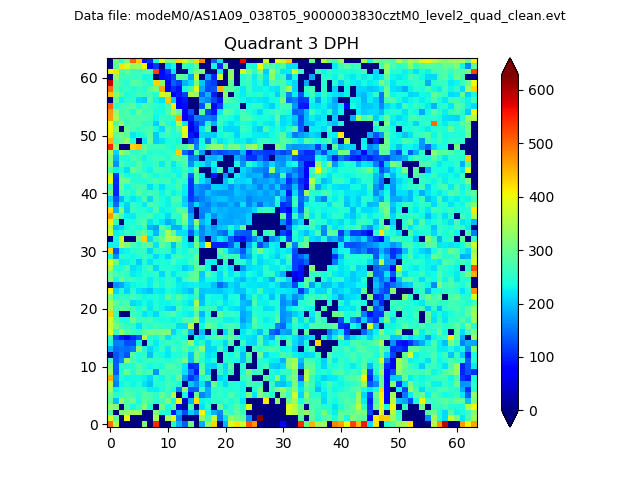 |
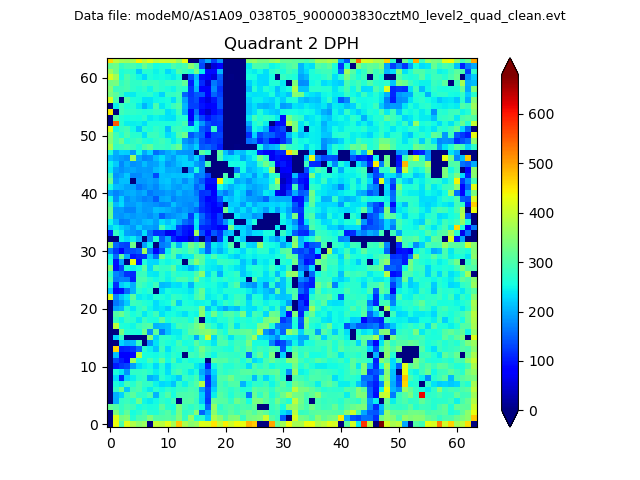 |
Quadrant C |
| Plot type | Count rate plots | Images |
|---|---|---|
| Comparison with Poisson distribution Blue bars denote a histogram of data divided into 1 sec bins. Red curve is a Poisson curve with rate = median count rate of data. |
 |
 |
| Quadrant-wise count rates Data is divided into 100 sec bins |
 |
|
| Module-wise count rates for Quadrant A Data is divided into 100 sec bins |
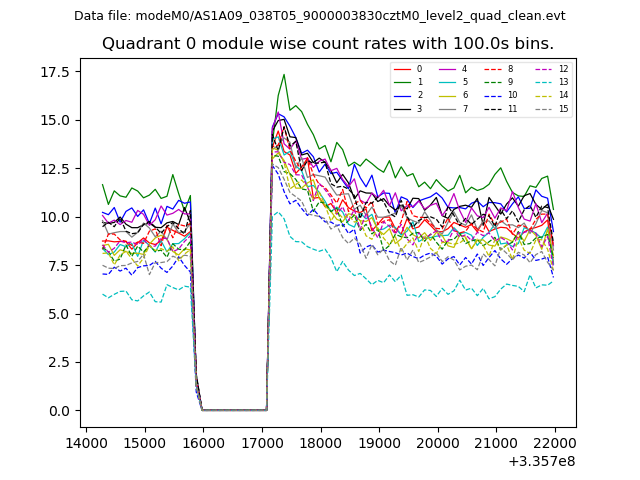 |
 |
| Module-wise count rates for Quadrant B Data is divided into 100 sec bins |
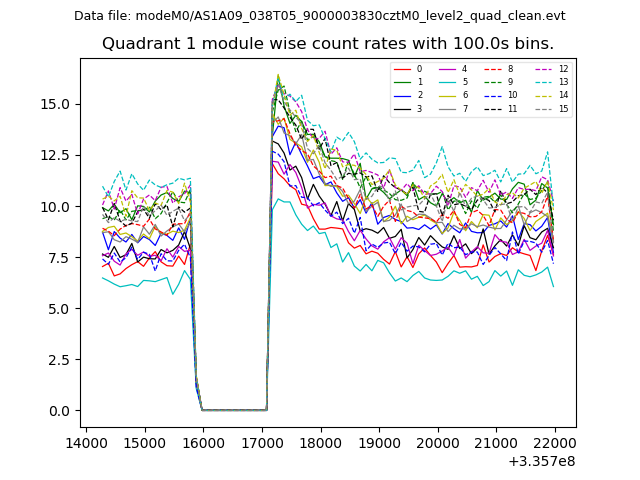 |
 |
| Module-wise count rates for Quadrant C Data is divided into 100 sec bins |
 |
 |
| Module-wise count rates for Quadrant D Data is divided into 100 sec bins |
 |
 |
| Parameter | Plot |
|---|---|
| CZT HV Monitor | 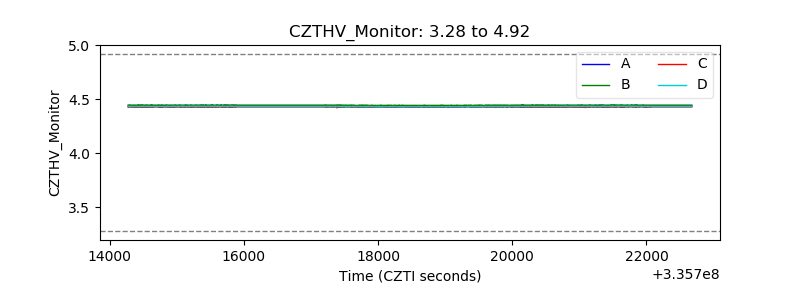 |
| D_VDD |  |
| Temperature 1 |  |
| Veto HV Monitor |  |
| Veto LLD | 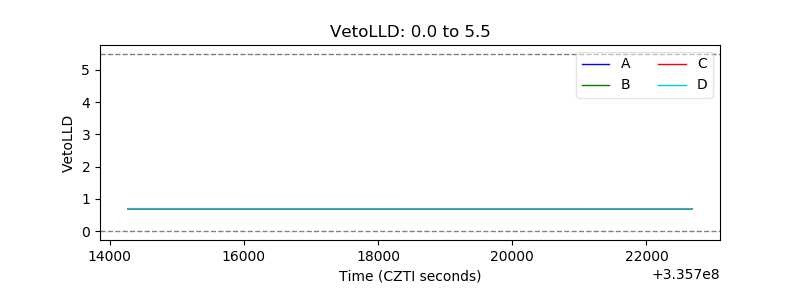 |
| Alpha Counter |  |
| _CPM_Rate | 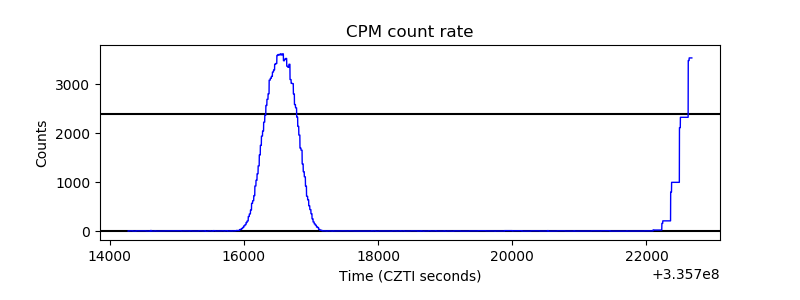 |
| CZT Counter |  |
| +2.5 Volts monitor |  |
| +5 Volts monitor | 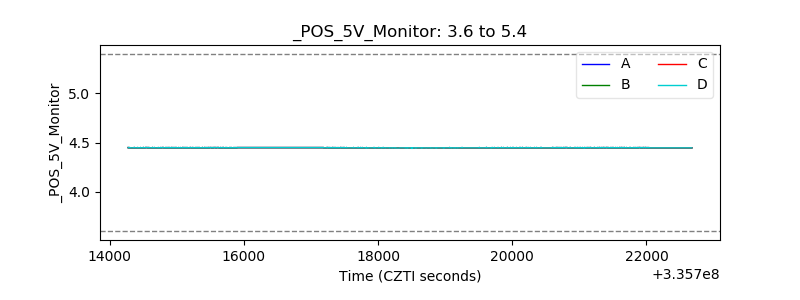 |
| _ROLL_ROT | 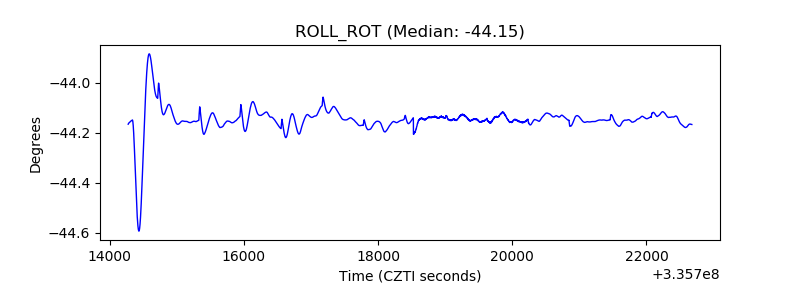 |
| _Roll_DEC |  |
| _Roll_RA |  |
| Veto Counter |  |