| Param | Original file | Final file |
|---|---|---|
| Filename | modeM0/AS1A09_038T05_9000003830_26487cztM0_level2.evt | modeM0/AS1A09_038T05_9000003830_26487cztM0_level2_quad_clean.evt |
| Size (bytes) | 306,794,880 | 68,950,080 |
| Size | 292.6 MB | 65.8 MB |
| Events in quadrant A | 1,662,390 | 496,660 |
| Events in quadrant B | 1,708,779 | 506,425 |
| Events in quadrant C | 2,147,366 | 464,603 |
| Events in quadrant D | 3,564,911 | 403,424 |
| Mode M9 | |||
|---|---|---|---|
| Quadrant | BADHDUFLAG | Total packets | Discarded packets |
| A | 0 | 13 | 0 |
| B | 0 | 13 | 0 |
| C | 0 | 13 | 0 |
| D | 0 | 13 | 0 |
| Mode M0 | |||
|---|---|---|---|
| Quadrant | BADHDUFLAG | Total packets | Discarded packets |
| A | 0 | 6976 | 0 |
| B | 0 | 7077 | 0 |
| C | 0 | 8408 | 0 |
| D | 0 | 12628 | 0 |
| Quadrant | Total seconds | Saturated seconds | Saturation percentage |
|---|---|---|---|
| A | 3037 | 60 | 1.975634% |
| B | 3037 | 77 | 2.535397% |
| C | 3037 | 257 | 8.462298% |
| D | 3037 | 746 | 24.563714% |
Noise dominated data is calculated using 1-second bins in cleaned event files. If a bin has >2000 counts, and if more than 50% of those come from <1% of pixels, then it is considered to be noise-dominated and hence unusable.
| Quadrant | # 1 sec bins | Bins with >0 counts | Bins with >2000 counts | High rate bins dominated by noise | Noise dominated (total time) | Noise dominated (detector-on time) | Marked lightcurve |
|---|---|---|---|---|---|---|---|
| A | 4317 | 3037 | 0 | 0 | 0.00% | 0.00% | 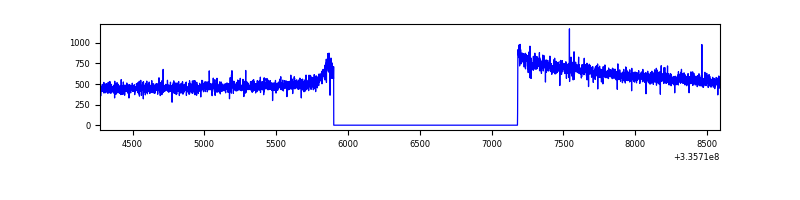 |
| B | 4317 | 3037 | 1 | 1 | 0.02% | 0.03% | 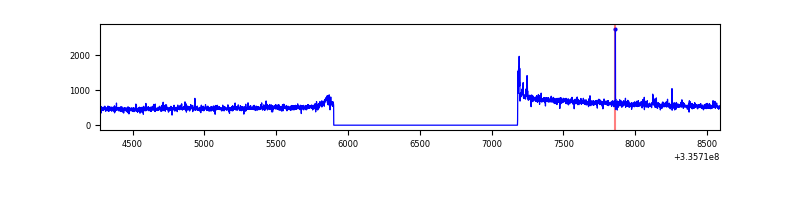 |
| C | 4317 | 3037 | 118 | 118 | 2.73% | 3.89% | 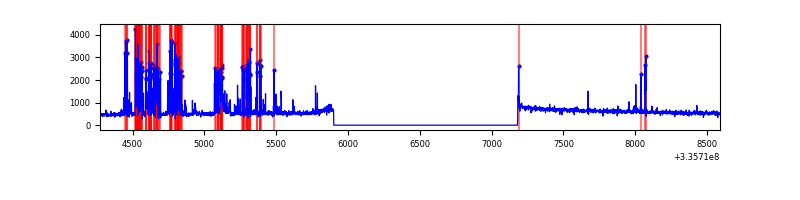 |
| D | 4317 | 3037 | 501 | 501 | 11.61% | 16.50% | 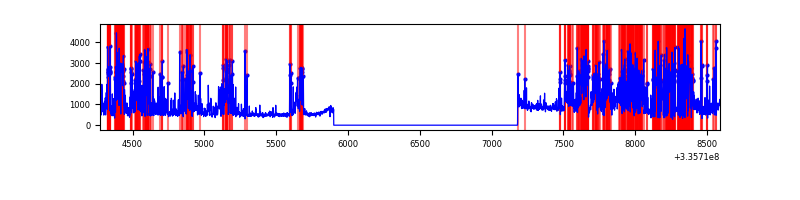 |
Top three noisy pixels from each quadrant. If the there are fewer than three noisy pixels in the level2.evt file, extra rows are filled as -1
| Pixel properties | Quadrant properties | ||||||
|---|---|---|---|---|---|---|---|
| Quadrant | DetID | PixID | Counts | Sigma | Mean | Median | Sigma |
| A | 13 | 254 | 4701 | 49.76 | 431 | 422 | 86.0 |
| A | 0 | 226 | 3786 | 39.12 | 431 | 422 | 86.0 |
| A | 3 | 137 | 3515 | 35.97 | 431 | 422 | 86.0 |
| B | 0 | 190 | 19279 | 235.63 | 427 | 419 | 80.0 |
| B | 0 | 229 | 10453 | 125.36 | 427 | 419 | 80.0 |
| B | 12 | 111 | 8955 | 106.65 | 427 | 419 | 80.0 |
| C | 4 | 254 | 492975 | 5326.4 | 401 | 403 | 92.5 |
| C | 14 | 238 | 66332 | 712.92 | 401 | 403 | 92.5 |
| C | 3 | 233 | 21158 | 224.43 | 401 | 403 | 92.5 |
| D | 1 | 52 | 1405881 | 16189.23 | 366 | 357 | 86.8 |
| D | 11 | 176 | 343853 | 3956.49 | 366 | 357 | 86.8 |
| D | 7 | 80 | 343302 | 3950.14 | 366 | 357 | 86.8 |
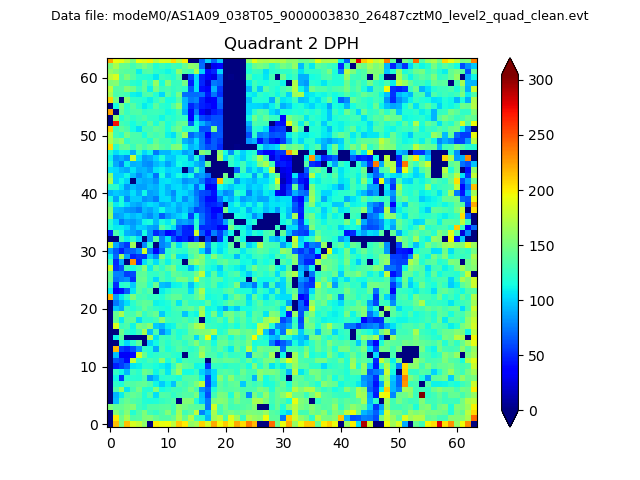
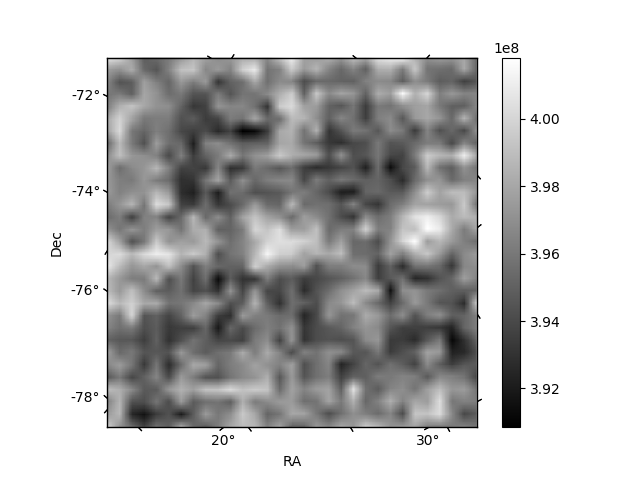
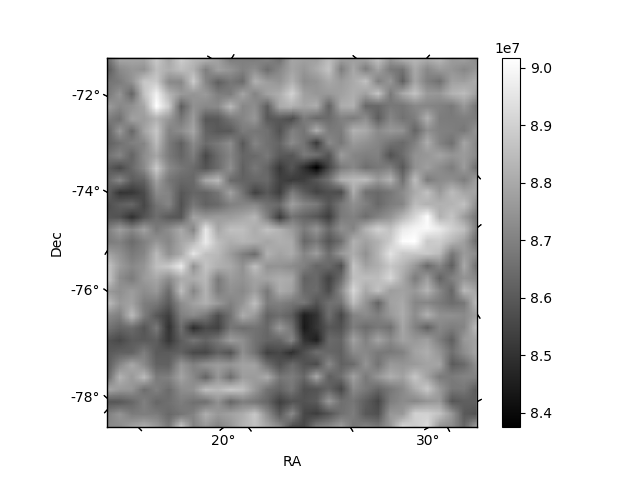
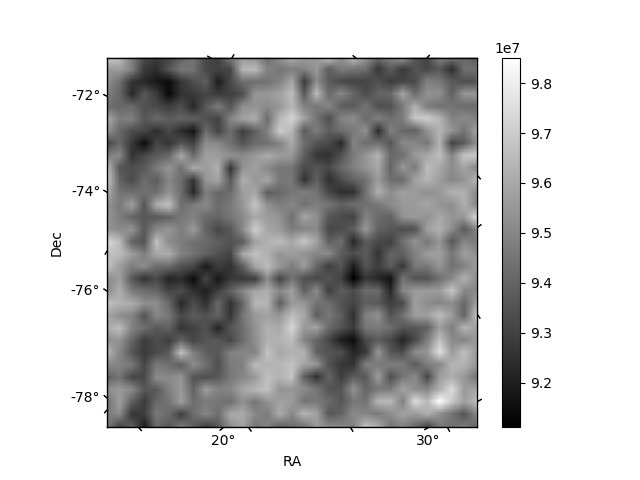
Histogram calculated using DETX and DETY for each event in the final _common_clean file
| Quadrant A | 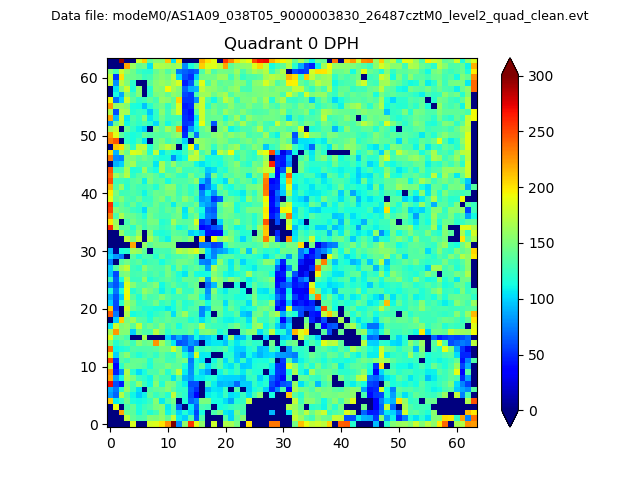 |
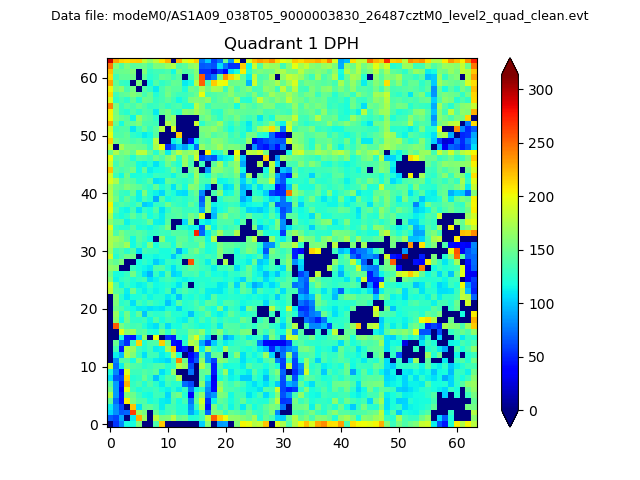 |
Quadrant B |
|---|---|---|---|
| Quadrant D | 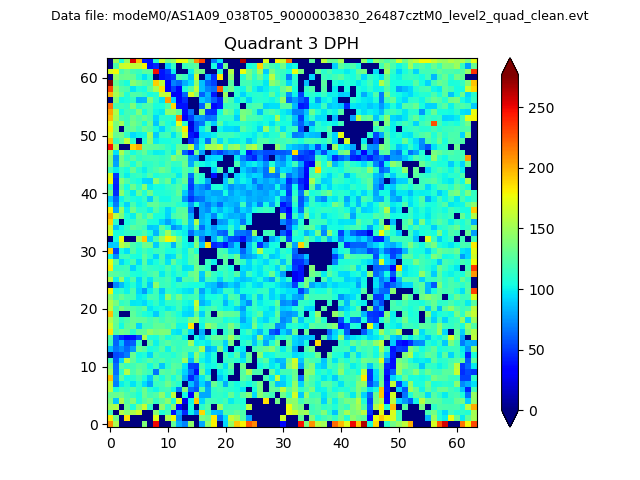 |
 |
Quadrant C |
| Plot type | Count rate plots | Images |
|---|---|---|
| Comparison with Poisson distribution Blue bars denote a histogram of data divided into 1 sec bins. Red curve is a Poisson curve with rate = median count rate of data. |
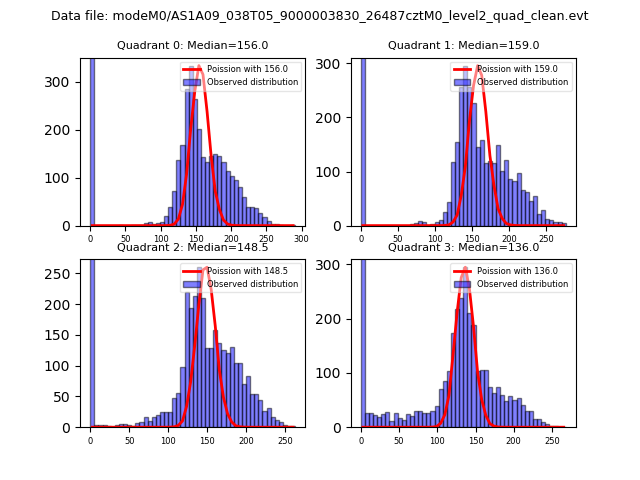 |
 |
| Quadrant-wise count rates Data is divided into 100 sec bins |
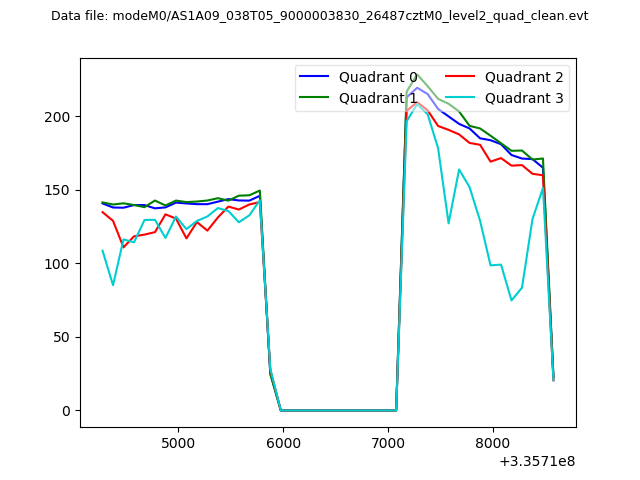 |
|
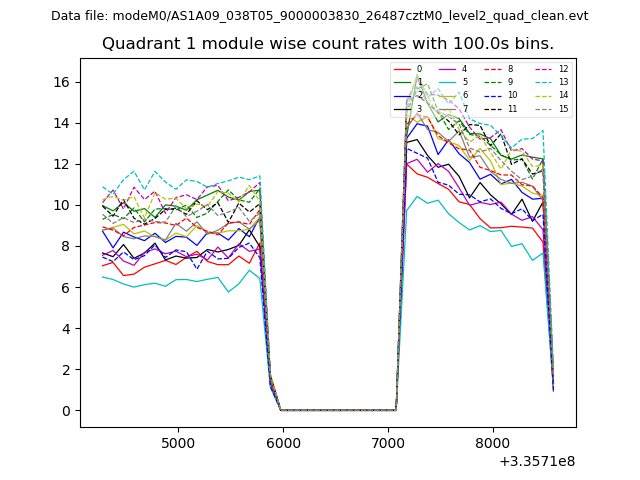
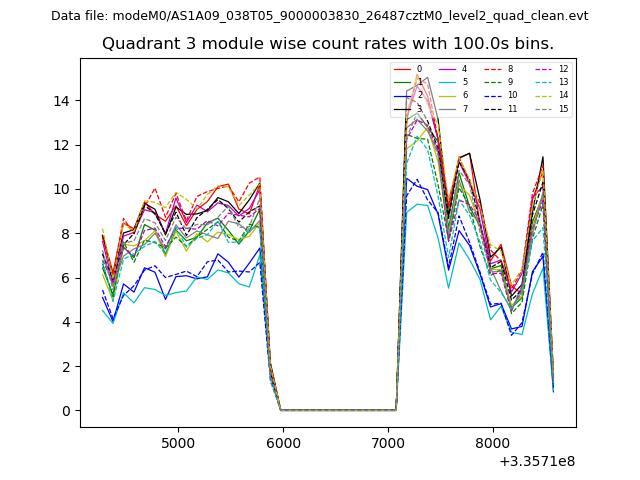
| Module-wise count rates for Quadrant A Data is divided into 100 sec bins |
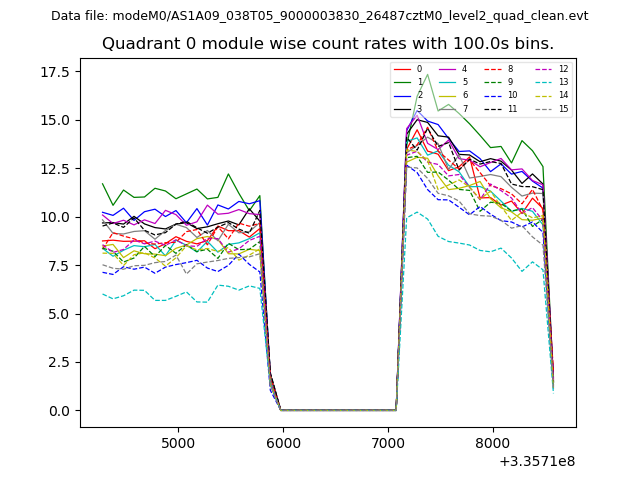 |
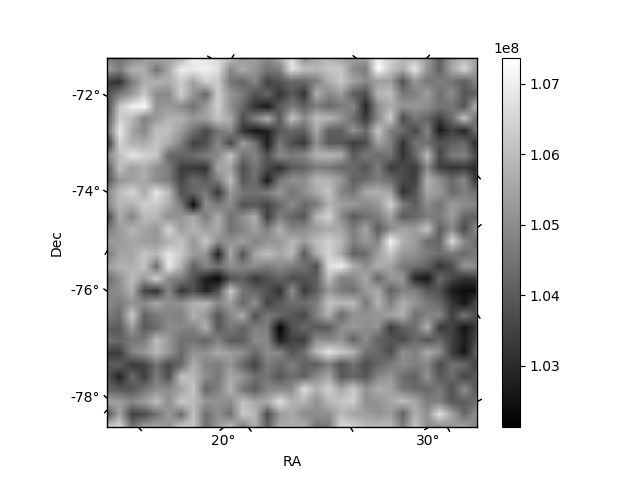 |
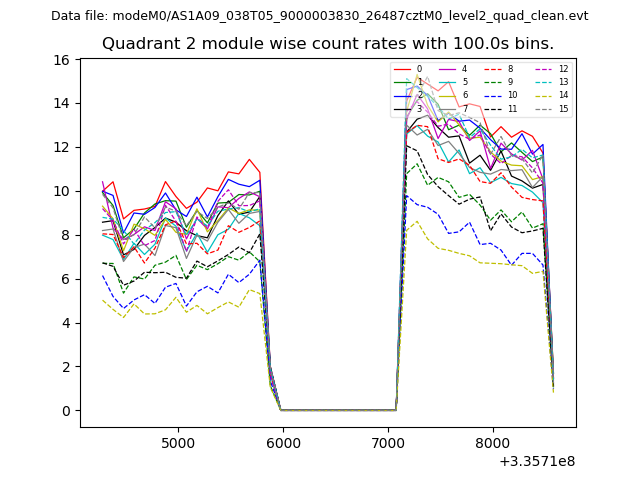
| Module-wise count rates for Quadrant B Data is divided into 100 sec bins |
 |
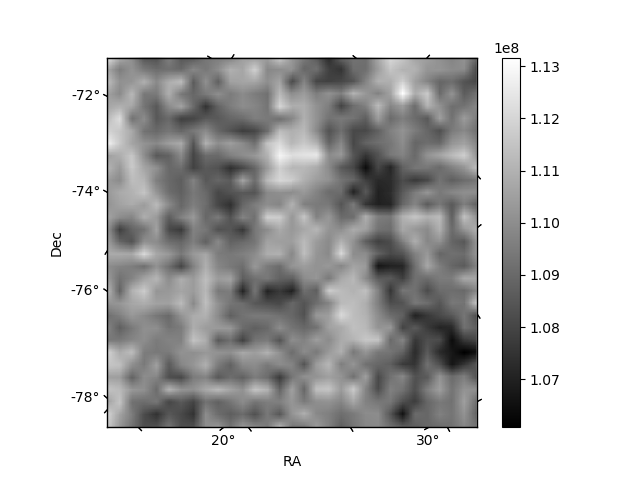 |
| Module-wise count rates for Quadrant C Data is divided into 100 sec bins |
 |
 |
| Module-wise count rates for Quadrant D Data is divided into 100 sec bins |
 |
 |
| Parameter | Plot |
|---|---|
| CZT HV Monitor | 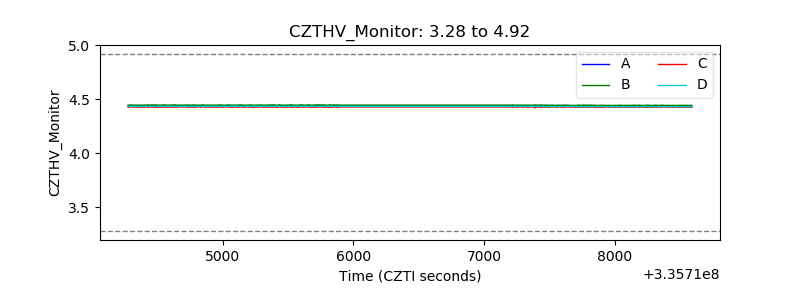 |
| D_VDD | 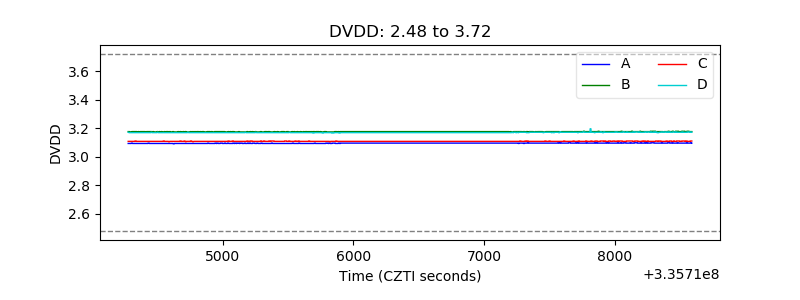 |
| Temperature 1 | 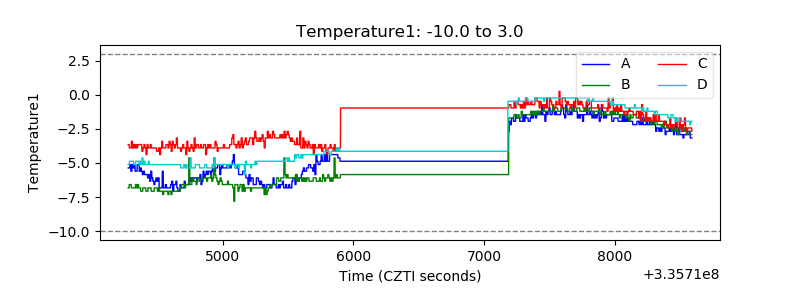 |
| Veto HV Monitor | 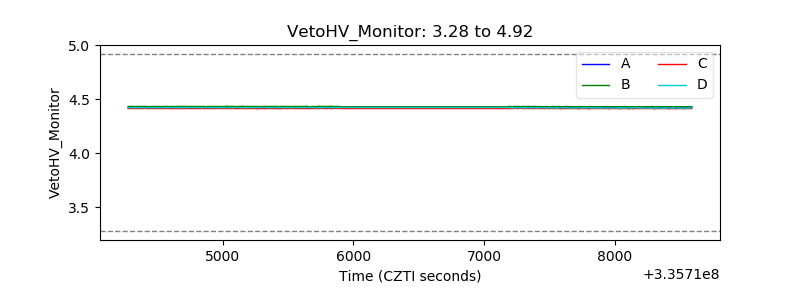 |
| Veto LLD | 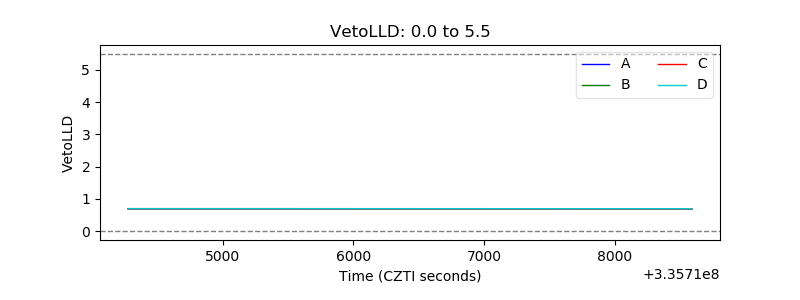 |
| Alpha Counter | 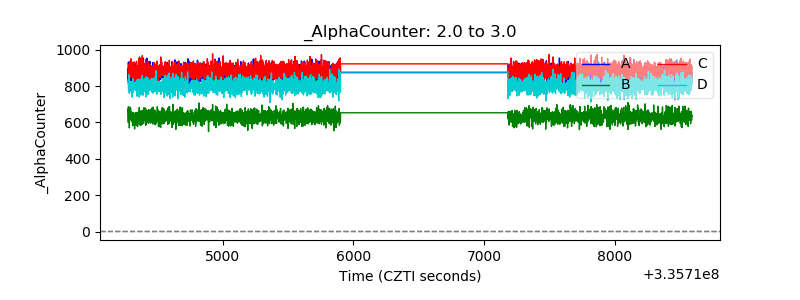 |
| _CPM_Rate | 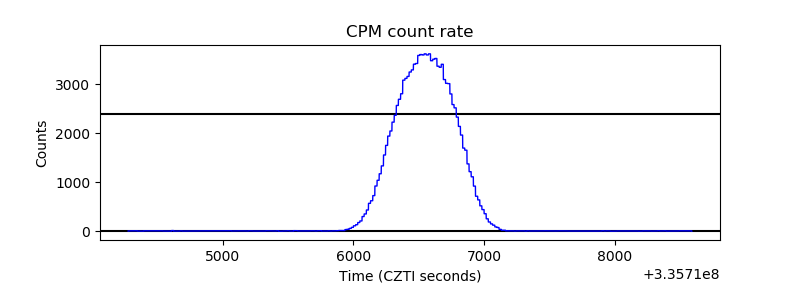 |
| CZT Counter | 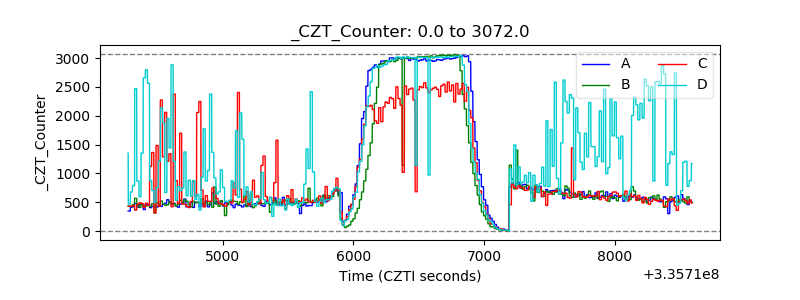 |
| +2.5 Volts monitor | 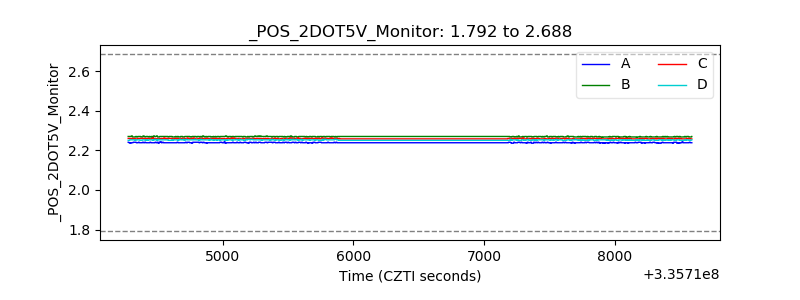 |
| +5 Volts monitor | 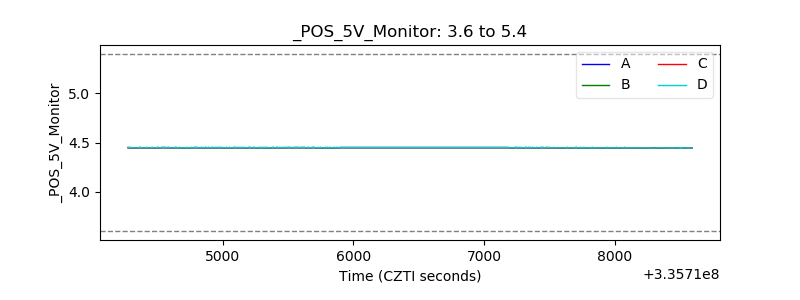 |
| _ROLL_ROT | 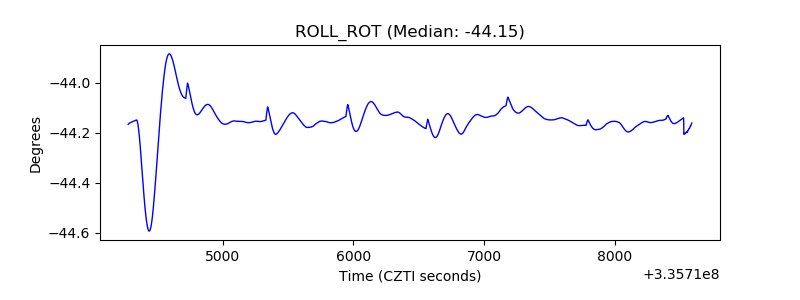 |
| _Roll_DEC | 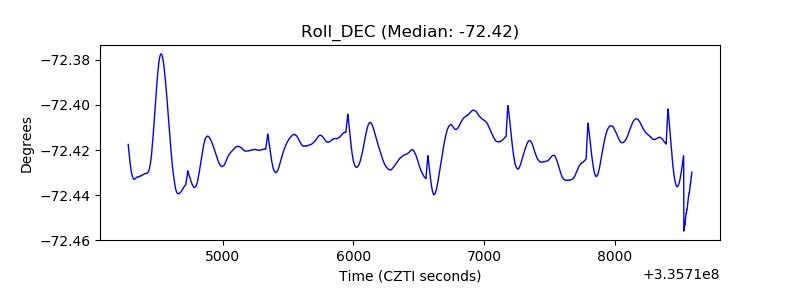 |
| _Roll_RA | 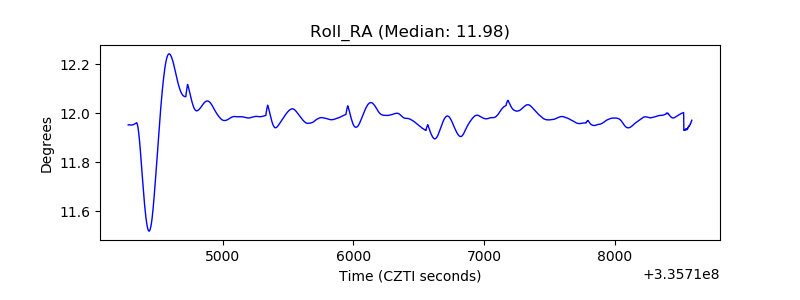 |
| Veto Counter | 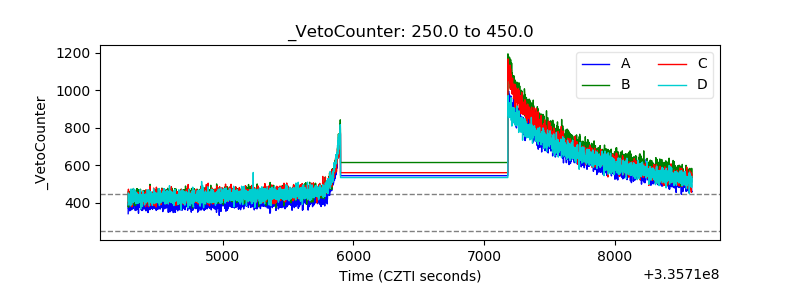 |