| Param | Original file | Final file |
|---|---|---|
| Filename | modeM0/AS1A09_038T05_9000003830_26488cztM0_level2.evt | modeM0/AS1A09_038T05_9000003830_26488cztM0_level2_quad_clean.evt |
| Size (bytes) | 414,555,840 | 105,808,320 |
| Size | 395.4 MB | 100.9 MB |
| Events in quadrant A | 2,422,803 | 752,484 |
| Events in quadrant B | 2,478,255 | 762,942 |
| Events in quadrant C | 2,614,762 | 712,995 |
| Events in quadrant D | 4,719,054 | 645,381 |
| Mode M9 | |||
|---|---|---|---|
| Quadrant | BADHDUFLAG | Total packets | Discarded packets |
| A | 0 | 7 | 0 |
| B | 0 | 7 | 0 |
| C | 0 | 7 | 0 |
| D | 0 | 7 | 0 |
| Mode M0 | |||
|---|---|---|---|
| Quadrant | BADHDUFLAG | Total packets | Discarded packets |
| A | 0 | 10207 | 0 |
| B | 0 | 10334 | 0 |
| C | 0 | 10774 | 0 |
| D | 0 | 17371 | 0 |
| Quadrant | Total seconds | Saturated seconds | Saturation percentage |
|---|---|---|---|
| A | 4708 | 68 | 1.444350% |
| B | 4709 | 73 | 1.550223% |
| C | 4709 | 118 | 2.505840% |
| D | 4709 | 668 | 14.185602% |
Noise dominated data is calculated using 1-second bins in cleaned event files. If a bin has >2000 counts, and if more than 50% of those come from <1% of pixels, then it is considered to be noise-dominated and hence unusable.
| Quadrant | # 1 sec bins | Bins with >0 counts | Bins with >2000 counts | High rate bins dominated by noise | Noise dominated (total time) | Noise dominated (detector-on time) | Marked lightcurve |
|---|---|---|---|---|---|---|---|
| A | 4707 | 4707 | 0 | 0 | 0.00% | 0.00% | 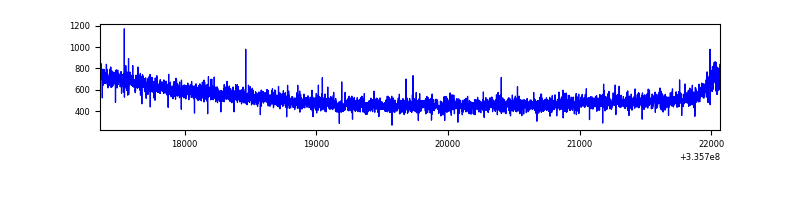 |
| B | 4708 | 4708 | 1 | 1 | 0.02% | 0.02% | 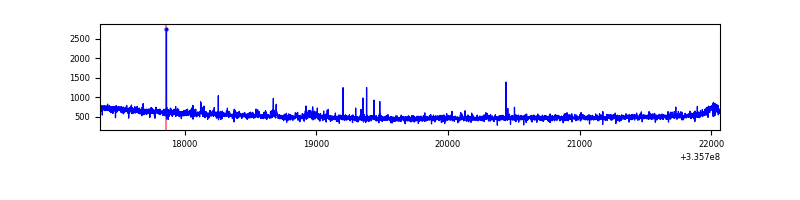 |
| C | 4708 | 4708 | 22 | 22 | 0.47% | 0.47% | 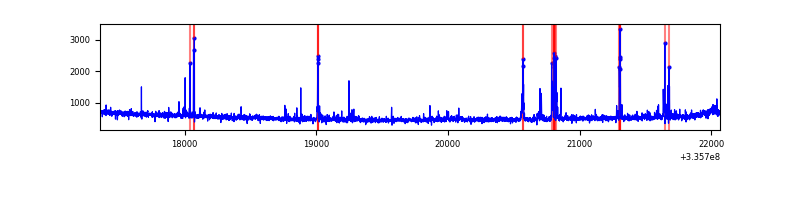 |
| D | 4708 | 4708 | 452 | 452 | 9.60% | 9.60% | 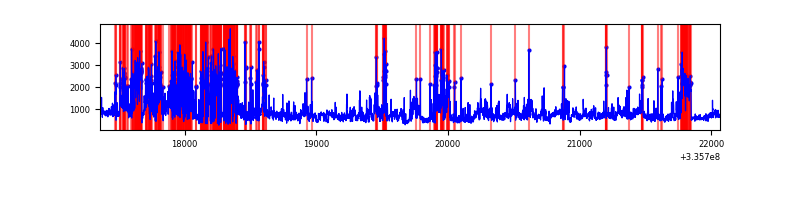 |
Top three noisy pixels from each quadrant. If the there are fewer than three noisy pixels in the level2.evt file, extra rows are filled as -1
| Pixel properties | Quadrant properties | ||||||
|---|---|---|---|---|---|---|---|
| Quadrant | DetID | PixID | Counts | Sigma | Mean | Median | Sigma |
| A | 13 | 254 | 7249 | 53.43 | 628 | 617 | 124.1 |
| A | 0 | 226 | 5323 | 37.91 | 628 | 617 | 124.1 |
| A | 3 | 137 | 5100 | 36.12 | 628 | 617 | 124.1 |
| B | 12 | 111 | 12909 | 107.26 | 624 | 611 | 114.7 |
| B | 11 | 111 | 11406 | 94.16 | 624 | 611 | 114.7 |
| B | 15 | 32 | 10334 | 84.81 | 624 | 611 | 114.7 |
| C | 4 | 254 | 161719 | 1190.83 | 593 | 598 | 135.3 |
| C | 14 | 238 | 98406 | 722.89 | 593 | 598 | 135.3 |
| C | 3 | 233 | 37900 | 275.7 | 593 | 598 | 135.3 |
| D | 1 | 52 | 1817232 | 13813.0 | 556 | 543 | 131.5 |
| D | 7 | 80 | 528956 | 4017.73 | 556 | 543 | 131.5 |
| D | 11 | 176 | 196818 | 1492.36 | 556 | 543 | 131.5 |
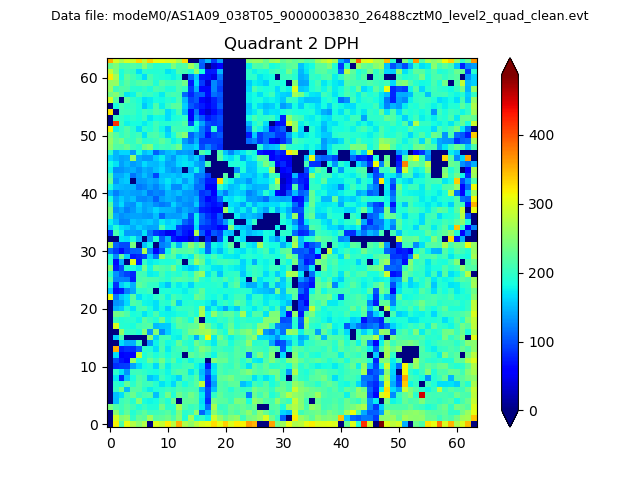
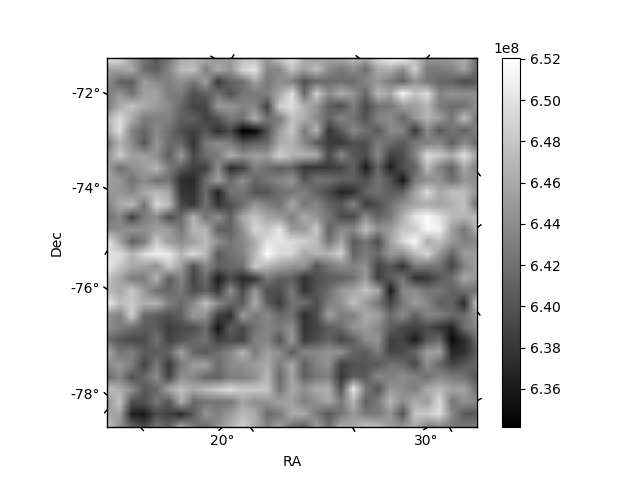
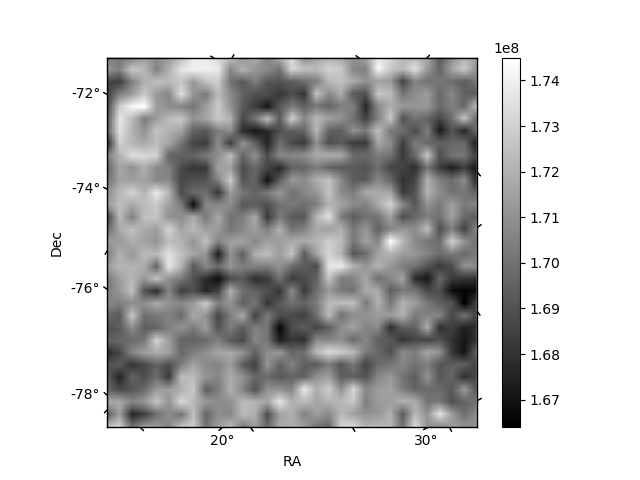
Histogram calculated using DETX and DETY for each event in the final _common_clean file
| Quadrant A | 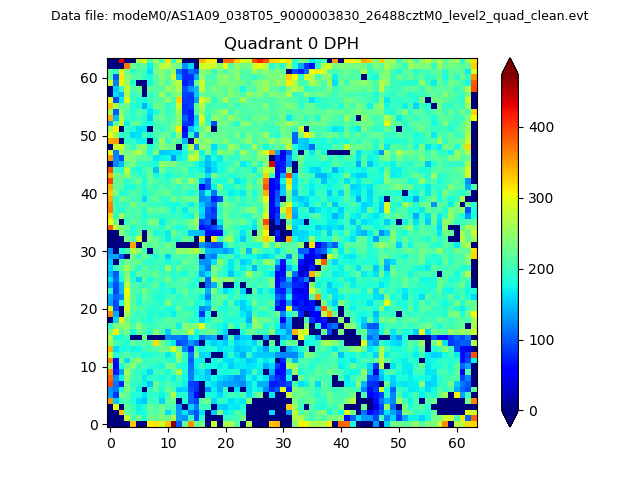 |
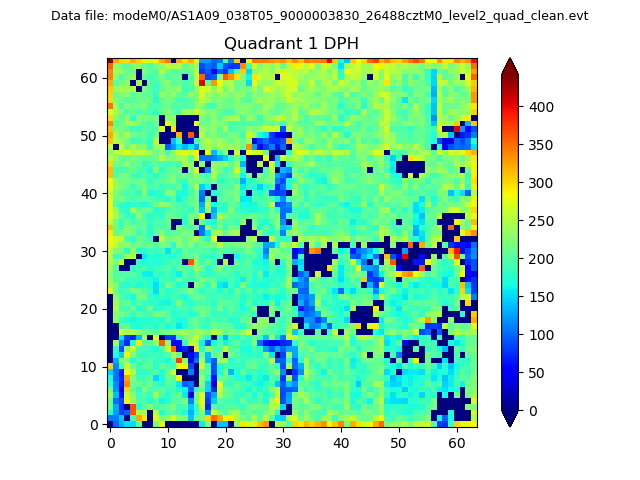 |
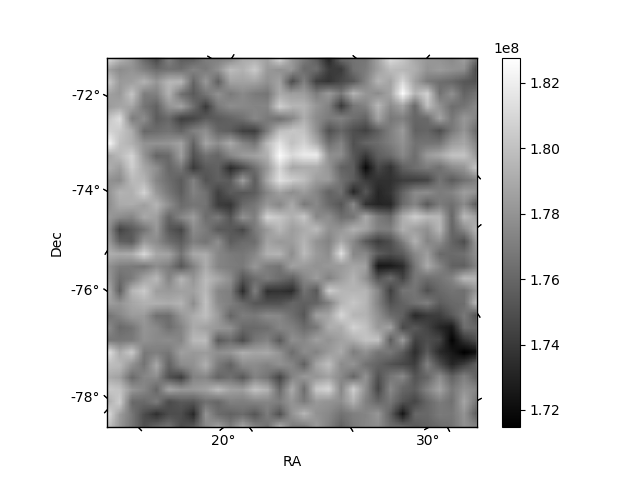
Quadrant B |
|---|---|---|---|
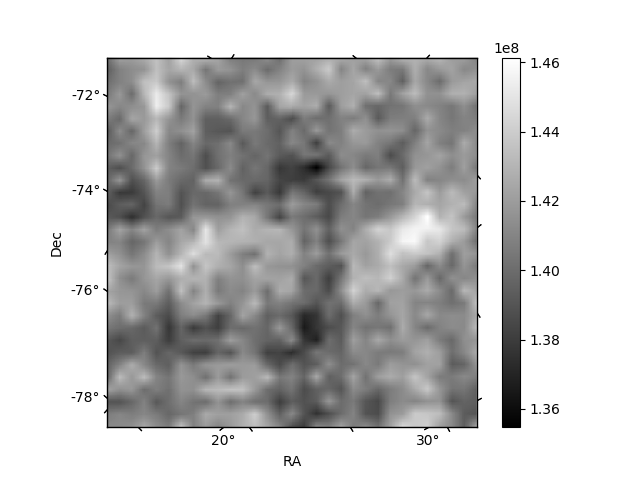
| Quadrant D | 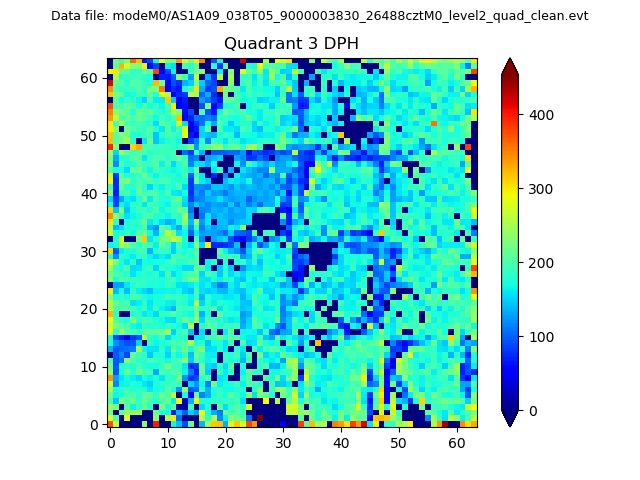 |
 |
Quadrant C |
| Plot type | Count rate plots | Images |
|---|---|---|
| Comparison with Poisson distribution Blue bars denote a histogram of data divided into 1 sec bins. Red curve is a Poisson curve with rate = median count rate of data. |
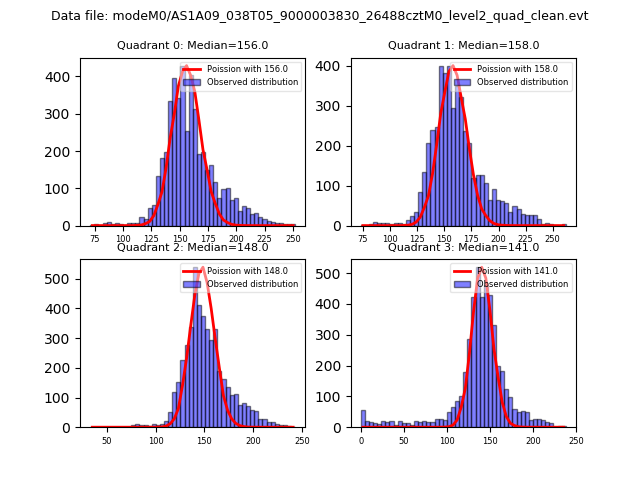 |
 |
| Quadrant-wise count rates Data is divided into 100 sec bins |
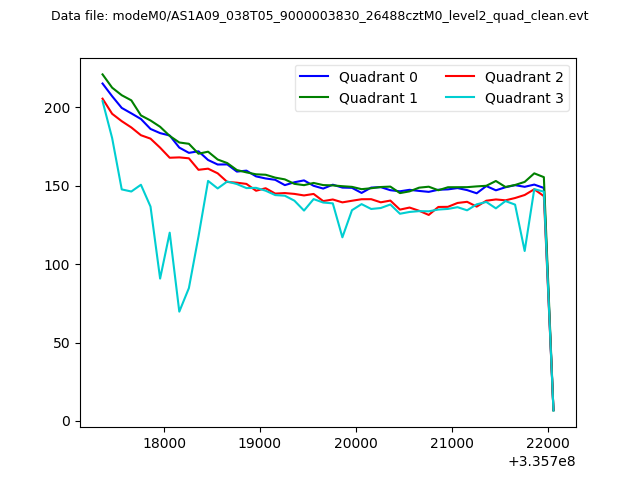 |
|
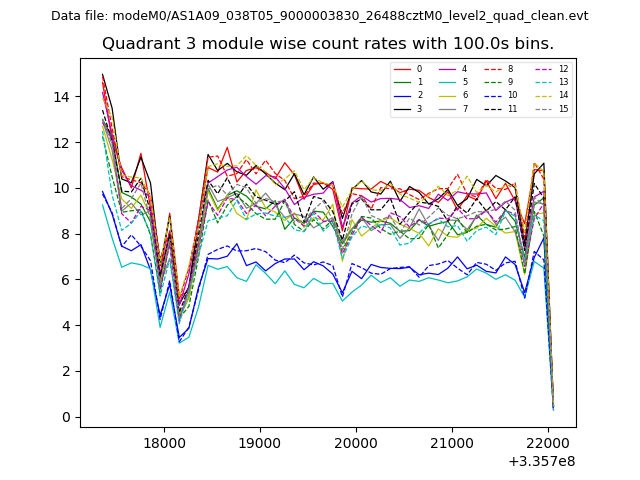
| Module-wise count rates for Quadrant A Data is divided into 100 sec bins |
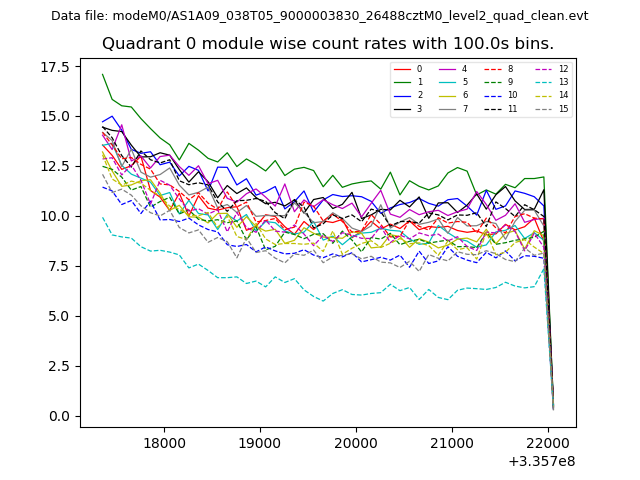 |
 |
| Module-wise count rates for Quadrant B Data is divided into 100 sec bins |
 |
 |
| Module-wise count rates for Quadrant C Data is divided into 100 sec bins |
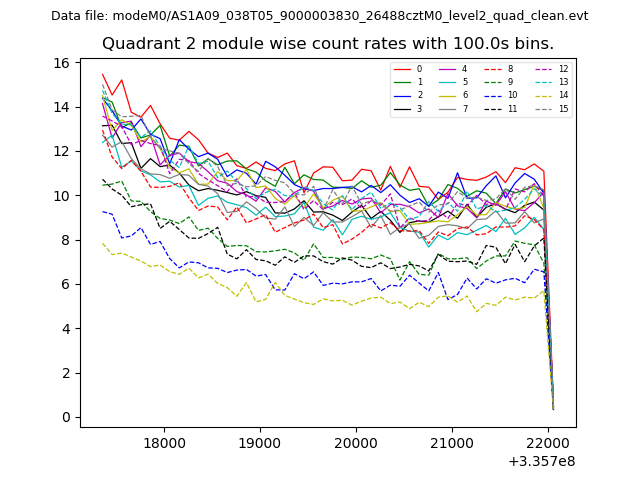 |
 |
| Module-wise count rates for Quadrant D Data is divided into 100 sec bins |
 |
 |
| Parameter | Plot |
|---|---|
| CZT HV Monitor |  |
| D_VDD | 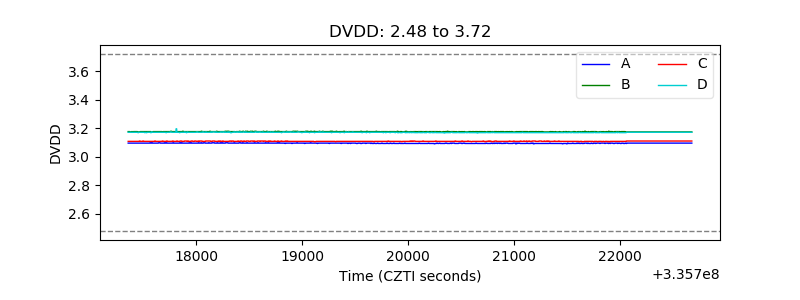 |
| Temperature 1 | 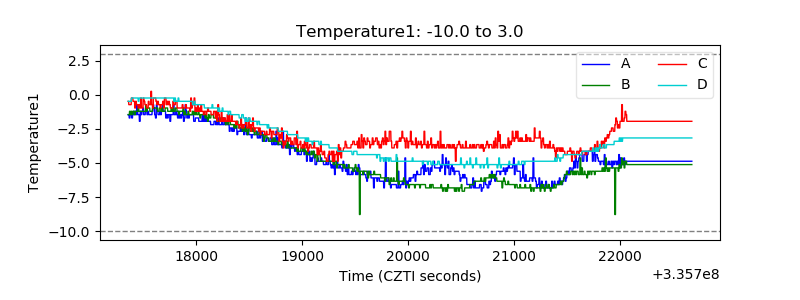 |
| Veto HV Monitor | 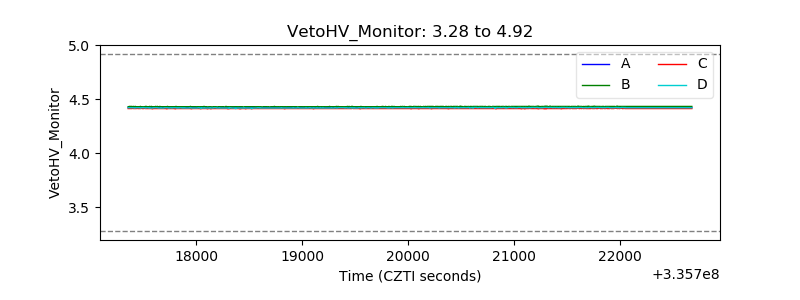 |
| Veto LLD | 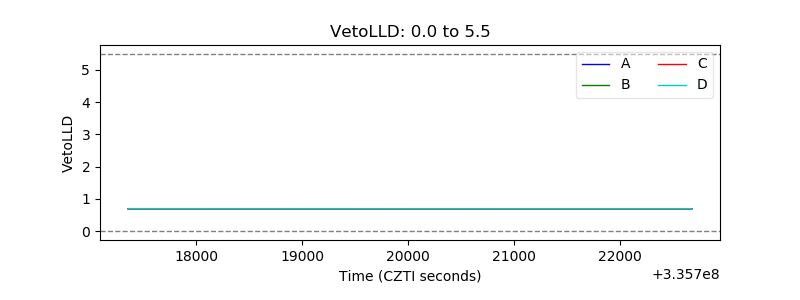 |
| Alpha Counter | 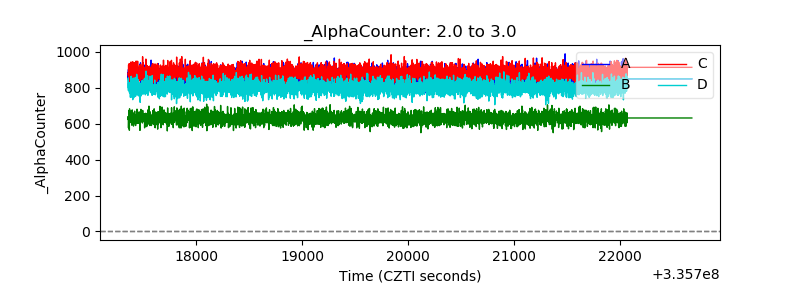 |
| _CPM_Rate |  |
| CZT Counter | 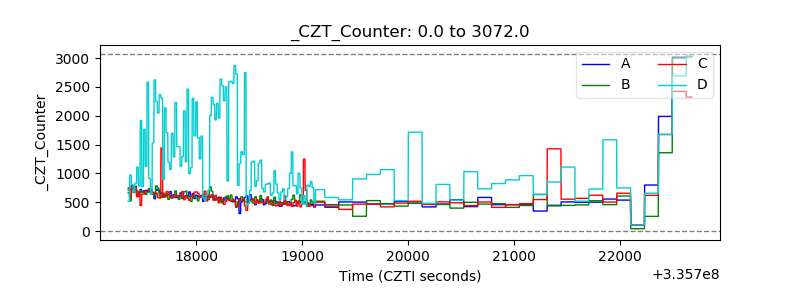 |
| +2.5 Volts monitor |  |
| +5 Volts monitor |  |
| _ROLL_ROT | 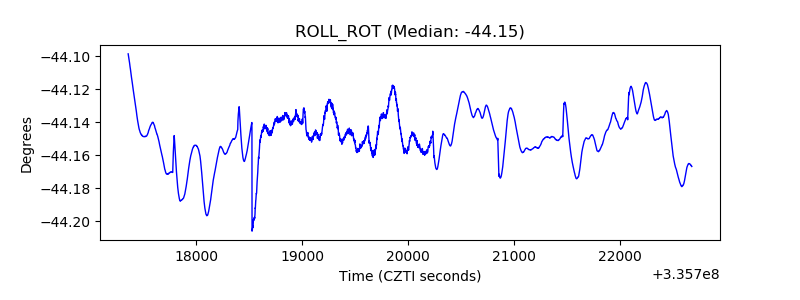 |
| _Roll_DEC | 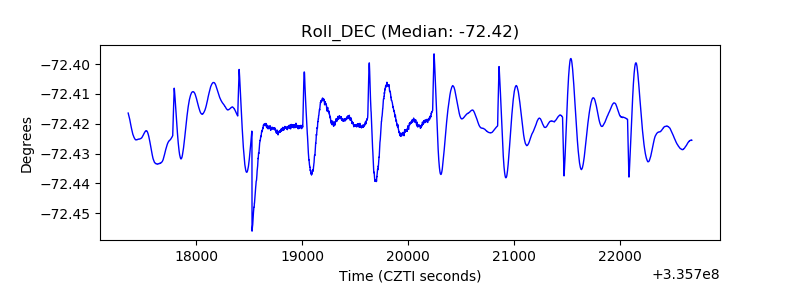 |
| _Roll_RA | 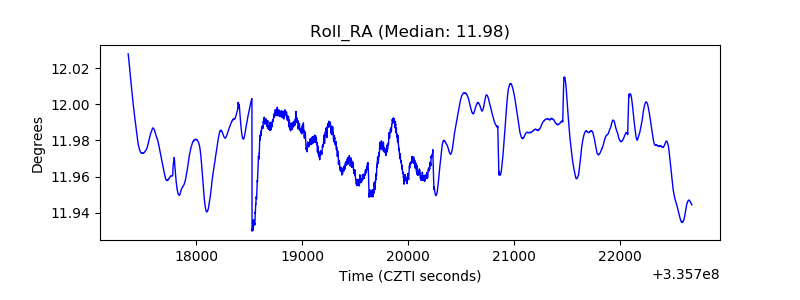 |
| Veto Counter | 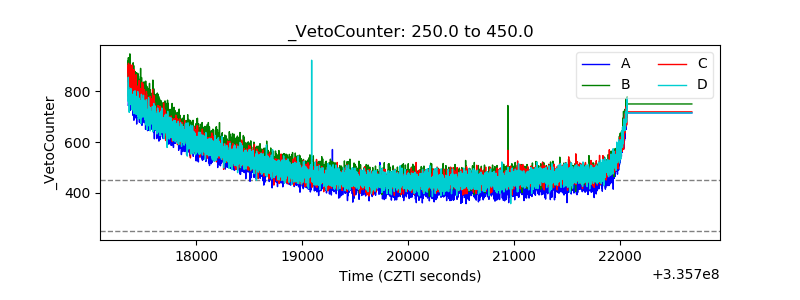 |