| Param | Original file | Final file |
|---|---|---|
| Filename | modeM0/AS1A09_038T06_9000003832cztM0_level2.fits | modeM0/AS1A09_038T06_9000003832cztM0_level2_quad_clean.evt |
| Size (bytes) | 246,070,080 | 240,681,600 |
| Size | 234.7 MB | 229.5 MB |
| Events in quadrant A | 1,597,959 | 1,536,603 |
| Events in quadrant B | 1,538,176 | 1,556,744 |
| Events in quadrant C | 1,535,746 | 1,462,548 |
| Events in quadrant D | 1,119,916 | 1,074,156 |
| Mode SS | |||
|---|---|---|---|
| Quadrant | BADHDUFLAG | Total packets | Discarded packets |
| A | 0 | 500 | 0 |
| B | 0 | 502 | 0 |
| C | 0 | 502 | 0 |
| D | 0 | 494 | 0 |
| Mode M0 | |||
|---|---|---|---|
| Quadrant | BADHDUFLAG | Total packets | Discarded packets |
| A | 0 | 53720 | 0 |
| B | 0 | 53118 | 0 |
| C | 0 | 52520 | 0 |
| D | 0 | 102597 | 0 |
| Mode M9 | |||
|---|---|---|---|
| Quadrant | BADHDUFLAG | Total packets | Discarded packets |
| A | 0 | 56 | 0 |
| B | 0 | 56 | 0 |
| C | 0 | 55 | 0 |
| D | 0 | 56 | 0 |
| Quadrant | Total seconds | Saturated seconds | Saturation percentage |
|---|---|---|---|
| A | 24123 | 182 | 0.754467% |
| B | 24242 | 287 | 1.183896% |
| C | 24221 | 365 | 1.506957% |
| D | 23660 | 5822 | 24.606932% |
Noise dominated data is calculated using 1-second bins in cleaned event files. If a bin has >2000 counts, and if more than 50% of those come from <1% of pixels, then it is considered to be noise-dominated and hence unusable.
| Quadrant | # 1 sec bins | Bins with >0 counts | Bins with >2000 counts | High rate bins dominated by noise | Noise dominated (total time) | Noise dominated (detector-on time) | Marked lightcurve |
|---|---|---|---|---|---|---|---|
| A | 23853 | 20225 | 0 | 0 | 0.00% | 0.00% |  |
| B | 23853 | 20240 | 0 | 0 | 0.00% | 0.00% |  |
| C | 23853 | 20249 | 0 | 0 | 0.00% | 0.00% |  |
| D | 23853 | 19270 | 0 | 0 | 0.00% | 0.00% |  |
Top three noisy pixels from each quadrant. If the there are fewer than three noisy pixels in the level2.evt file, extra rows are filled as -1
| Pixel properties | Quadrant properties | ||||||
|---|---|---|---|---|---|---|---|
| Quadrant | DetID | PixID | Counts | Sigma | Mean | Median | Sigma |
| A | 0 | 29 | 1350 | 9.28 | 416 | 396 | 102.8 |
| A | 7 | 110 | 1329 | 9.08 | 416 | 396 | 102.8 |
| A | 0 | 30 | 1228 | 8.1 | 416 | 396 | 102.8 |
| B | 2 | 9 | 1193 | 10.13 | 407 | 393 | 79.0 |
| B | 5 | 255 | 1039 | 8.18 | 407 | 393 | 79.0 |
| B | 2 | 8 | 1001 | 7.7 | 407 | 393 | 79.0 |
| C | 1 | 81 | 1201 | 7.9 | 406 | 385 | 103.4 |
| C | 1 | 80 | 1171 | 7.61 | 406 | 385 | 103.4 |
| C | 12 | 241 | 1090 | 6.82 | 406 | 385 | 103.4 |
| D | 15 | 46 | 837 | 6.22 | 320 | 293 | 87.4 |
| D | 10 | 189 | 817 | 5.99 | 320 | 293 | 87.4 |
| D | 3 | 14 | 806 | 5.86 | 320 | 293 | 87.4 |
Histogram calculated using DETX and DETY for each event in the final _common_clean file
| Quadrant A | 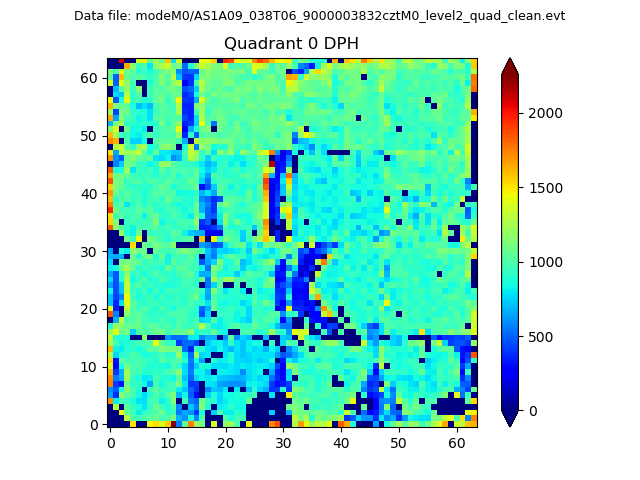 |
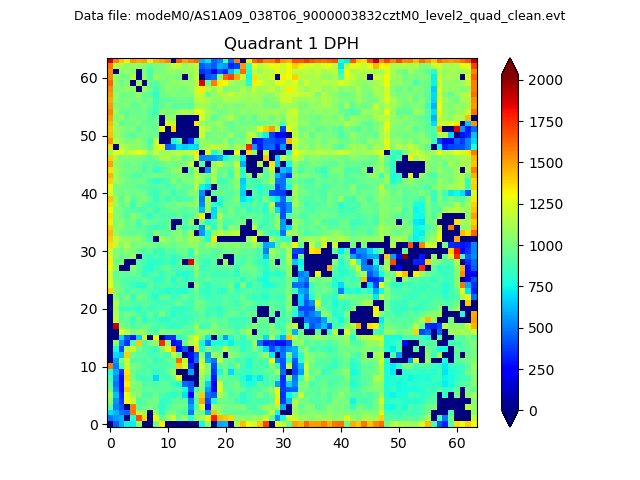 |
Quadrant B |
|---|---|---|---|
| Quadrant D |  |
 |
Quadrant C |
| Plot type | Count rate plots | Images |
|---|---|---|
| Comparison with Poisson distribution Blue bars denote a histogram of data divided into 1 sec bins. Red curve is a Poisson curve with rate = median count rate of data. |
 |
 |
| Quadrant-wise count rates Data is divided into 100 sec bins |
 |
|
| Module-wise count rates for Quadrant A Data is divided into 100 sec bins |
 |
 |
| Module-wise count rates for Quadrant B Data is divided into 100 sec bins |
 |
 |
| Module-wise count rates for Quadrant C Data is divided into 100 sec bins |
 |
 |
| Module-wise count rates for Quadrant D Data is divided into 100 sec bins |
 |
 |
| Parameter | Plot |
|---|---|
| CZT HV Monitor |  |
| D_VDD | 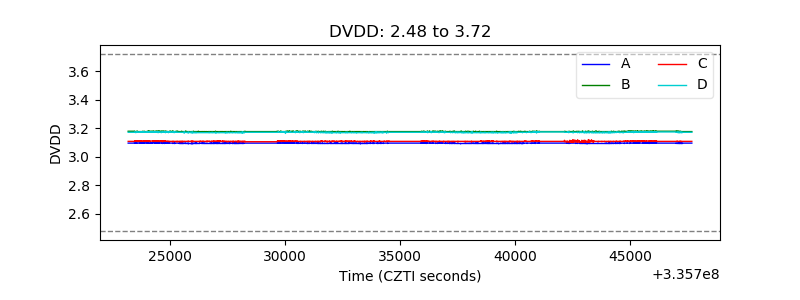 |
| Temperature 1 |  |
| Veto HV Monitor |  |
| Veto LLD |  |
| Alpha Counter |  |
| _CPM_Rate |  |
| CZT Counter |  |
| +2.5 Volts monitor |  |
| +5 Volts monitor |  |
| _ROLL_ROT |  |
| _Roll_DEC |  |
| _Roll_RA |  |
| Veto Counter |  |