| Param | Original file | Final file |
|---|---|---|
| Filename | modeM0/AS1A09_038T06_9000003832_26488cztM0_level2.evt | modeM0/AS1A09_038T06_9000003832_26488cztM0_level2_quad_clean.evt |
| Size (bytes) | 190,100,160 | 35,645,760 |
| Size | 181.3 MB | 34.0 MB |
| Events in quadrant A | 867,545 | 265,985 |
| Events in quadrant B | 879,677 | 273,099 |
| Events in quadrant C | 923,877 | 252,858 |
| Events in quadrant D | 2,987,834 | 181,549 |
| Mode M0 | |||
|---|---|---|---|
| Quadrant | BADHDUFLAG | Total packets | Discarded packets |
| A | 0 | 3561 | 0 |
| B | 0 | 3601 | 0 |
| C | 0 | 3744 | 0 |
| D | 0 | 9845 | 0 |
| Mode M9 | |||
|---|---|---|---|
| Quadrant | BADHDUFLAG | Total packets | Discarded packets |
| A | 0 | 3 | 0 |
| B | 0 | 3 | 0 |
| C | 0 | 3 | 0 |
| D | 0 | 3 | 0 |
| Quadrant | Total seconds | Saturated seconds | Saturation percentage |
|---|---|---|---|
| A | 1413 | 7 | 0.495400% |
| B | 1413 | 11 | 0.778485% |
| C | 1413 | 31 | 2.193914% |
| D | 1413 | 993 | 70.276008% |
Noise dominated data is calculated using 1-second bins in cleaned event files. If a bin has >2000 counts, and if more than 50% of those come from <1% of pixels, then it is considered to be noise-dominated and hence unusable.
| Quadrant | # 1 sec bins | Bins with >0 counts | Bins with >2000 counts | High rate bins dominated by noise | Noise dominated (total time) | Noise dominated (detector-on time) | Marked lightcurve |
|---|---|---|---|---|---|---|---|
| A | 1413 | 1413 | 1 | 1 | 0.07% | 0.07% |  |
| B | 1413 | 1413 | 0 | 0 | 0.00% | 0.00% |  |
| C | 1413 | 1413 | 2 | 2 | 0.14% | 0.14% |  |
| D | 1413 | 1413 | 887 | 887 | 62.77% | 62.77% |  |
Top three noisy pixels from each quadrant. If the there are fewer than three noisy pixels in the level2.evt file, extra rows are filled as -1
| Pixel properties | Quadrant properties | ||||||
|---|---|---|---|---|---|---|---|
| Quadrant | DetID | PixID | Counts | Sigma | Mean | Median | Sigma |
| A | 7 | 16 | 2882 | 59.18 | 224 | 221 | 45.0 |
| A | 13 | 254 | 2197 | 43.95 | 224 | 221 | 45.0 |
| A | 0 | 226 | 2093 | 41.63 | 224 | 221 | 45.0 |
| B | 0 | 190 | 7603 | 174.93 | 221 | 217 | 42.2 |
| B | 3 | 112 | 4900 | 110.91 | 221 | 217 | 42.2 |
| B | 12 | 111 | 4050 | 90.78 | 221 | 217 | 42.2 |
| C | 3 | 233 | 60793 | 1277.59 | 204 | 206 | 47.4 |
| C | 14 | 238 | 33830 | 709.02 | 204 | 206 | 47.4 |
| C | 4 | 254 | 21561 | 450.31 | 204 | 206 | 47.4 |
| D | 1 | 52 | 1797794 | 44616.44 | 164 | 160 | 40.3 |
| D | 7 | 80 | 537394 | 13333.9 | 164 | 160 | 40.3 |
| D | 12 | 233 | 24169 | 595.89 | 164 | 160 | 40.3 |
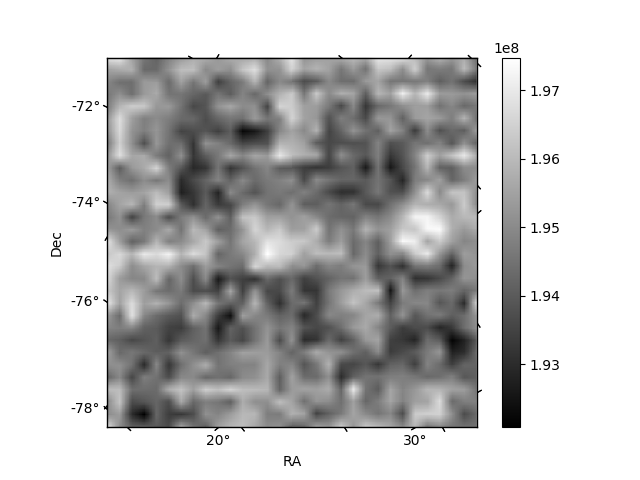
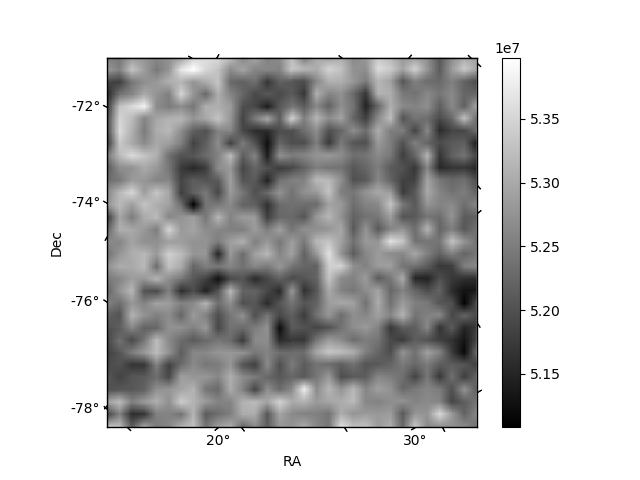
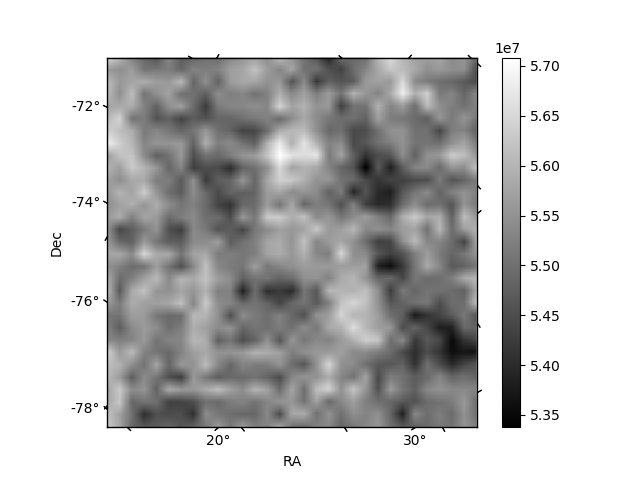
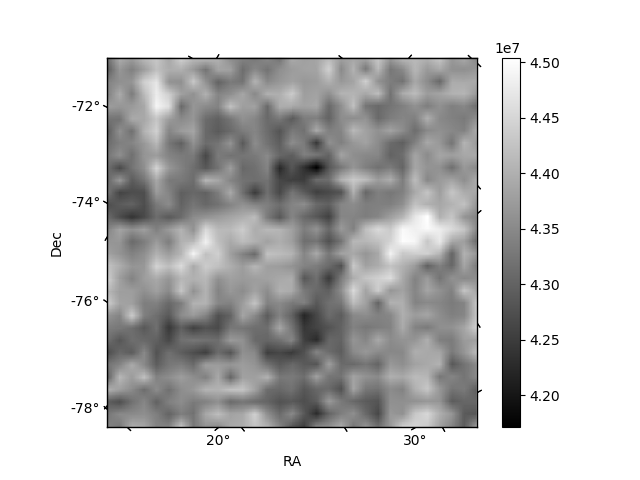
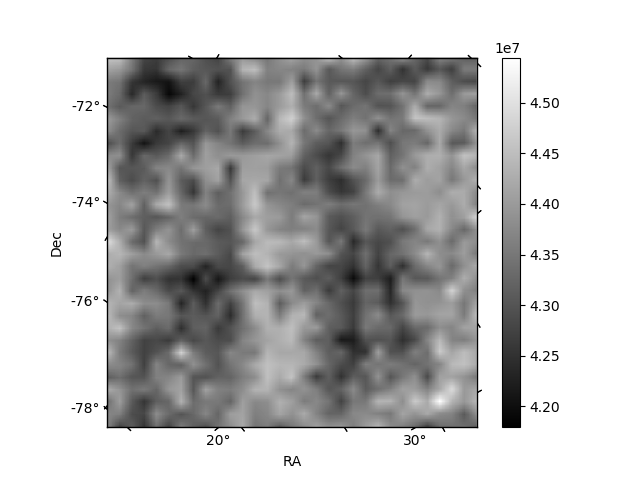
Histogram calculated using DETX and DETY for each event in the final _common_clean file
| Quadrant A | 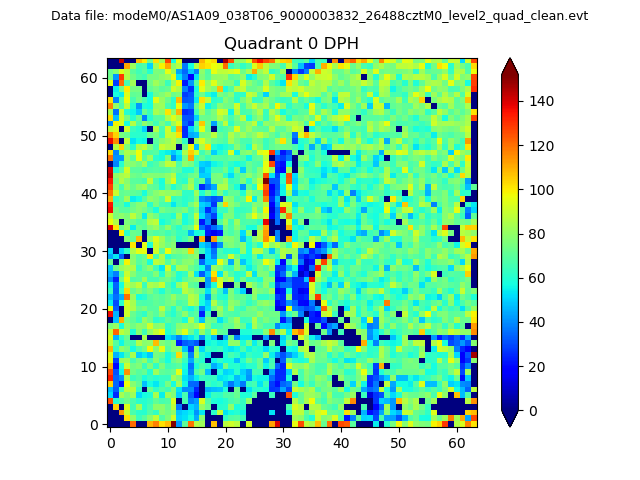 |
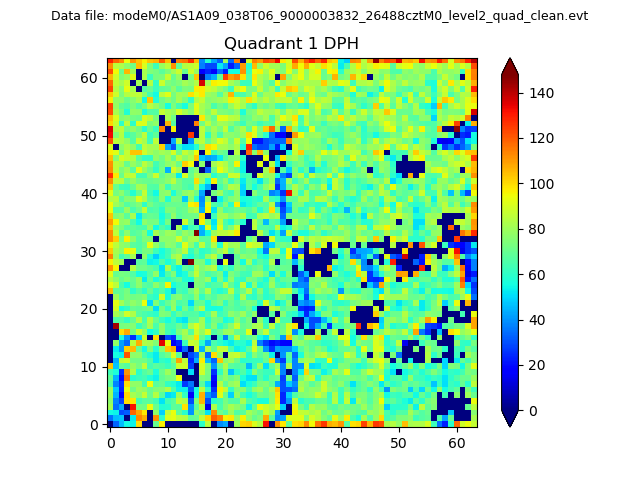 |
Quadrant B |
|---|---|---|---|
| Quadrant D | 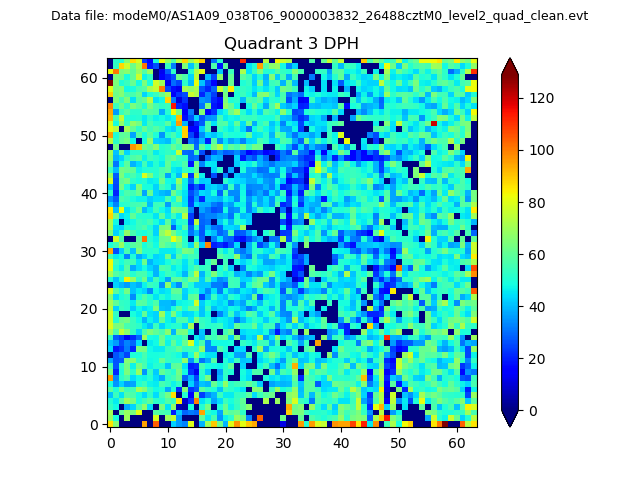 |
 |
Quadrant C |
| Plot type | Count rate plots | Images |
|---|---|---|
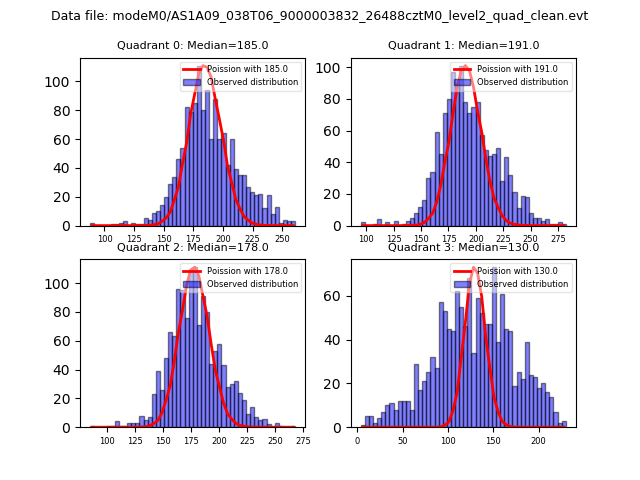
| Comparison with Poisson distribution Blue bars denote a histogram of data divided into 1 sec bins. Red curve is a Poisson curve with rate = median count rate of data. |
 |
 |
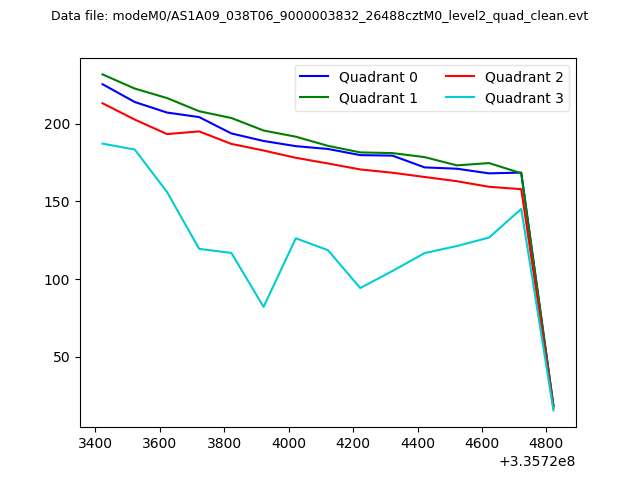
| Quadrant-wise count rates Data is divided into 100 sec bins |
 |
|
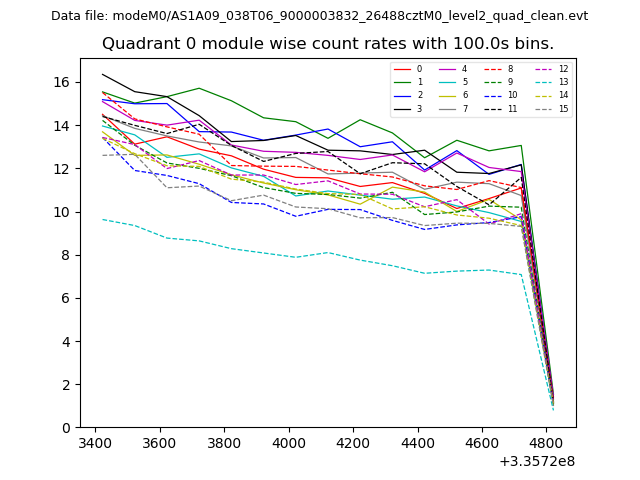
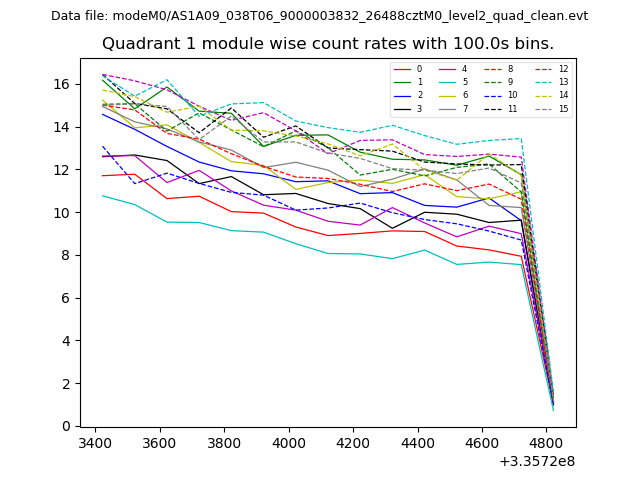
| Module-wise count rates for Quadrant A Data is divided into 100 sec bins |
 |
 |
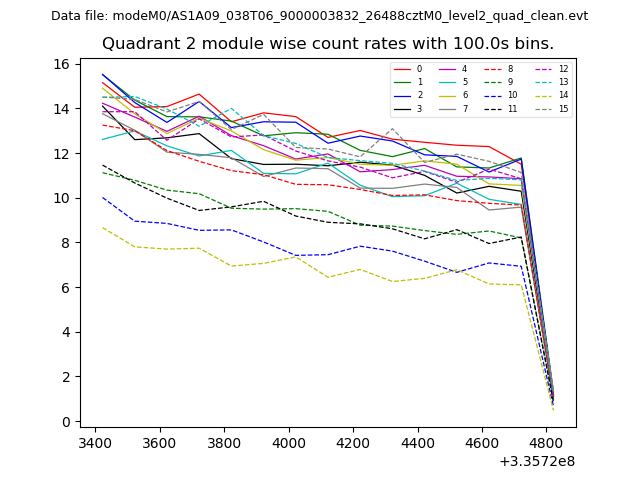
| Module-wise count rates for Quadrant B Data is divided into 100 sec bins |
 |
 |
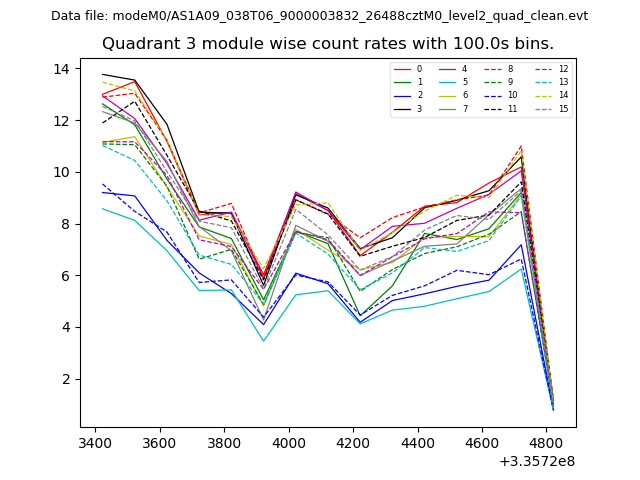
| Module-wise count rates for Quadrant C Data is divided into 100 sec bins |
 |
 |
| Module-wise count rates for Quadrant D Data is divided into 100 sec bins |
 |
 |
| Parameter | Plot |
|---|---|
| CZT HV Monitor | 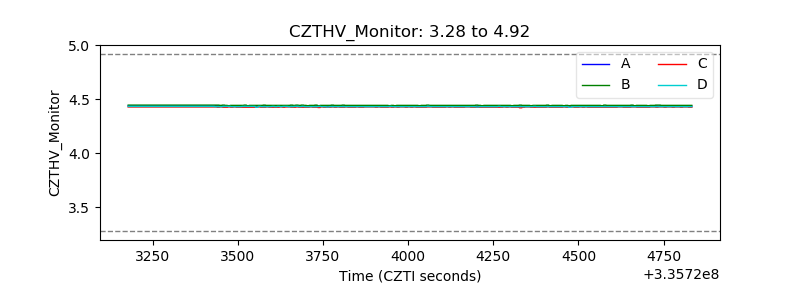 |
| D_VDD | 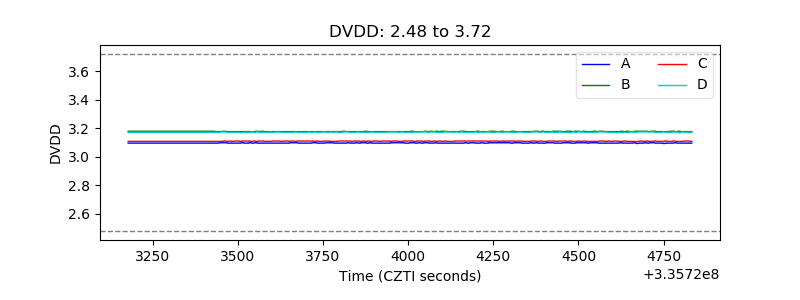 |
| Temperature 1 | 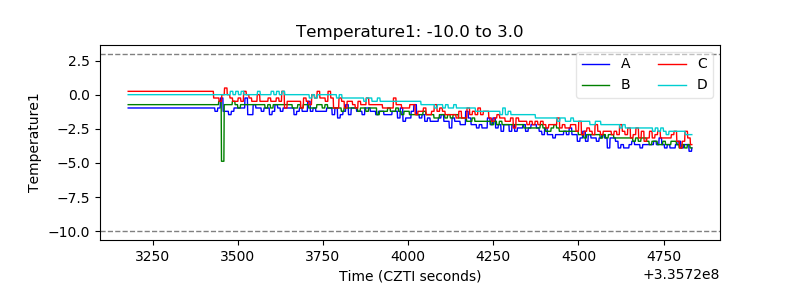 |
| Veto HV Monitor | 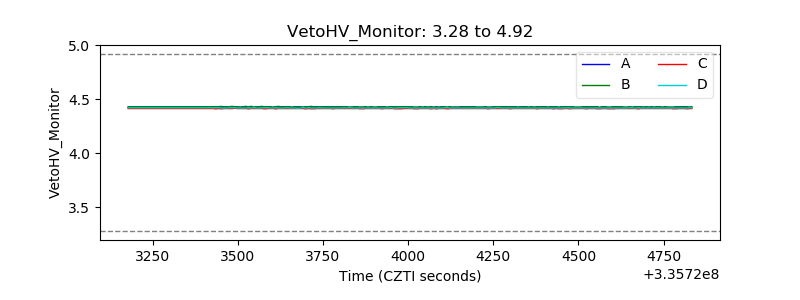 |
| Veto LLD | 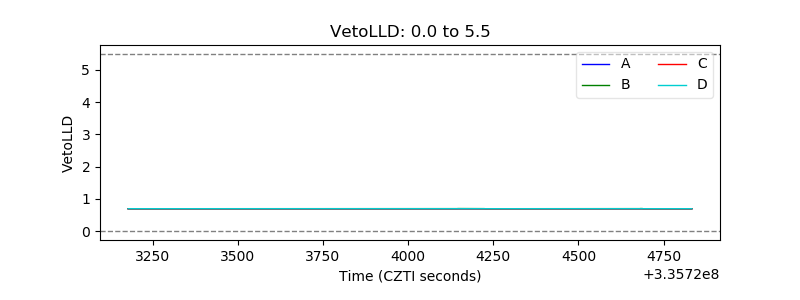 |
| Alpha Counter | 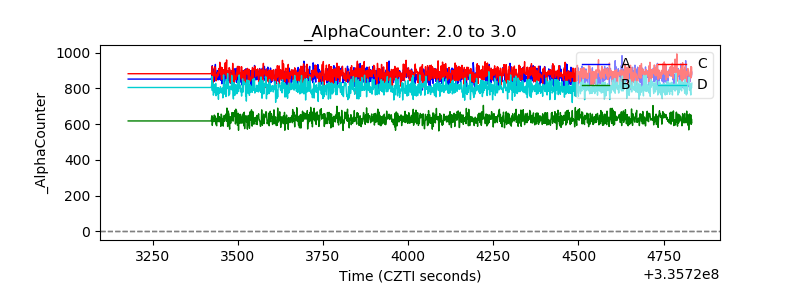 |
| _CPM_Rate | 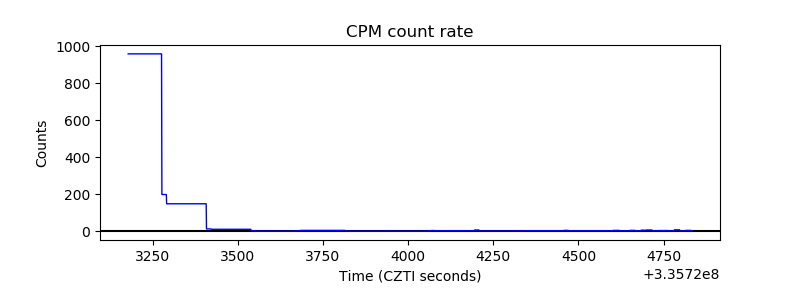 |
| CZT Counter | 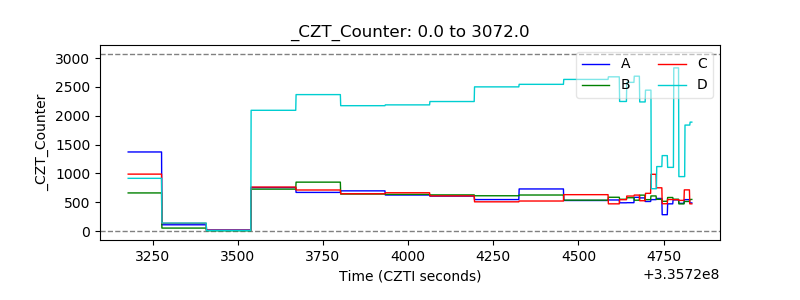 |
| +2.5 Volts monitor |  |
| +5 Volts monitor | 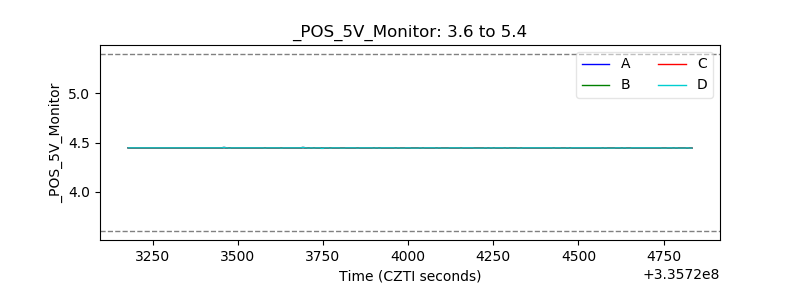 |
| _ROLL_ROT | 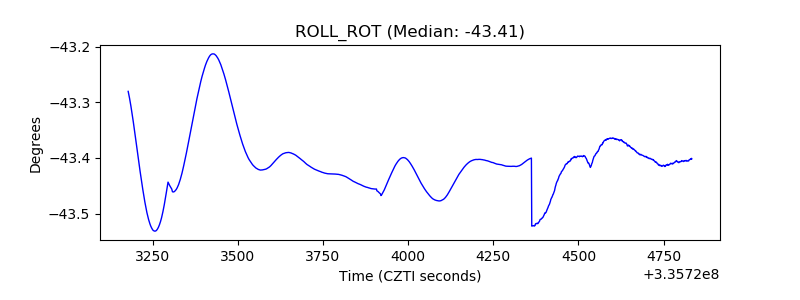 |
| _Roll_DEC |  |
| _Roll_RA | 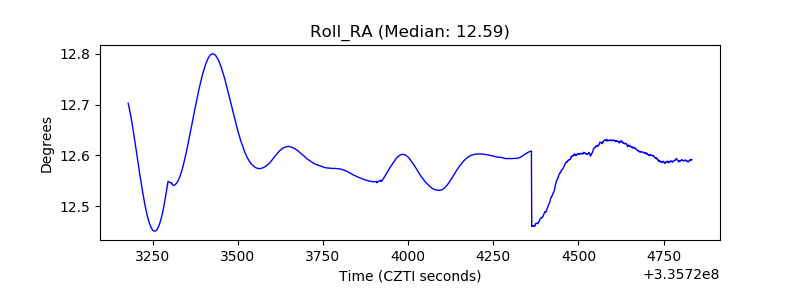 |
| Veto Counter | 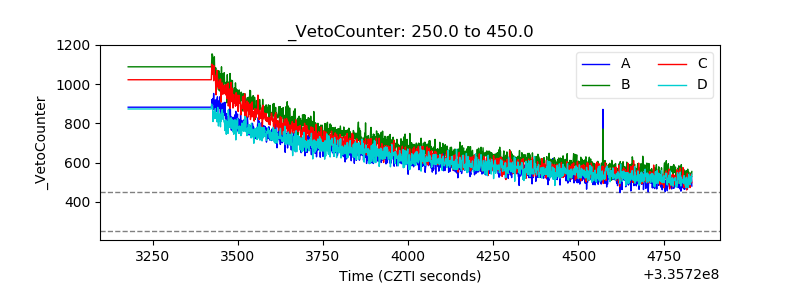 |