| Param | Original file | Final file |
|---|---|---|
| Filename | modeM0/AS1A09_038T06_9000003832_26489cztM0_level2.evt | modeM0/AS1A09_038T06_9000003832_26489cztM0_level2_quad_clean.evt |
| Size (bytes) | 652,230,720 | 139,464,000 |
| Size | 622.0 MB | 133.0 MB |
| Events in quadrant A | 3,252,099 | 1,005,278 |
| Events in quadrant B | 3,352,644 | 1,025,589 |
| Events in quadrant C | 3,389,415 | 958,135 |
| Events in quadrant D | 9,348,395 | 810,814 |
| Mode M0 | |||
|---|---|---|---|
| Quadrant | BADHDUFLAG | Total packets | Discarded packets |
| A | 0 | 13527 | 0 |
| B | 0 | 13823 | 0 |
| C | 0 | 13950 | 0 |
| D | 0 | 32060 | 0 |
| Mode M9 | |||
|---|---|---|---|
| Quadrant | BADHDUFLAG | Total packets | Discarded packets |
| A | 0 | 14 | 0 |
| B | 0 | 15 | 0 |
| C | 0 | 15 | 0 |
| D | 0 | 15 | 0 |
| Quadrant | Total seconds | Saturated seconds | Saturation percentage |
|---|---|---|---|
| A | 6072 | 63 | 1.037549% |
| B | 6072 | 90 | 1.482213% |
| C | 6072 | 107 | 1.762187% |
| D | 6072 | 1980 | 32.608696% |
Noise dominated data is calculated using 1-second bins in cleaned event files. If a bin has >2000 counts, and if more than 50% of those come from <1% of pixels, then it is considered to be noise-dominated and hence unusable.
| Quadrant | # 1 sec bins | Bins with >0 counts | Bins with >2000 counts | High rate bins dominated by noise | Noise dominated (total time) | Noise dominated (detector-on time) | Marked lightcurve |
|---|---|---|---|---|---|---|---|
| A | 7452 | 6072 | 1 | 1 | 0.01% | 0.02% | 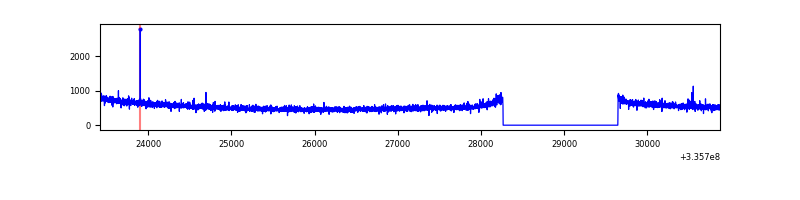 |
| B | 7452 | 6072 | 7 | 7 | 0.09% | 0.12% | 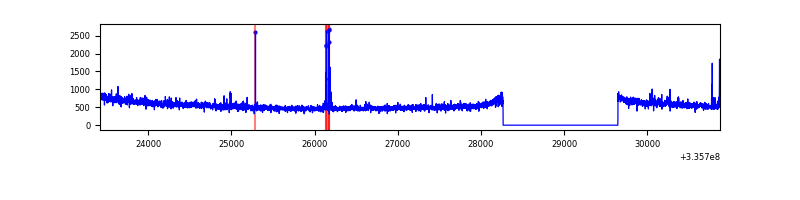 |
| C | 7452 | 6072 | 2 | 2 | 0.03% | 0.03% | 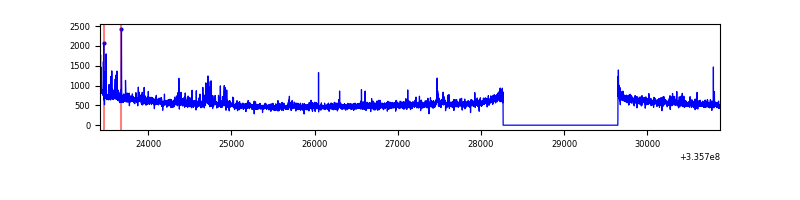 |
| D | 7452 | 6073 | 1898 | 1898 | 25.47% | 31.25% | 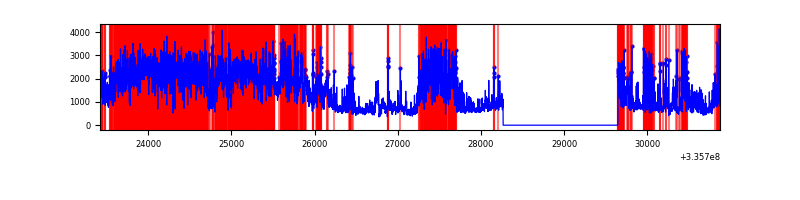 |
Top three noisy pixels from each quadrant. If the there are fewer than three noisy pixels in the level2.evt file, extra rows are filled as -1
| Pixel properties | Quadrant properties | ||||||
|---|---|---|---|---|---|---|---|
| Quadrant | DetID | PixID | Counts | Sigma | Mean | Median | Sigma |
| A | 13 | 254 | 9767 | 54.54 | 840 | 829 | 163.9 |
| A | 0 | 226 | 7385 | 40.01 | 840 | 829 | 163.9 |
| A | 3 | 137 | 6748 | 36.12 | 840 | 829 | 163.9 |
| B | 15 | 222 | 27237 | 174.25 | 836 | 817 | 151.6 |
| B | 12 | 111 | 16765 | 105.18 | 836 | 817 | 151.6 |
| B | 15 | 32 | 16575 | 103.93 | 836 | 817 | 151.6 |
| C | 3 | 233 | 140374 | 781.88 | 789 | 796 | 178.5 |
| C | 14 | 238 | 130972 | 729.22 | 789 | 796 | 178.5 |
| C | 4 | 254 | 26067 | 141.56 | 789 | 796 | 178.5 |
| D | 1 | 52 | 4370789 | 25896.96 | 716 | 699 | 168.7 |
| D | 7 | 80 | 1577858 | 9346.17 | 716 | 699 | 168.7 |
| D | 12 | 233 | 620101 | 3670.55 | 716 | 699 | 168.7 |
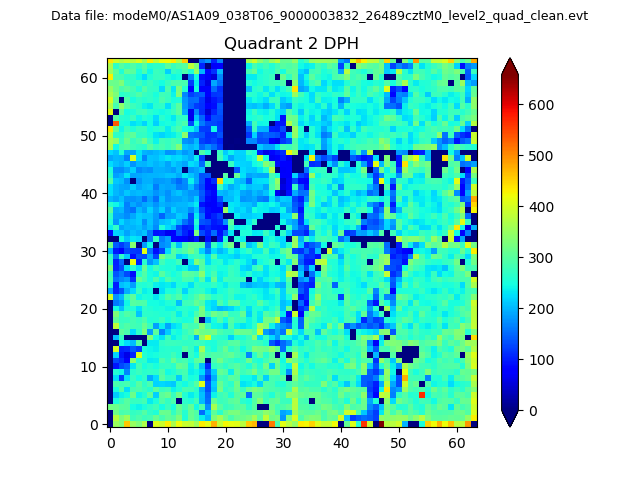
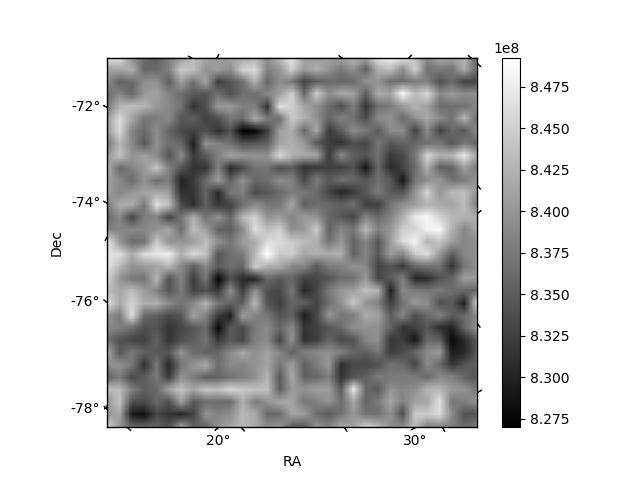
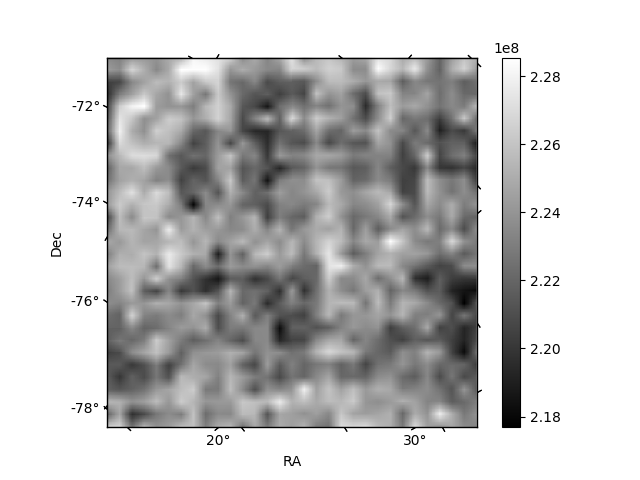
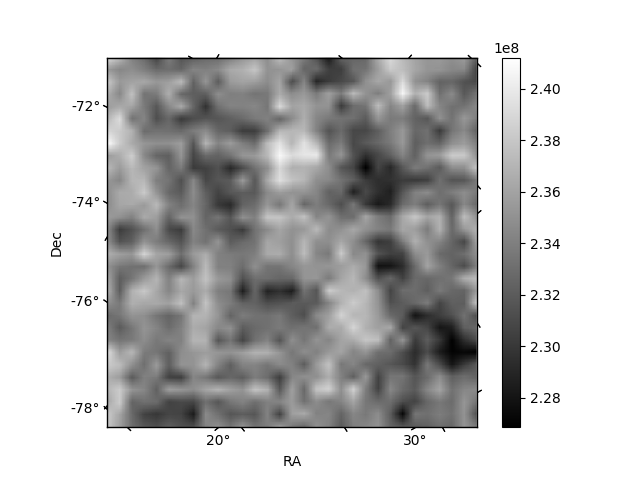
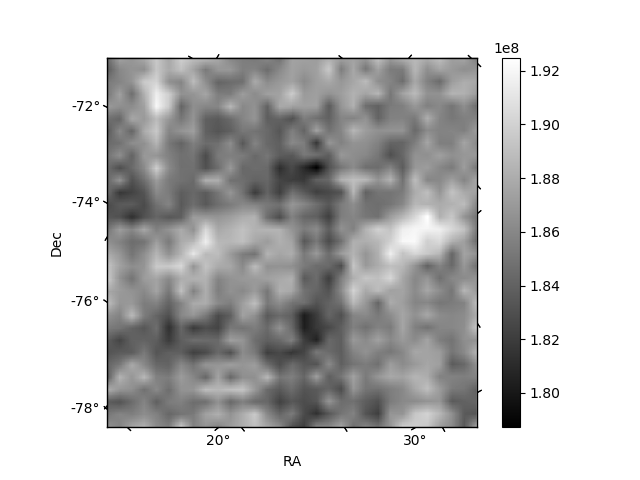
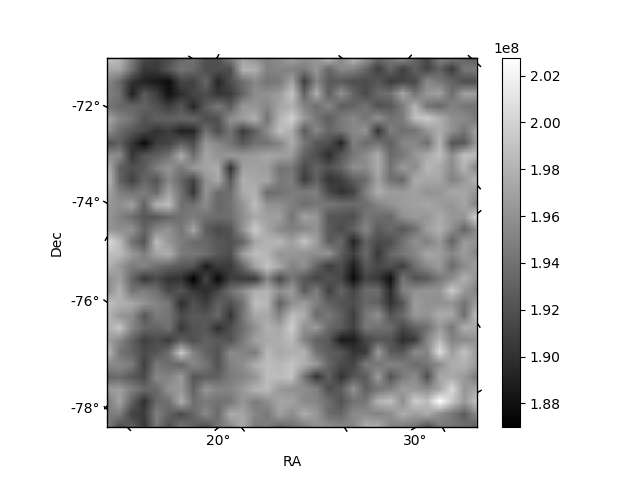
Histogram calculated using DETX and DETY for each event in the final _common_clean file
| Quadrant A | 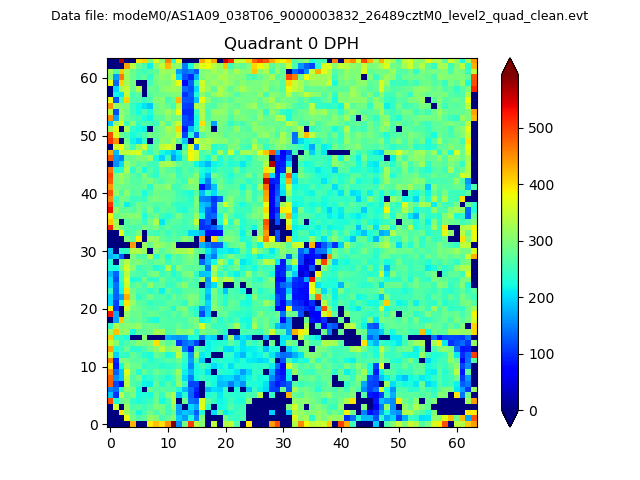 |
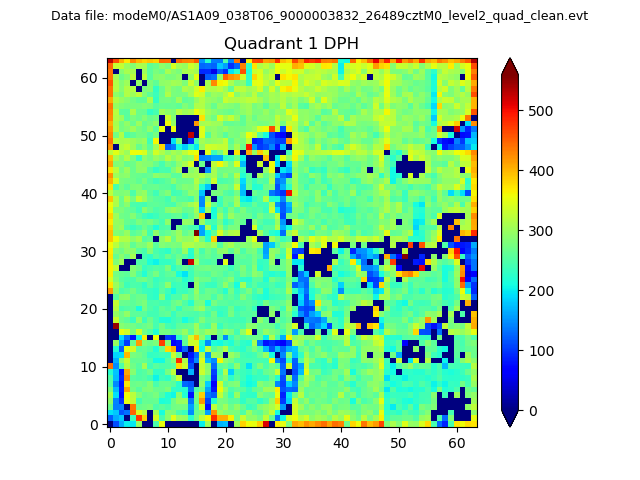 |
Quadrant B |
|---|---|---|---|
| Quadrant D | 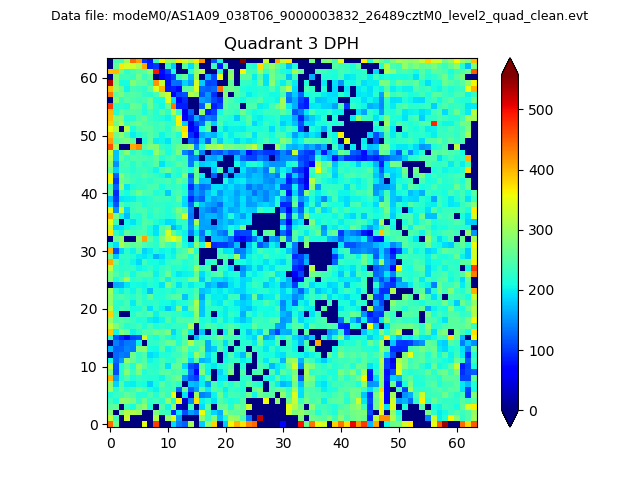 |
 |
Quadrant C |
| Plot type | Count rate plots | Images |
|---|---|---|
| Comparison with Poisson distribution Blue bars denote a histogram of data divided into 1 sec bins. Red curve is a Poisson curve with rate = median count rate of data. |
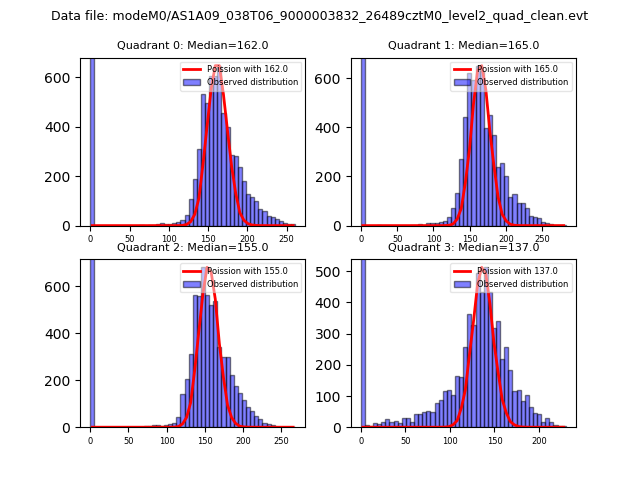 |
 |
| Quadrant-wise count rates Data is divided into 100 sec bins |
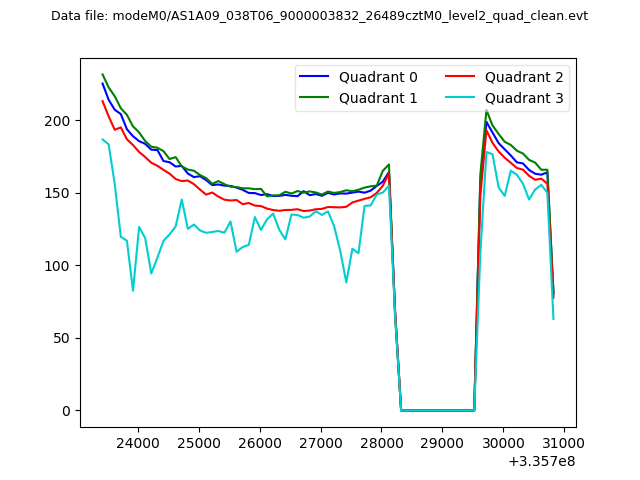 |
|
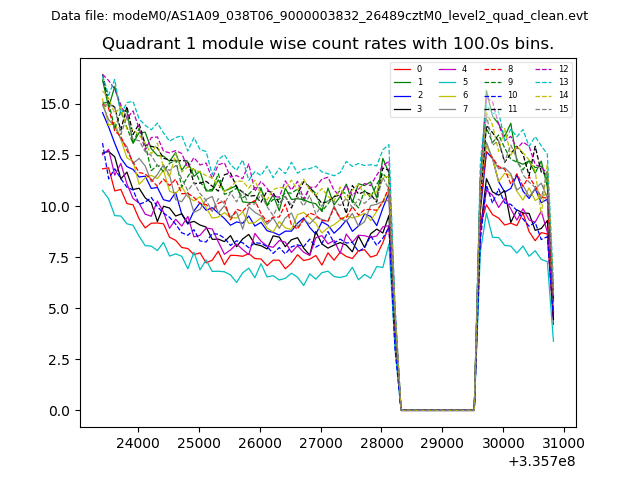
| Module-wise count rates for Quadrant A Data is divided into 100 sec bins |
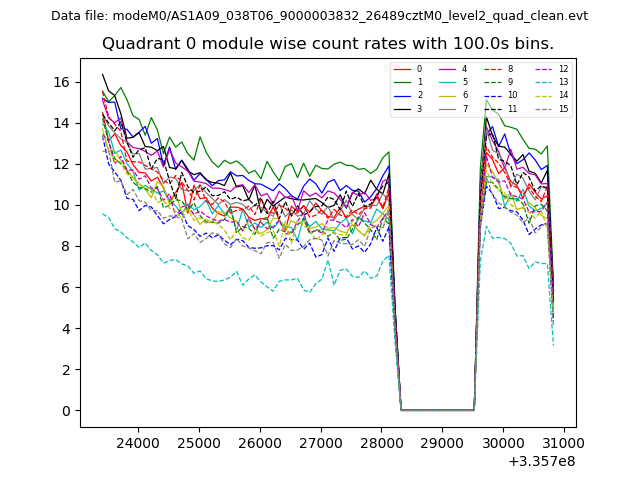 |
 |
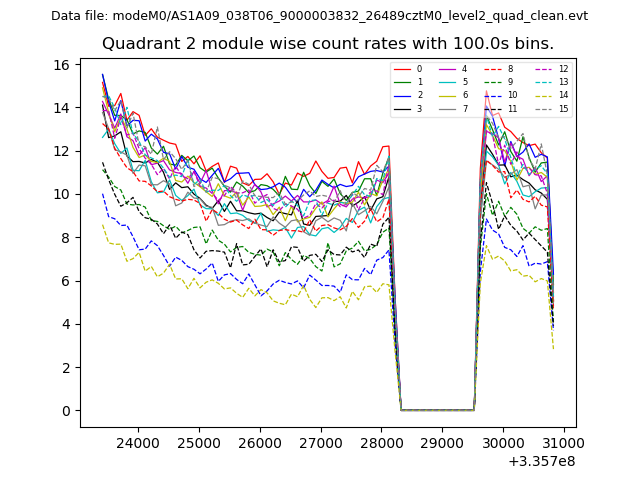
| Module-wise count rates for Quadrant B Data is divided into 100 sec bins |
 |
 |
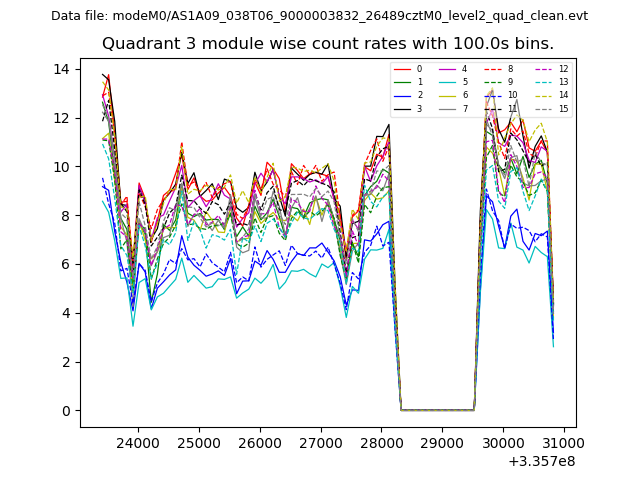
| Module-wise count rates for Quadrant C Data is divided into 100 sec bins |
 |
 |
| Module-wise count rates for Quadrant D Data is divided into 100 sec bins |
 |
 |
| Parameter | Plot |
|---|---|
| CZT HV Monitor | 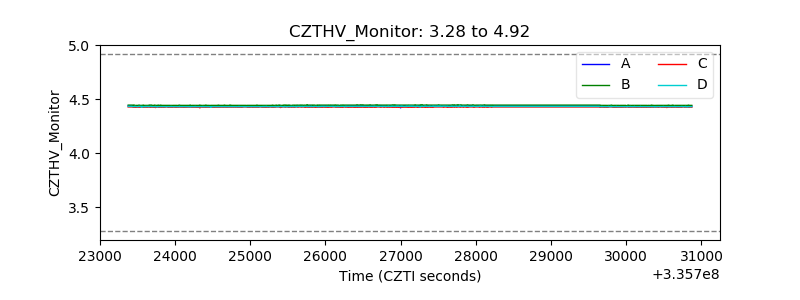 |
| D_VDD | 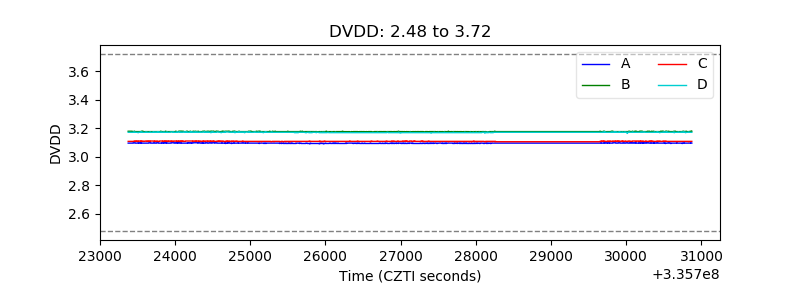 |
| Temperature 1 | 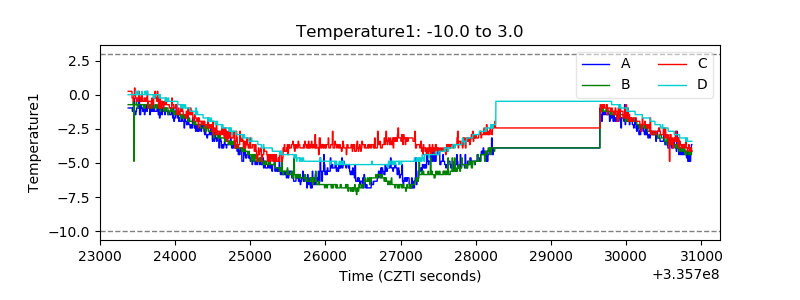 |
| Veto HV Monitor | 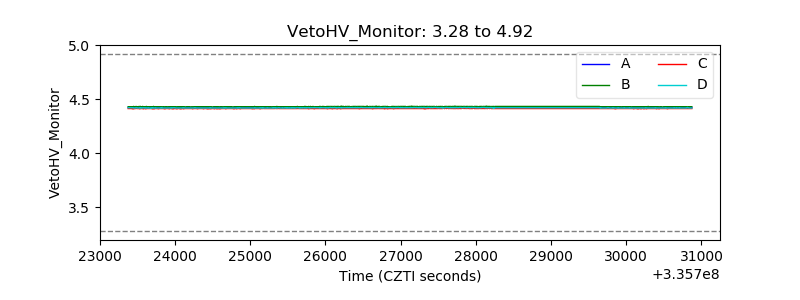 |
| Veto LLD | 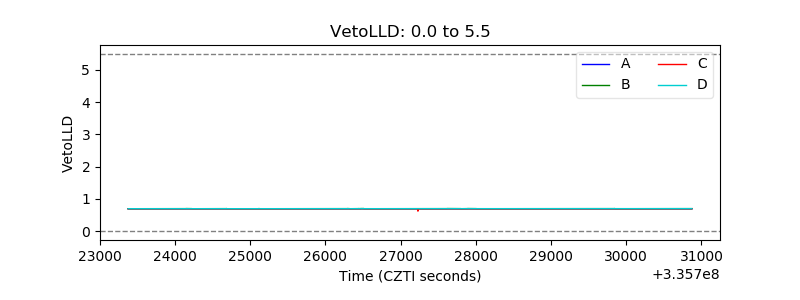 |
| Alpha Counter | 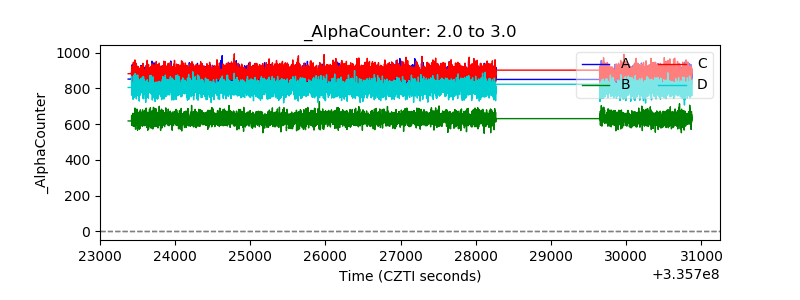 |
| _CPM_Rate | 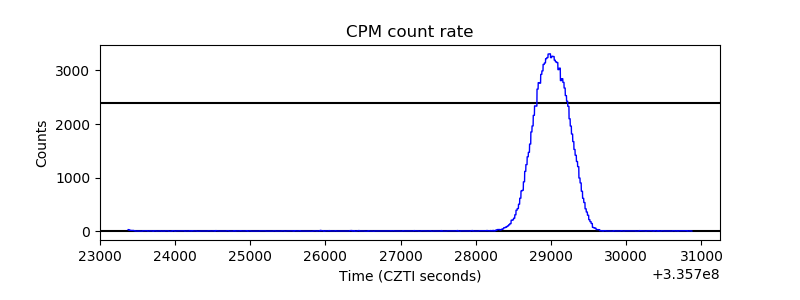 |
| CZT Counter | 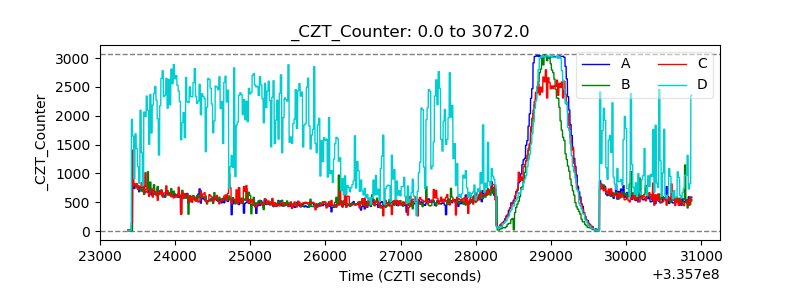 |
| +2.5 Volts monitor | 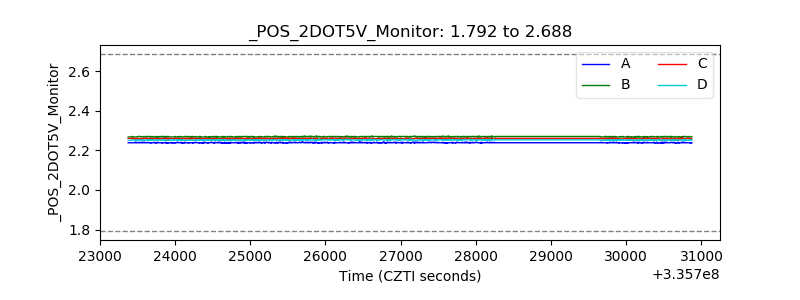 |
| +5 Volts monitor |  |
| _ROLL_ROT | 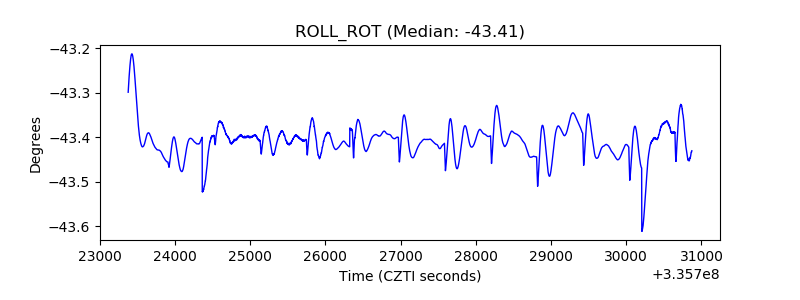 |
| _Roll_DEC |  |
| _Roll_RA | 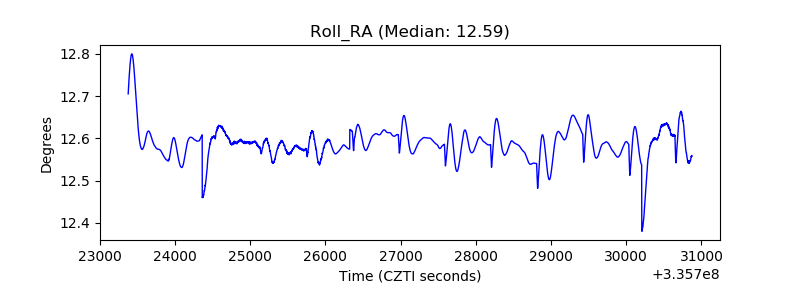 |
| Veto Counter | 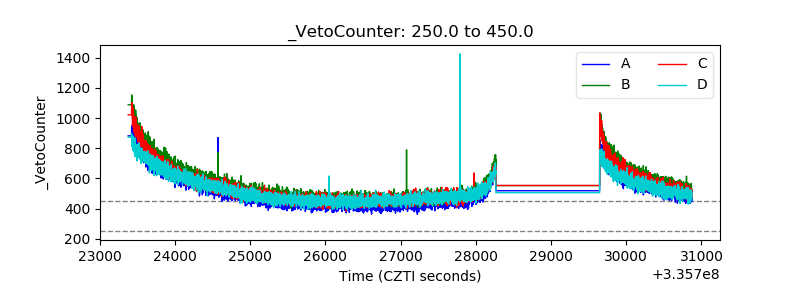 |