| Param | Original file | Final file |
|---|---|---|
| Filename | modeM0/AS1A09_038T06_9000003832_26491cztM0_level2.evt | modeM0/AS1A09_038T06_9000003832_26491cztM0_level2_quad_clean.evt |
| Size (bytes) | 571,161,600 | 132,030,720 |
| Size | 544.7 MB | 125.9 MB |
| Events in quadrant A | 3,085,060 | 917,805 |
| Events in quadrant B | 3,233,007 | 938,188 |
| Events in quadrant C | 3,272,029 | 892,073 |
| Events in quadrant D | 7,271,082 | 801,235 |
| Mode M0 | |||
|---|---|---|---|
| Quadrant | BADHDUFLAG | Total packets | Discarded packets |
| A | 0 | 13335 | 0 |
| B | 0 | 13651 | 0 |
| C | 0 | 13691 | 0 |
| D | 0 | 26005 | 0 |
| Mode M9 | |||
|---|---|---|---|
| Quadrant | BADHDUFLAG | Total packets | Discarded packets |
| A | 0 | 19 | 0 |
| B | 0 | 20 | 0 |
| C | 0 | 20 | 0 |
| D | 0 | 20 | 0 |
| Quadrant | Total seconds | Saturated seconds | Saturation percentage |
|---|---|---|---|
| A | 6444 | 34 | 0.527623% |
| B | 6444 | 64 | 0.993172% |
| C | 6444 | 83 | 1.288020% |
| D | 6444 | 1145 | 17.768467% |
Noise dominated data is calculated using 1-second bins in cleaned event files. If a bin has >2000 counts, and if more than 50% of those come from <1% of pixels, then it is considered to be noise-dominated and hence unusable.
| Quadrant | # 1 sec bins | Bins with >0 counts | Bins with >2000 counts | High rate bins dominated by noise | Noise dominated (total time) | Noise dominated (detector-on time) | Marked lightcurve |
|---|---|---|---|---|---|---|---|
| A | 7519 | 6445 | 0 | 0 | 0.00% | 0.00% | 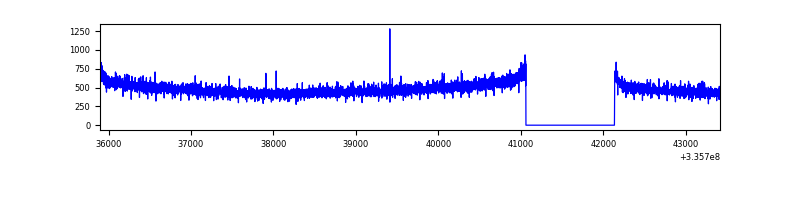 |
| B | 7519 | 6445 | 4 | 4 | 0.05% | 0.06% | 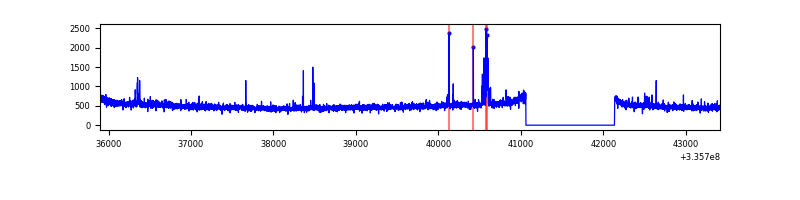 |
| C | 7519 | 6445 | 1 | 1 | 0.01% | 0.02% | 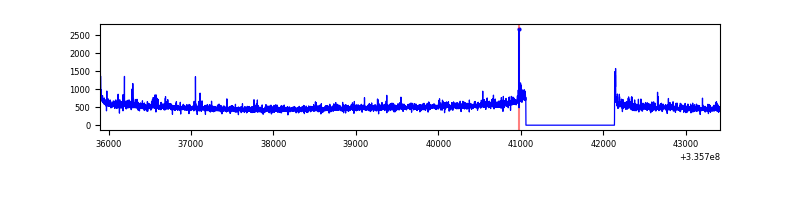 |
| D | 7519 | 6444 | 977 | 977 | 12.99% | 15.16% | 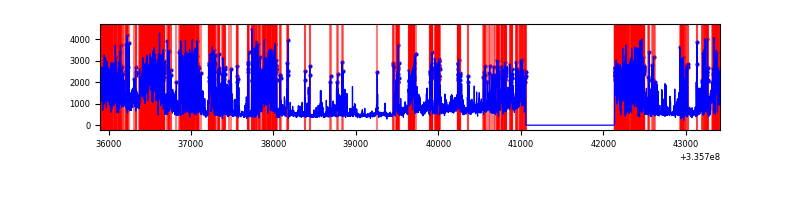 |
Top three noisy pixels from each quadrant. If the there are fewer than three noisy pixels in the level2.evt file, extra rows are filled as -1
| Pixel properties | Quadrant properties | ||||||
|---|---|---|---|---|---|---|---|
| Quadrant | DetID | PixID | Counts | Sigma | Mean | Median | Sigma |
| A | 13 | 254 | 11278 | 66.42 | 799 | 783 | 158.0 |
| A | 3 | 137 | 7140 | 40.23 | 799 | 783 | 158.0 |
| A | 0 | 226 | 6951 | 39.03 | 799 | 783 | 158.0 |
| B | 0 | 190 | 54094 | 359.74 | 802 | 783 | 148.2 |
| B | 12 | 111 | 17408 | 112.19 | 802 | 783 | 148.2 |
| B | 11 | 111 | 15479 | 99.17 | 802 | 783 | 148.2 |
| C | 14 | 238 | 124681 | 696.22 | 769 | 775 | 178.0 |
| C | 3 | 233 | 108724 | 606.56 | 769 | 775 | 178.0 |
| C | 4 | 254 | 32070 | 175.85 | 769 | 775 | 178.0 |
| D | 1 | 52 | 2467267 | 14460.75 | 718 | 700 | 170.6 |
| D | 7 | 80 | 1627017 | 9534.61 | 718 | 700 | 170.6 |
| D | 12 | 233 | 360324 | 2108.37 | 718 | 700 | 170.6 |
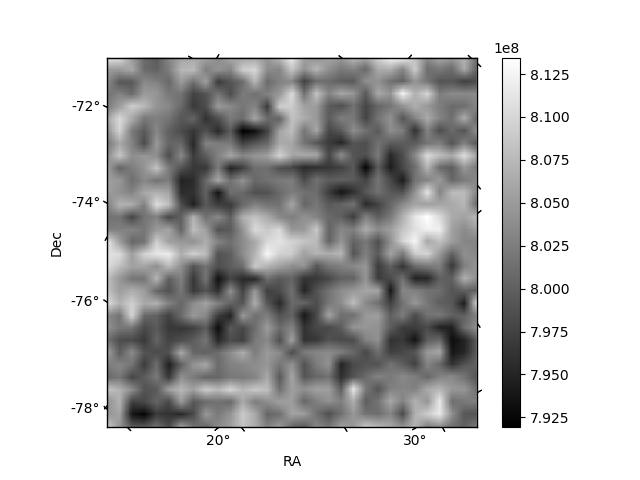
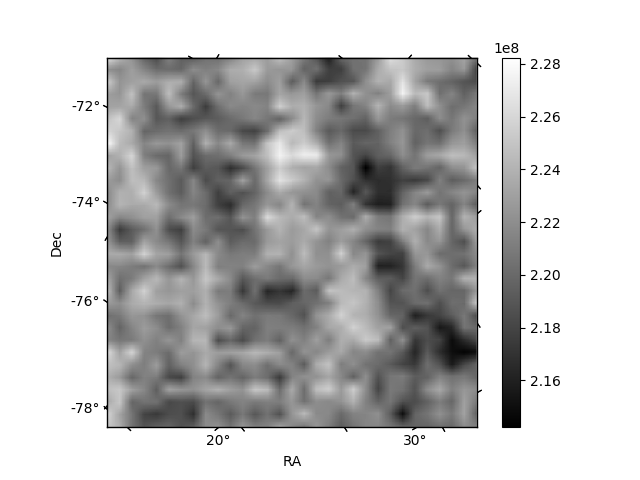
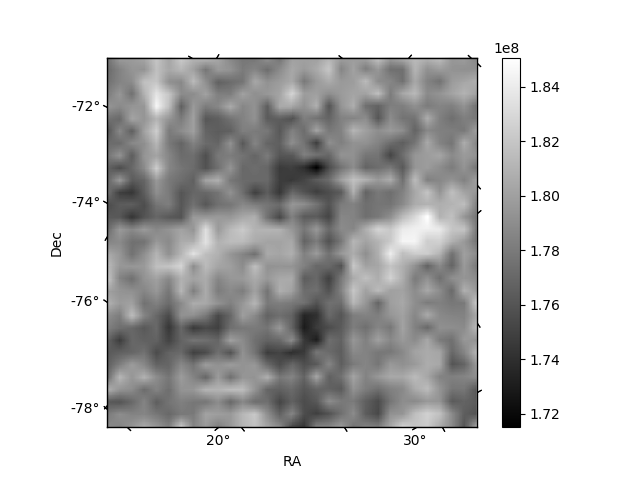
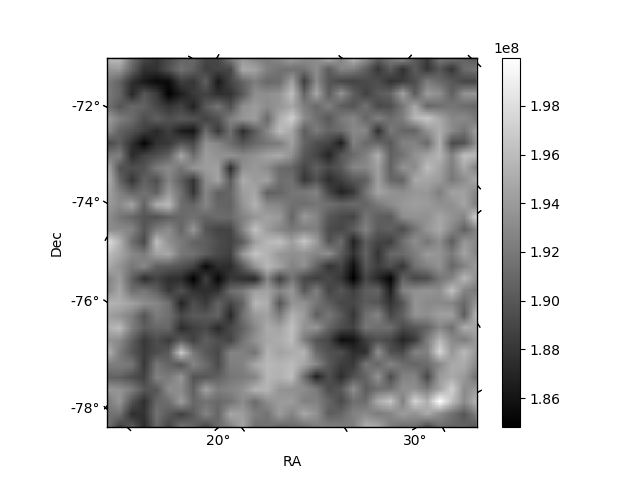
Histogram calculated using DETX and DETY for each event in the final _common_clean file
| Quadrant A | 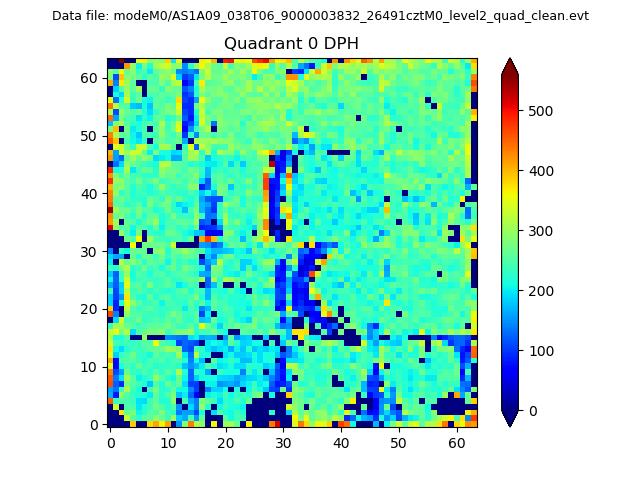 |
 |
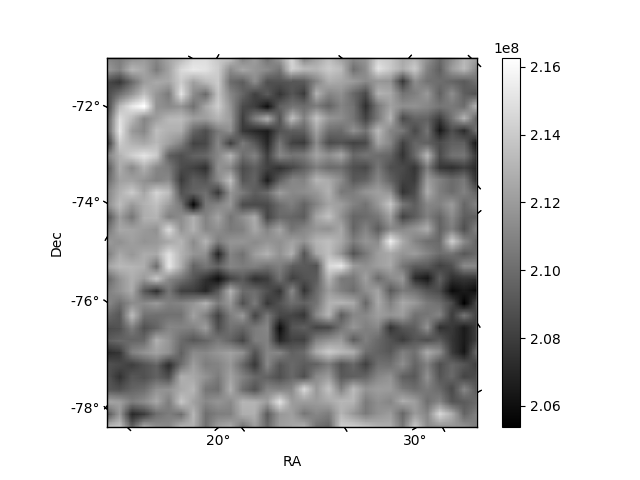
Quadrant B |
|---|---|---|---|
| Quadrant D | 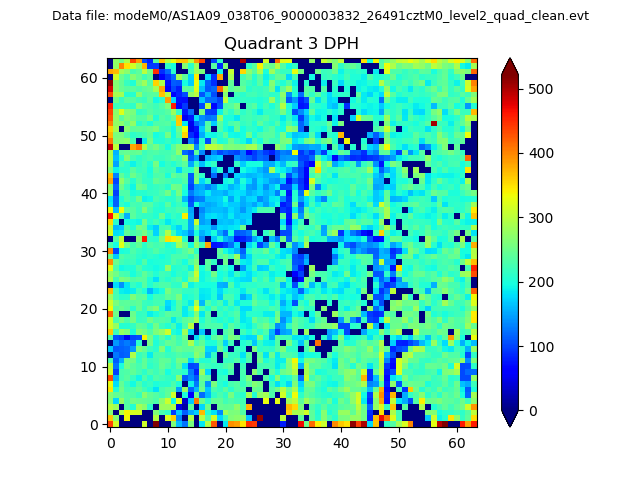 |
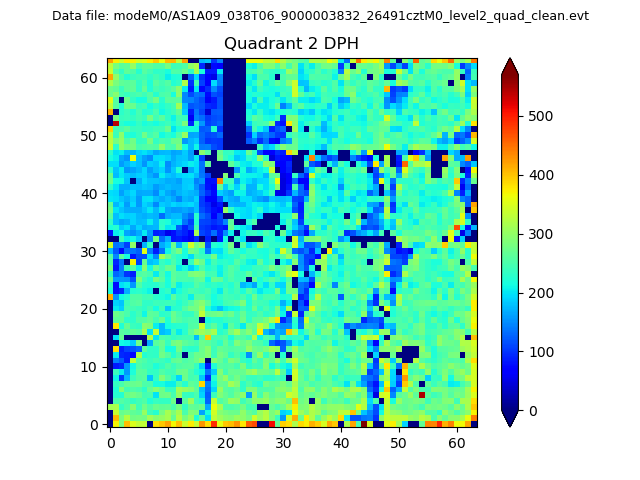 |
Quadrant C |
| Plot type | Count rate plots | Images |
|---|---|---|
| Comparison with Poisson distribution Blue bars denote a histogram of data divided into 1 sec bins. Red curve is a Poisson curve with rate = median count rate of data. |
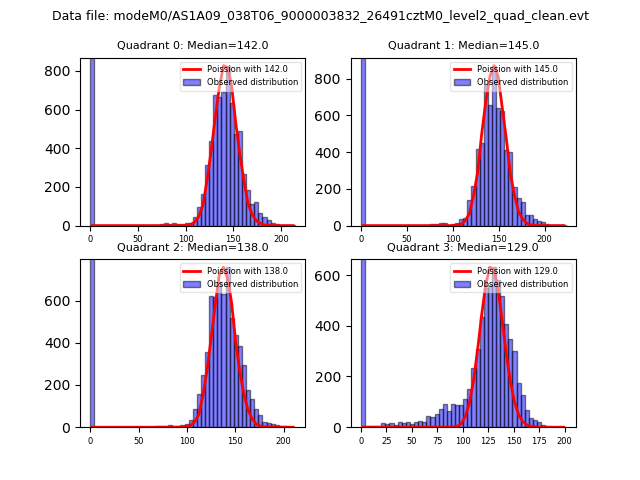 |
 |
| Quadrant-wise count rates Data is divided into 100 sec bins |
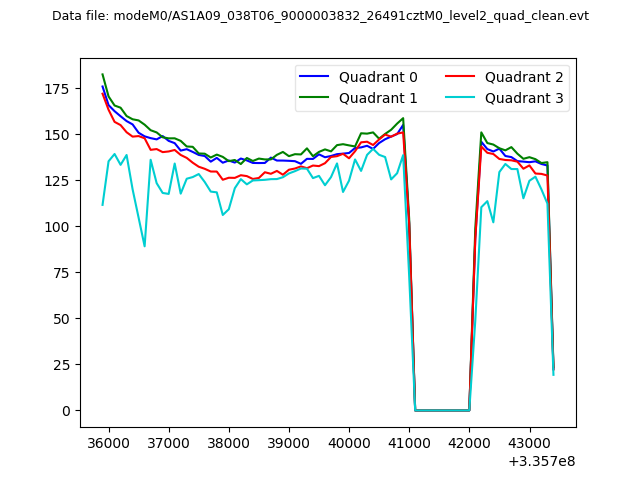 |
|
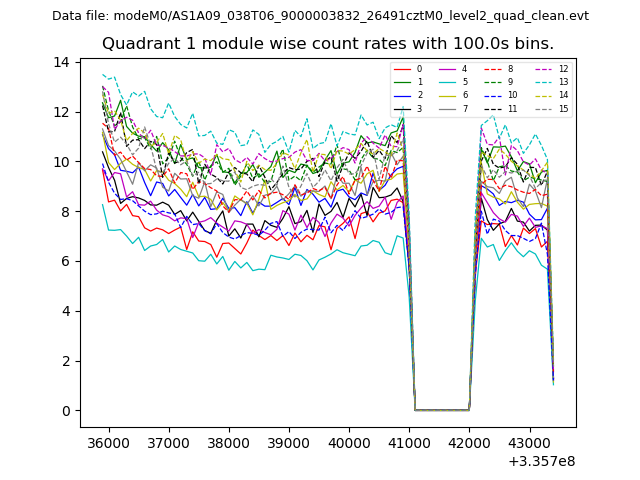
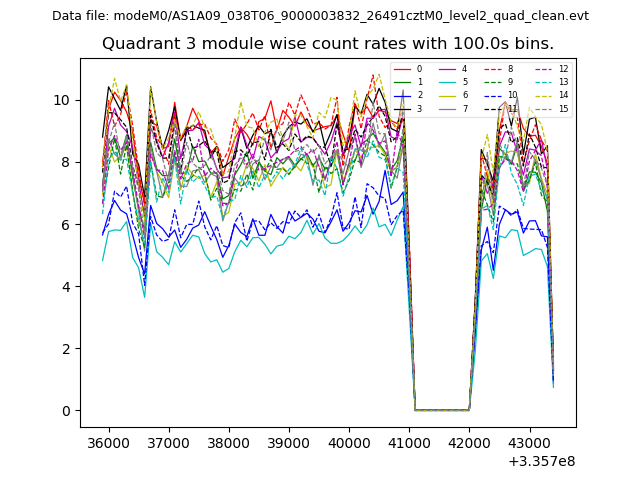
| Module-wise count rates for Quadrant A Data is divided into 100 sec bins |
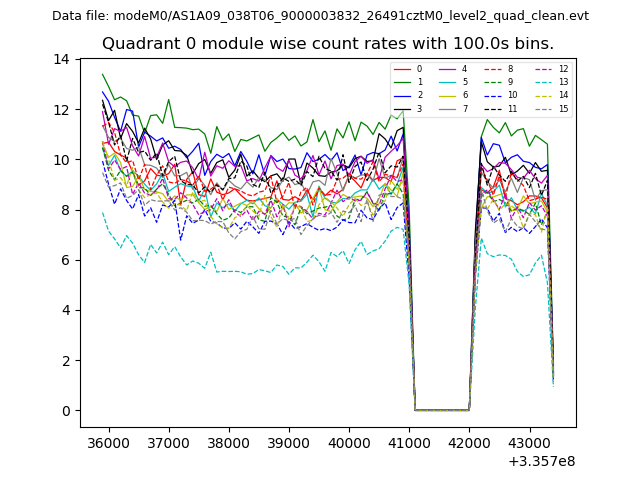 |
 |
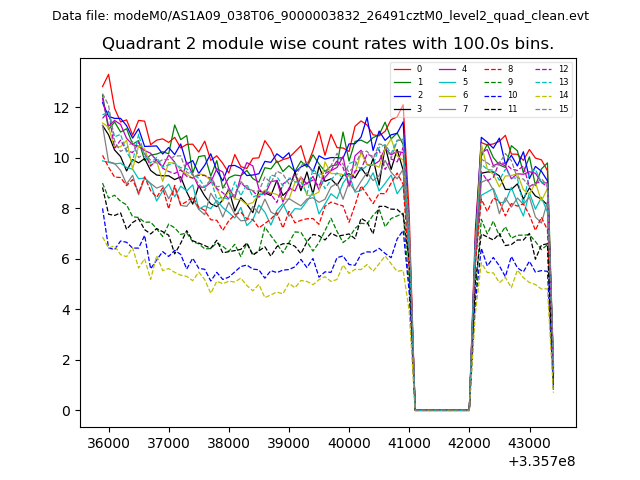
| Module-wise count rates for Quadrant B Data is divided into 100 sec bins |
 |
 |
| Module-wise count rates for Quadrant C Data is divided into 100 sec bins |
 |
 |
| Module-wise count rates for Quadrant D Data is divided into 100 sec bins |
 |
 |
| Parameter | Plot |
|---|---|
| CZT HV Monitor | 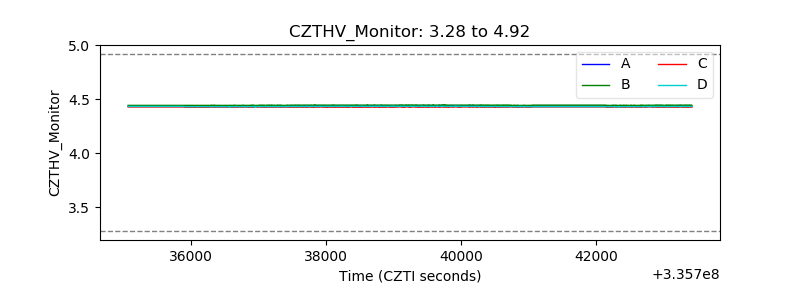 |
| D_VDD | 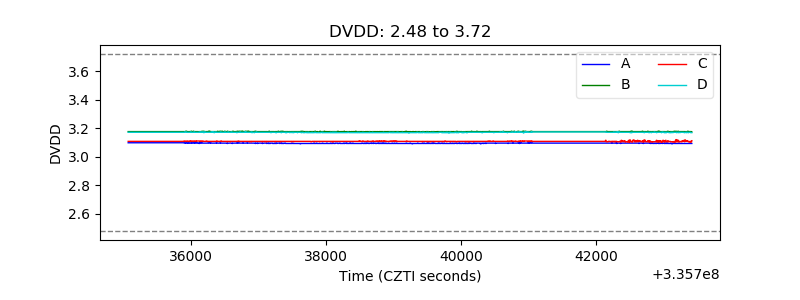 |
| Temperature 1 | 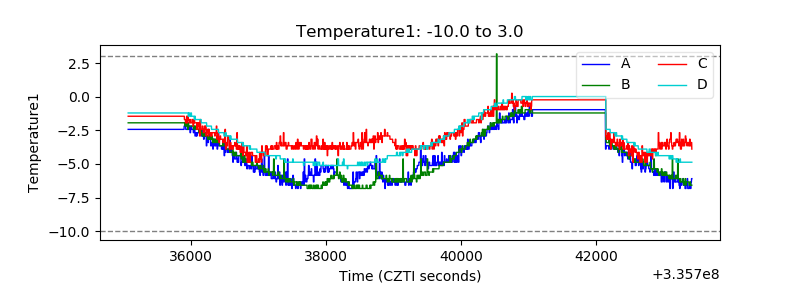 |
| Veto HV Monitor |  |
| Veto LLD | 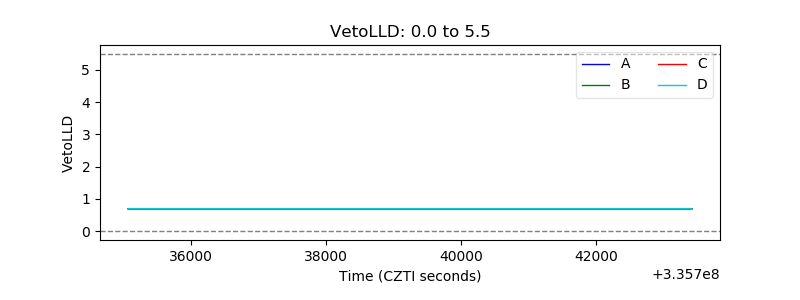 |
| Alpha Counter | 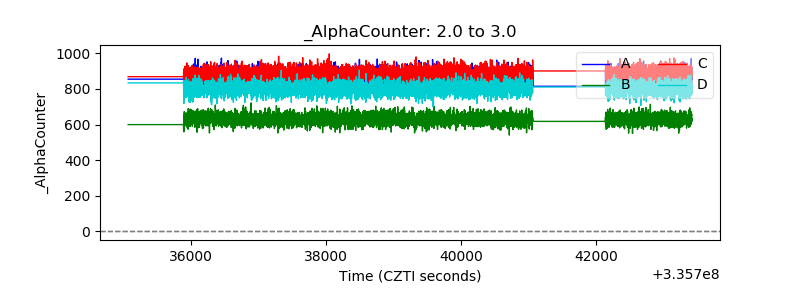 |
| _CPM_Rate |  |
| CZT Counter | 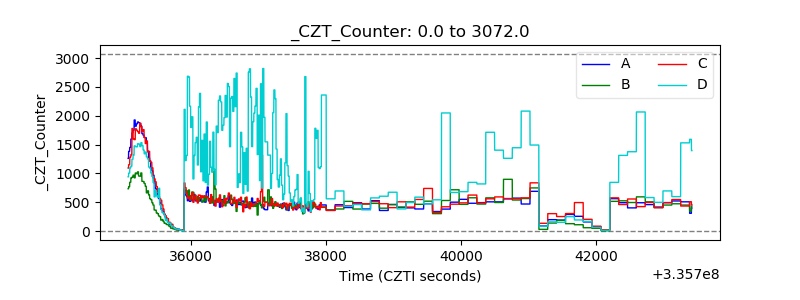 |
| +2.5 Volts monitor | 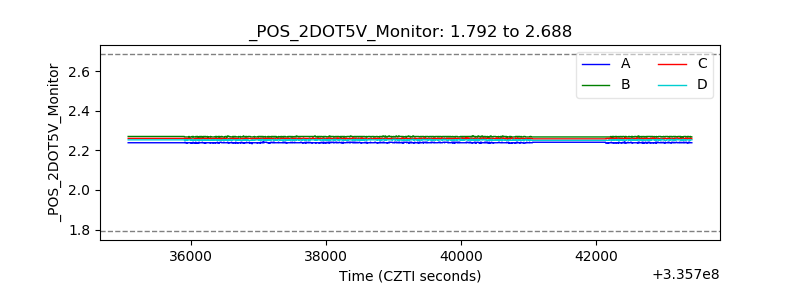 |
| +5 Volts monitor | 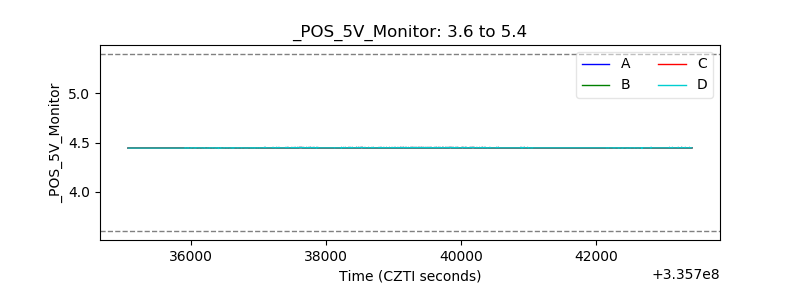 |
| _ROLL_ROT | 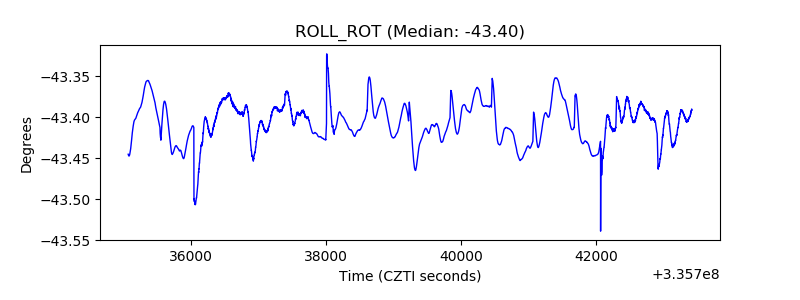 |
| _Roll_DEC | 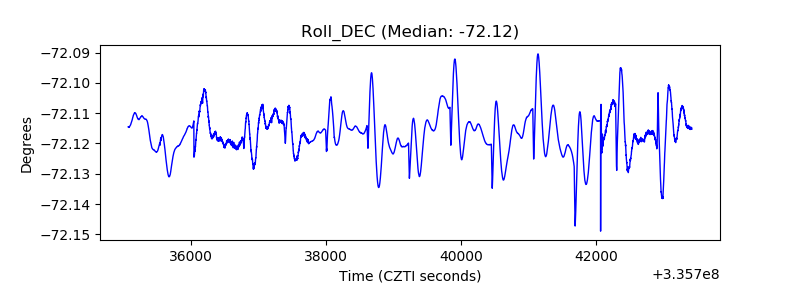 |
| _Roll_RA | 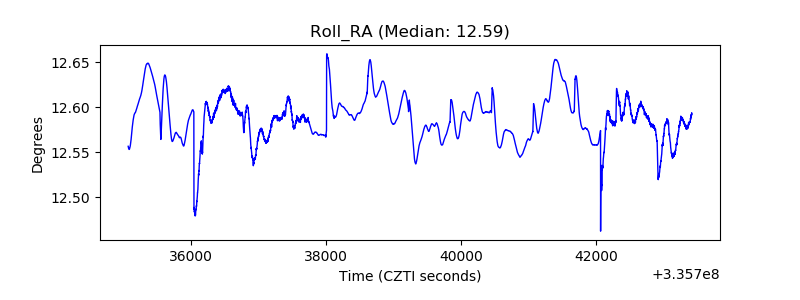 |
| Veto Counter | 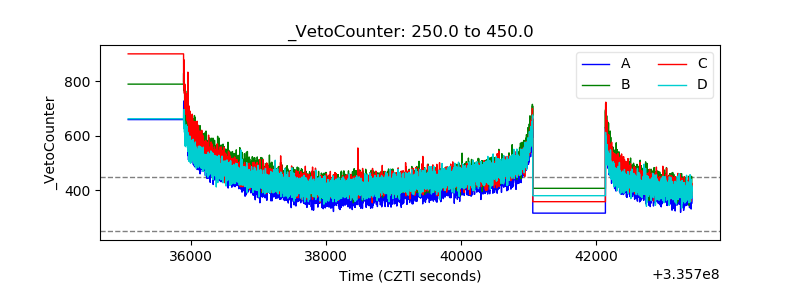 |