| Param | Original file | Final file |
|---|---|---|
| Filename | modeM0/AS1A09_038T06_9000003832_26492cztM0_level2.evt | modeM0/AS1A09_038T06_9000003832_26492cztM0_level2_quad_clean.evt |
| Size (bytes) | 464,996,160 | 108,362,880 |
| Size | 443.5 MB | 103.3 MB |
| Events in quadrant A | 2,560,338 | 741,978 |
| Events in quadrant B | 2,647,002 | 756,819 |
| Events in quadrant C | 2,836,359 | 723,973 |
| Events in quadrant D | 5,663,568 | 672,518 |
| Mode M0 | |||
|---|---|---|---|
| Quadrant | BADHDUFLAG | Total packets | Discarded packets |
| A | 0 | 11226 | 0 |
| B | 0 | 11412 | 0 |
| C | 0 | 11729 | 0 |
| D | 0 | 20689 | 0 |
| Mode M9 | |||
|---|---|---|---|
| Quadrant | BADHDUFLAG | Total packets | Discarded packets |
| A | 0 | 3 | 0 |
| B | 0 | 4 | 0 |
| C | 0 | 4 | 0 |
| D | 0 | 4 | 0 |
| Quadrant | Total seconds | Saturated seconds | Saturation percentage |
|---|---|---|---|
| A | 5525 | 15 | 0.271493% |
| B | 5525 | 31 | 0.561086% |
| C | 5525 | 63 | 1.140271% |
| D | 5525 | 724 | 13.104072% |
Noise dominated data is calculated using 1-second bins in cleaned event files. If a bin has >2000 counts, and if more than 50% of those come from <1% of pixels, then it is considered to be noise-dominated and hence unusable.
| Quadrant | # 1 sec bins | Bins with >0 counts | Bins with >2000 counts | High rate bins dominated by noise | Noise dominated (total time) | Noise dominated (detector-on time) | Marked lightcurve |
|---|---|---|---|---|---|---|---|
| A | 5525 | 5525 | 0 | 0 | 0.00% | 0.00% | 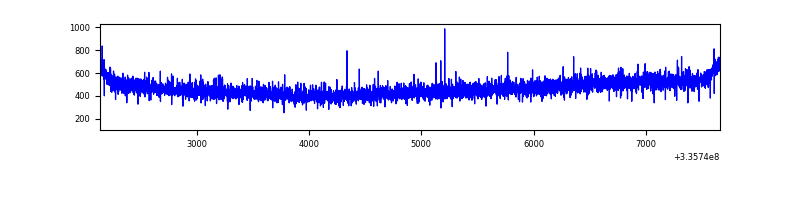 |
| B | 5525 | 5525 | 0 | 0 | 0.00% | 0.00% | 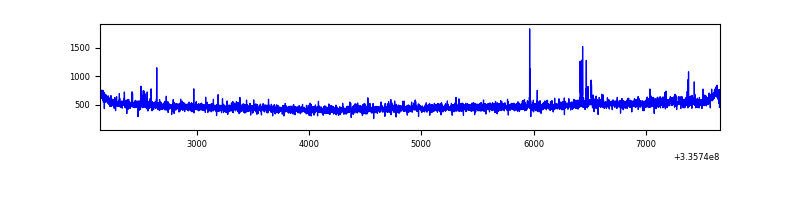 |
| C | 5525 | 5525 | 4 | 4 | 0.07% | 0.07% | 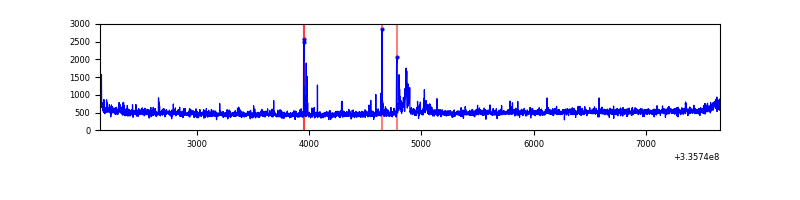 |
| D | 5525 | 5525 | 524 | 524 | 9.48% | 9.48% | 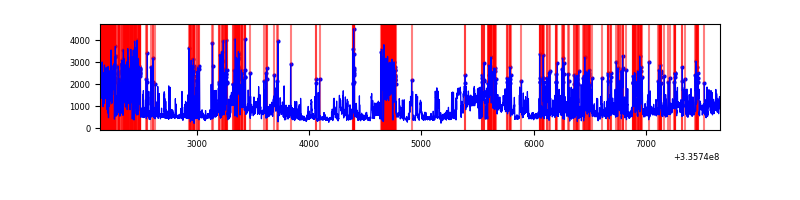 |
Top three noisy pixels from each quadrant. If the there are fewer than three noisy pixels in the level2.evt file, extra rows are filled as -1
| Pixel properties | Quadrant properties | ||||||
|---|---|---|---|---|---|---|---|
| Quadrant | DetID | PixID | Counts | Sigma | Mean | Median | Sigma |
| A | 13 | 254 | 9177 | 64.26 | 663 | 650 | 132.7 |
| A | 3 | 137 | 6017 | 40.44 | 663 | 650 | 132.7 |
| A | 0 | 226 | 5700 | 38.06 | 663 | 650 | 132.7 |
| B | 0 | 190 | 25625 | 199.16 | 663 | 647 | 125.4 |
| B | 12 | 111 | 14827 | 113.06 | 663 | 647 | 125.4 |
| B | 11 | 111 | 13098 | 99.28 | 663 | 647 | 125.4 |
| C | 3 | 233 | 192542 | 1288.59 | 640 | 646 | 148.9 |
| C | 14 | 238 | 102728 | 685.49 | 640 | 646 | 148.9 |
| C | 4 | 254 | 25748 | 168.56 | 640 | 646 | 148.9 |
| D | 1 | 52 | 2804441 | 19170.6 | 617 | 603 | 146.3 |
| D | 7 | 80 | 370553 | 2529.45 | 617 | 603 | 146.3 |
| D | 12 | 233 | 112443 | 764.68 | 617 | 603 | 146.3 |
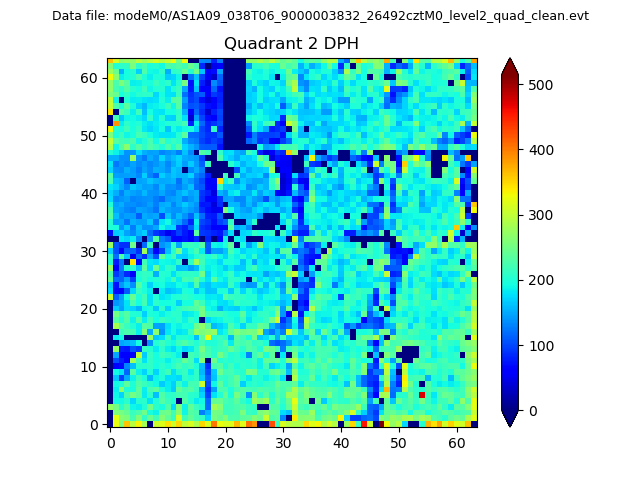
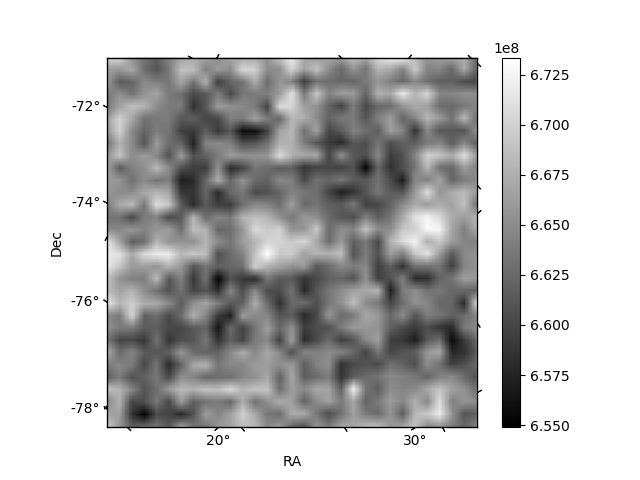
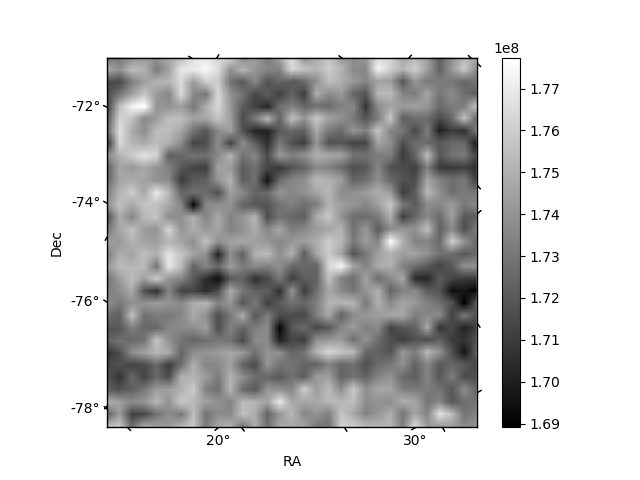
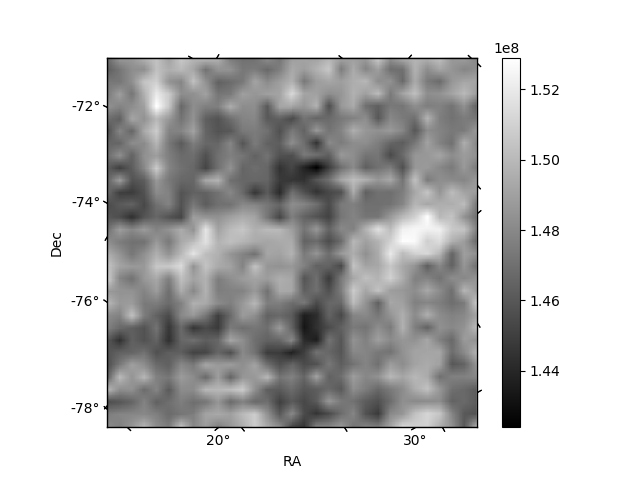
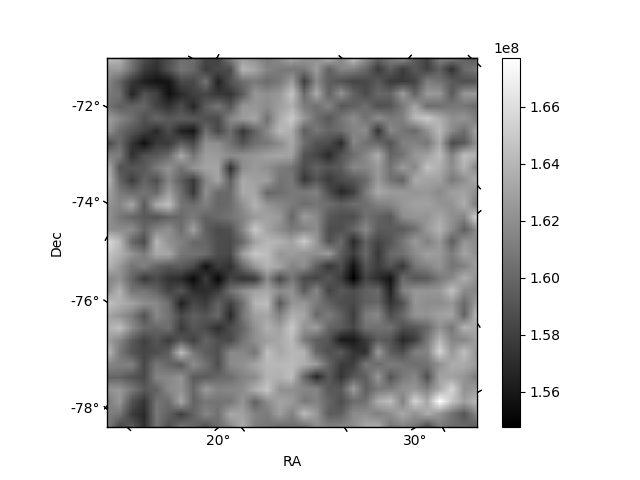
Histogram calculated using DETX and DETY for each event in the final _common_clean file
| Quadrant A | 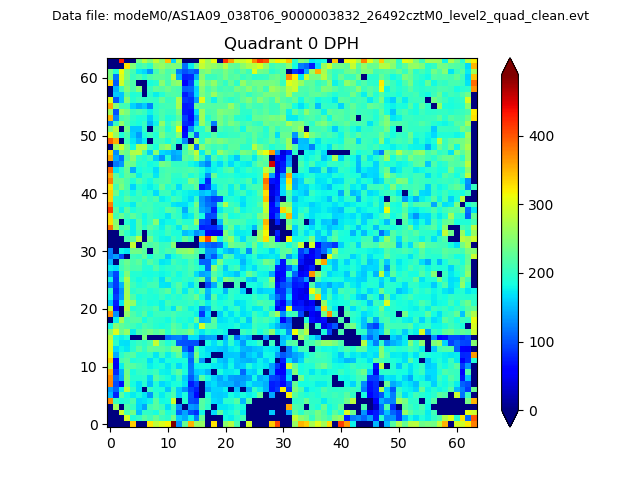 |
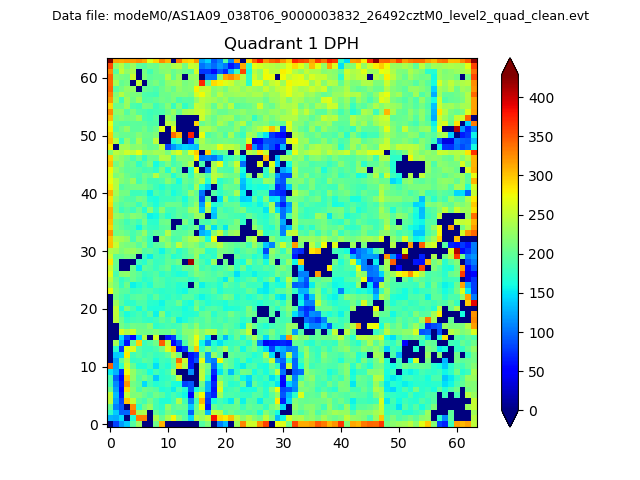 |
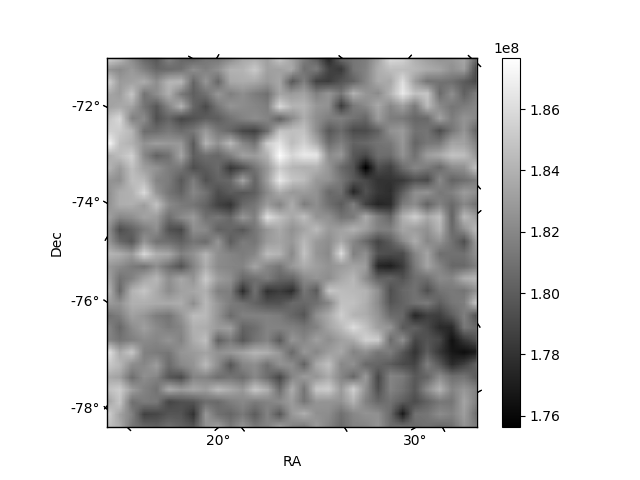
Quadrant B |
|---|---|---|---|
| Quadrant D | 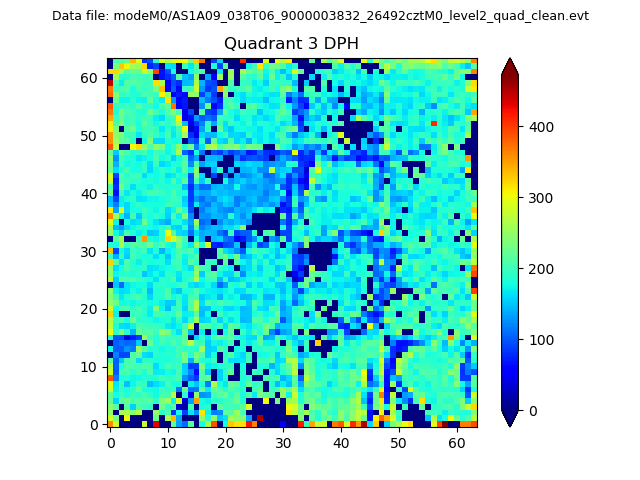 |
 |
Quadrant C |
| Plot type | Count rate plots | Images |
|---|---|---|
| Comparison with Poisson distribution Blue bars denote a histogram of data divided into 1 sec bins. Red curve is a Poisson curve with rate = median count rate of data. |
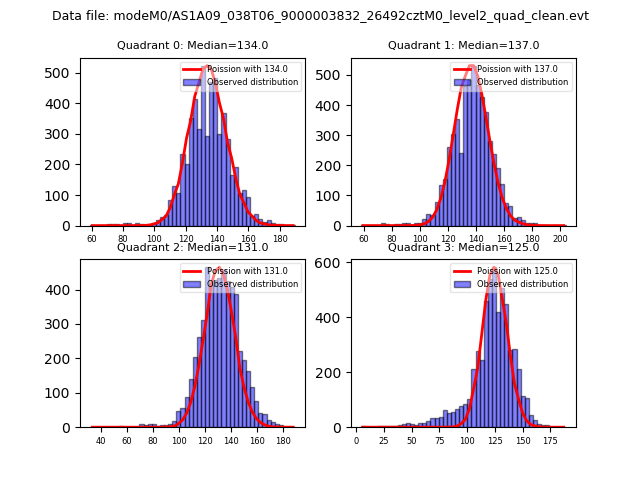 |
 |
| Quadrant-wise count rates Data is divided into 100 sec bins |
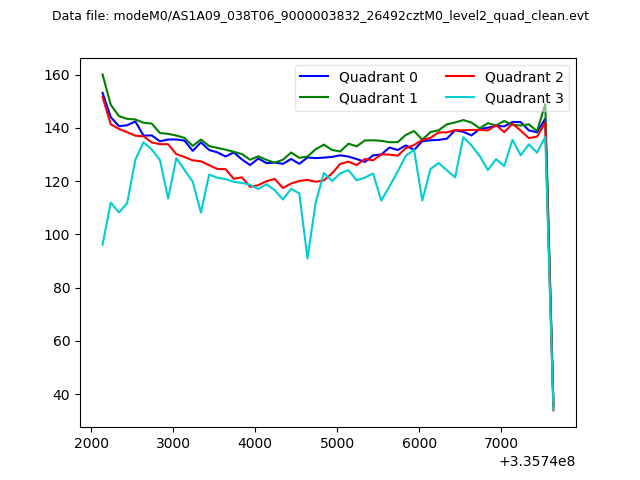 |
|
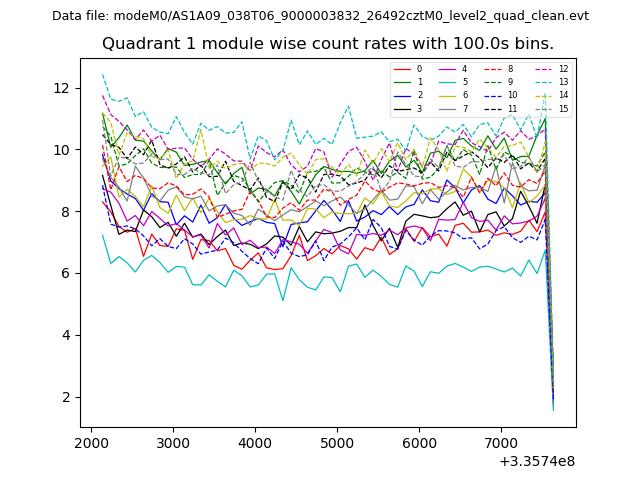
| Module-wise count rates for Quadrant A Data is divided into 100 sec bins |
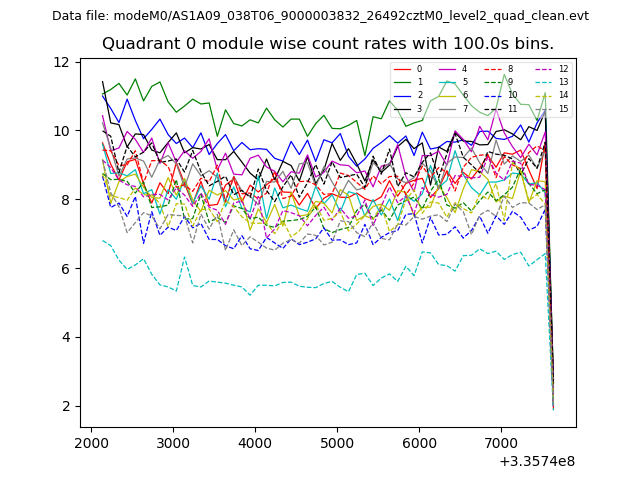 |
 |
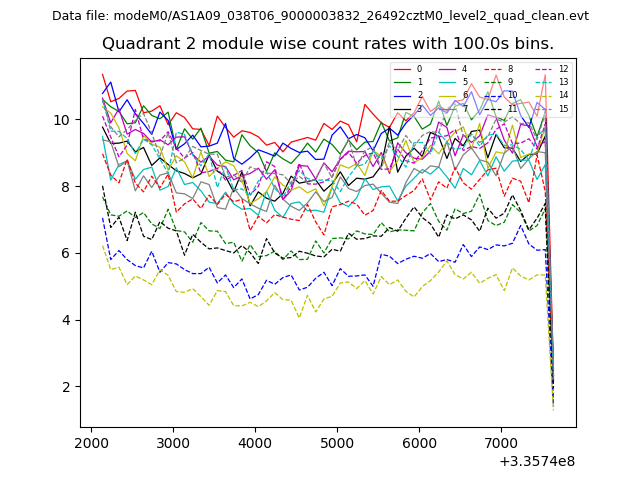
| Module-wise count rates for Quadrant B Data is divided into 100 sec bins |
 |
 |
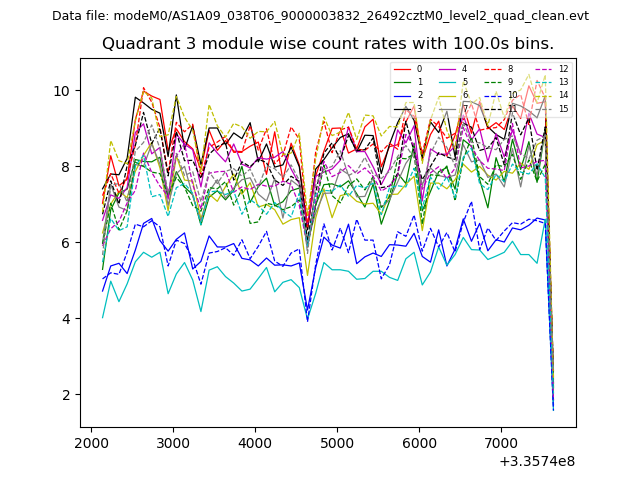
| Module-wise count rates for Quadrant C Data is divided into 100 sec bins |
 |
 |
| Module-wise count rates for Quadrant D Data is divided into 100 sec bins |
 |
 |
| Parameter | Plot |
|---|---|
| CZT HV Monitor | 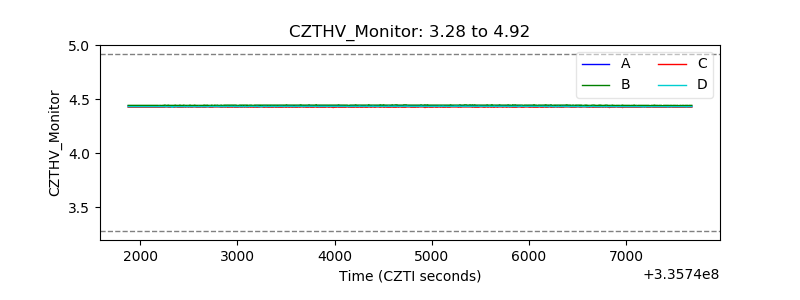 |
| D_VDD | 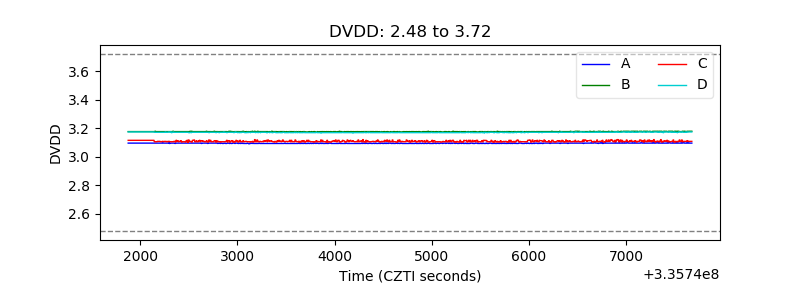 |
| Temperature 1 | 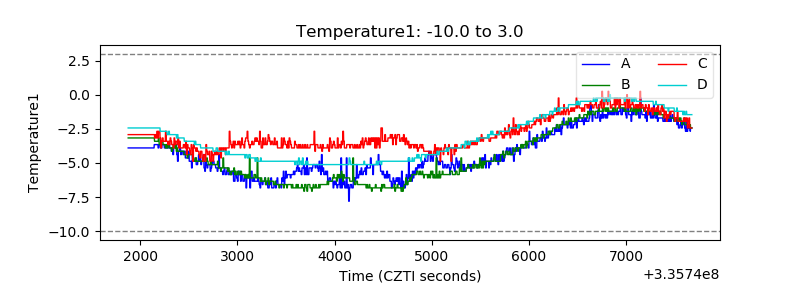 |
| Veto HV Monitor | 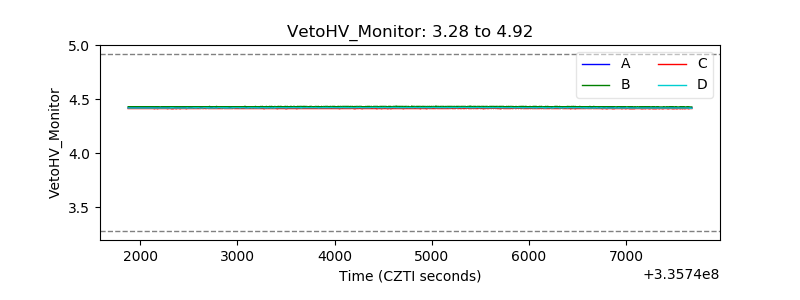 |
| Veto LLD | 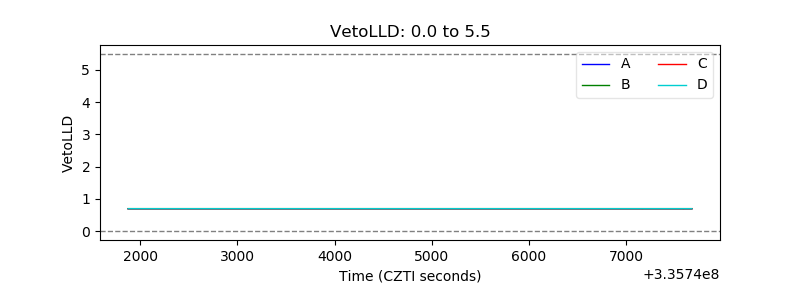 |
| Alpha Counter | 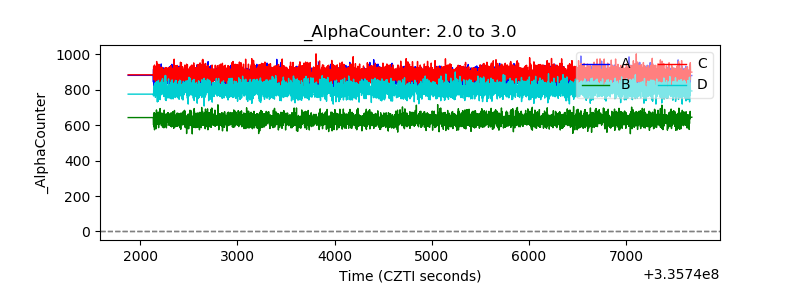 |
| _CPM_Rate | 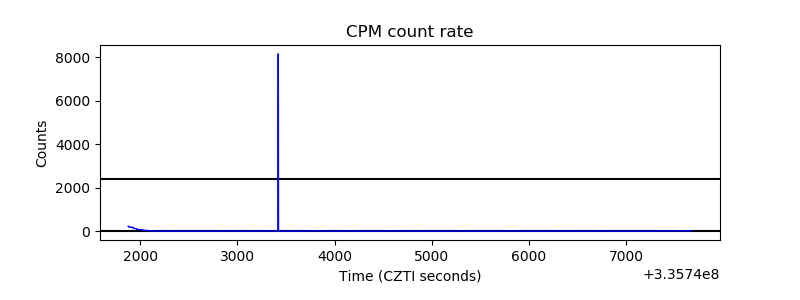 |
| CZT Counter | 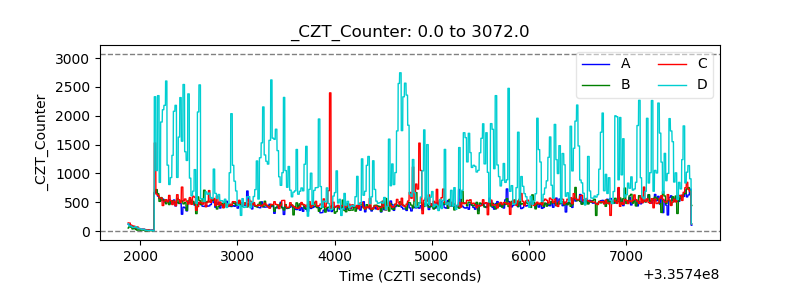 |
| +2.5 Volts monitor |  |
| +5 Volts monitor | 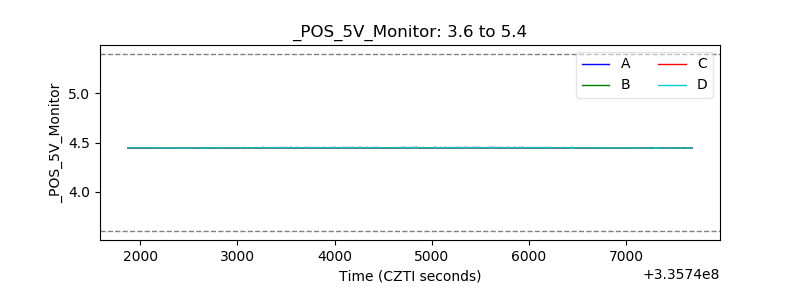 |
| _ROLL_ROT | 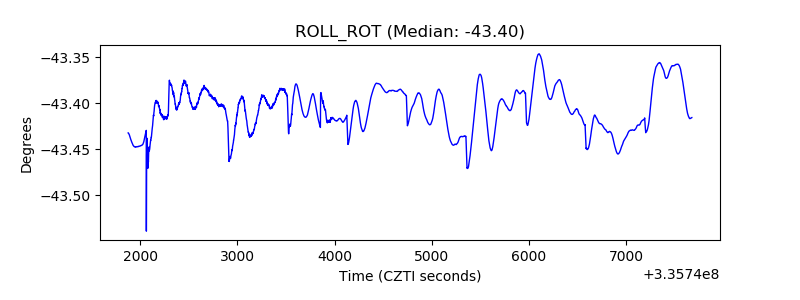 |
| _Roll_DEC | 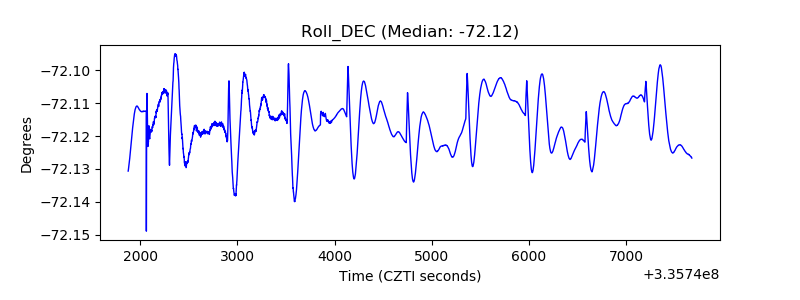 |
| _Roll_RA | 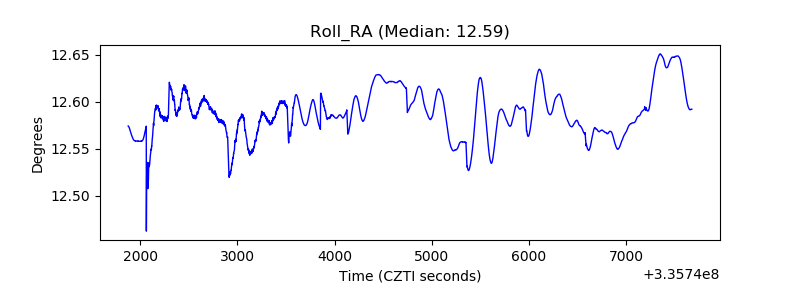 |
| Veto Counter | 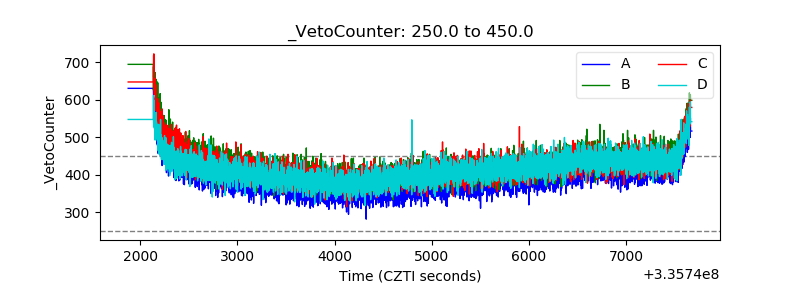 |