| Param | Original file | Final file |
|---|---|---|
| Filename | modeM0/AS1A09_038T06_9000003832_26671cztM0_level2.evt | modeM0/AS1A09_038T06_9000003832_26671cztM0_level2_quad_clean.evt |
| Size (bytes) | 759,744,000 | 150,759,360 |
| Size | 724.5 MB | 143.8 MB |
| Events in quadrant A | 4,725,887 | 1,095,935 |
| Events in quadrant B | 4,130,246 | 1,131,266 |
| Events in quadrant C | 4,090,377 | 1,081,794 |
| Events in quadrant D | 9,518,900 | 698,037 |
| Mode M0 | |||
|---|---|---|---|
| Quadrant | BADHDUFLAG | Total packets | Discarded packets |
| A | 0 | 19324 | 0 |
| B | 0 | 17447 | 0 |
| C | 0 | 17164 | 0 |
| D | 0 | 33420 | 0 |
| Mode M9 | |||
|---|---|---|---|
| Quadrant | BADHDUFLAG | Total packets | Discarded packets |
| A | 0 | 14 | 0 |
| B | 0 | 14 | 0 |
| C | 0 | 14 | 1 |
| D | 0 | 14 | 0 |
| Quadrant | Total seconds | Saturated seconds | Saturation percentage |
|---|---|---|---|
| A | 7949 | 70 | 0.880614% |
| B | 8068 | 81 | 1.003966% |
| C | 8047 | 129 | 1.603082% |
| D | 7486 | 2516 | 33.609404% |
Noise dominated data is calculated using 1-second bins in cleaned event files. If a bin has >2000 counts, and if more than 50% of those come from <1% of pixels, then it is considered to be noise-dominated and hence unusable.
| Quadrant | # 1 sec bins | Bins with >0 counts | Bins with >2000 counts | High rate bins dominated by noise | Noise dominated (total time) | Noise dominated (detector-on time) | Marked lightcurve |
|---|---|---|---|---|---|---|---|
| A | 11551 | 8515 | 0 | 0 | 0.00% | 0.00% | 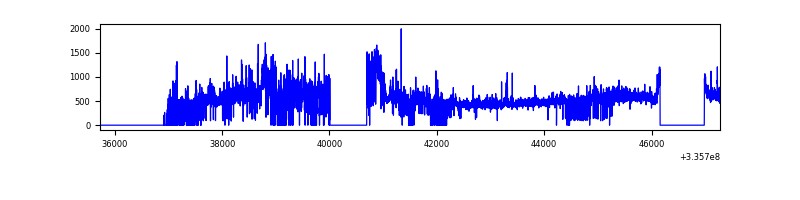 |
| B | 10351 | 8592 | 12 | 12 | 0.12% | 0.14% | 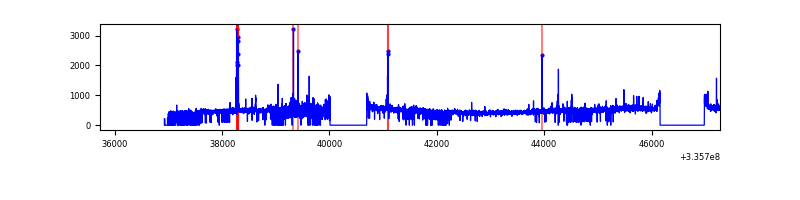 |
| C | 10357 | 8576 | 2 | 2 | 0.02% | 0.02% | 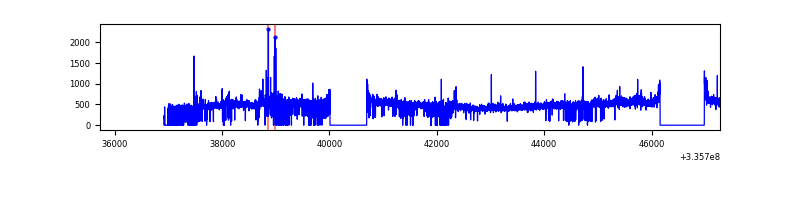 |
| D | 10362 | 7954 | 1375 | 1375 | 13.27% | 17.29% | 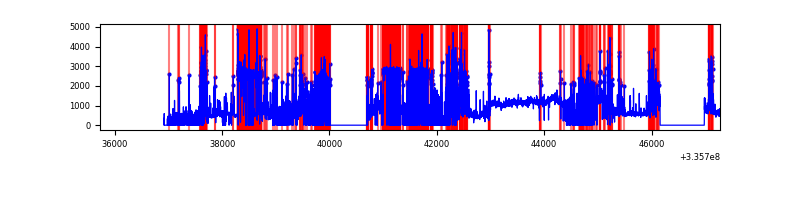 |
Top three noisy pixels from each quadrant. If the there are fewer than three noisy pixels in the level2.evt file, extra rows are filled as -1
| Pixel properties | Quadrant properties | ||||||
|---|---|---|---|---|---|---|---|
| Quadrant | DetID | PixID | Counts | Sigma | Mean | Median | Sigma |
| A | 0 | 13 | 440189 | 2164.33 | 997 | 981 | 202.9 |
| A | 13 | 170 | 435449 | 2140.98 | 997 | 981 | 202.9 |
| A | 13 | 254 | 13538 | 61.88 | 997 | 981 | 202.9 |
| B | 15 | 33 | 53710 | 272.69 | 1006 | 982 | 193.4 |
| B | 0 | 189 | 38720 | 195.17 | 1006 | 982 | 193.4 |
| B | 10 | 251 | 33397 | 167.64 | 1006 | 982 | 193.4 |
| C | 14 | 238 | 153780 | 670.57 | 964 | 972 | 227.9 |
| C | 3 | 233 | 111176 | 483.61 | 964 | 972 | 227.9 |
| C | 2 | 16 | 59839 | 258.33 | 964 | 972 | 227.9 |
| D | 7 | 80 | 6143952 | 37021.22 | 674 | 655 | 165.9 |
| D | 2 | 250 | 359937 | 2165.13 | 674 | 655 | 165.9 |
| D | 1 | 52 | 333382 | 2005.11 | 674 | 655 | 165.9 |
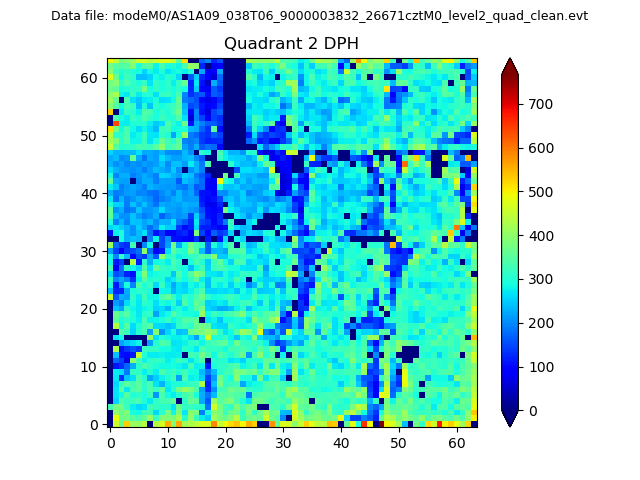
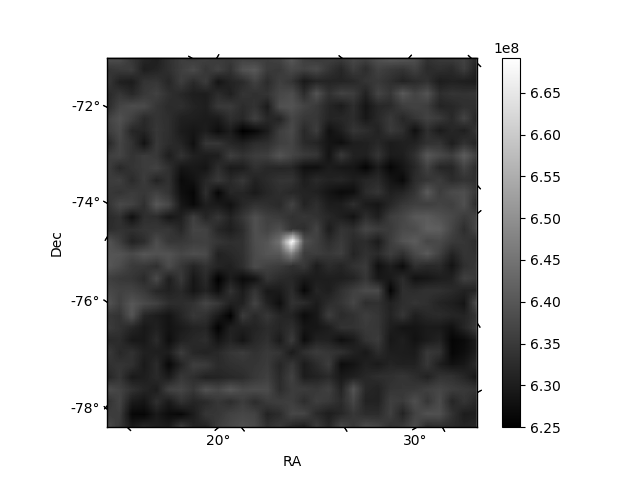
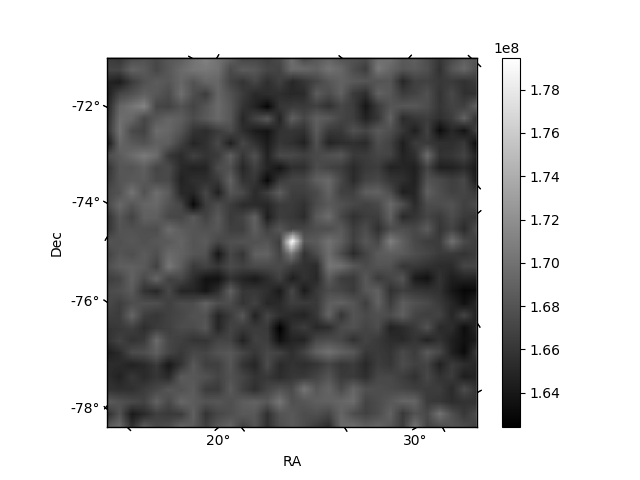
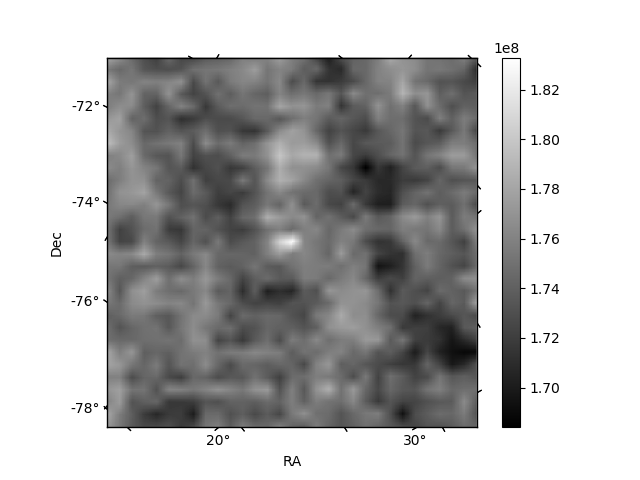
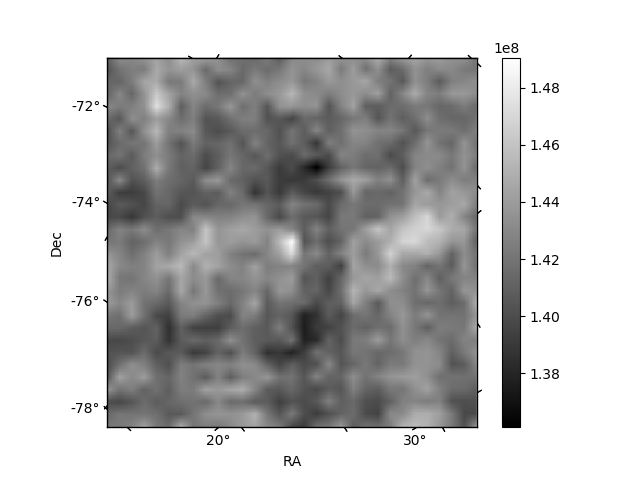
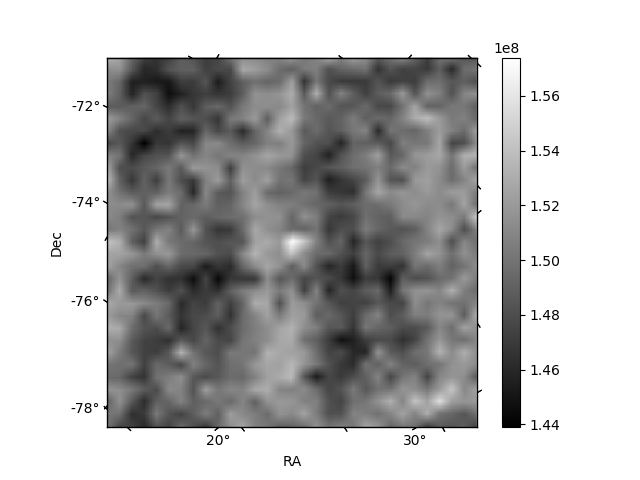
Histogram calculated using DETX and DETY for each event in the final _common_clean file
| Quadrant A | 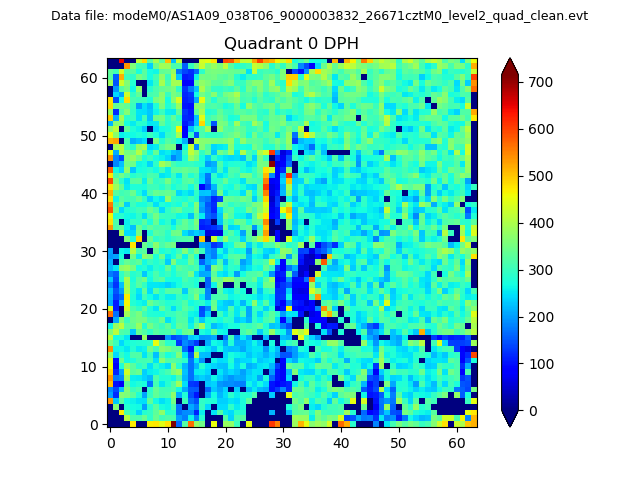 |
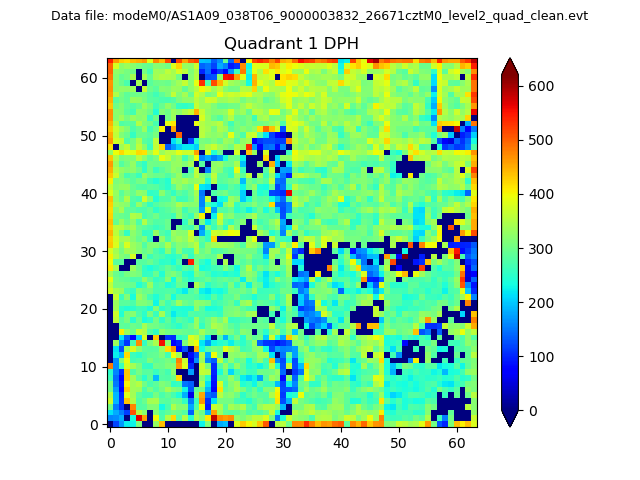 |
Quadrant B |
|---|---|---|---|
| Quadrant D | 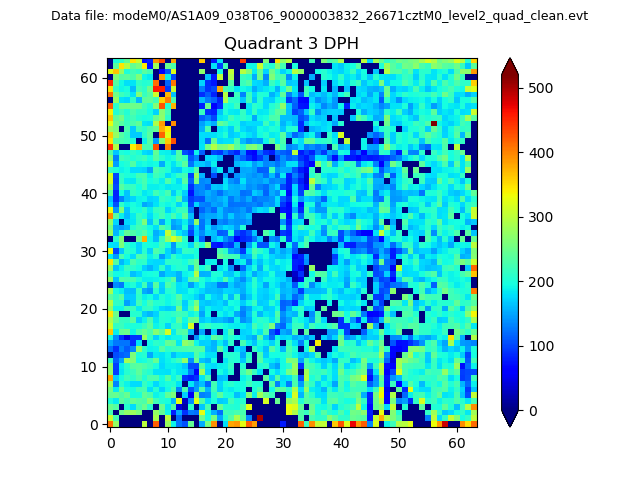 |
 |
Quadrant C |
| Plot type | Count rate plots | Images |
|---|---|---|
| Comparison with Poisson distribution Blue bars denote a histogram of data divided into 1 sec bins. Red curve is a Poisson curve with rate = median count rate of data. |
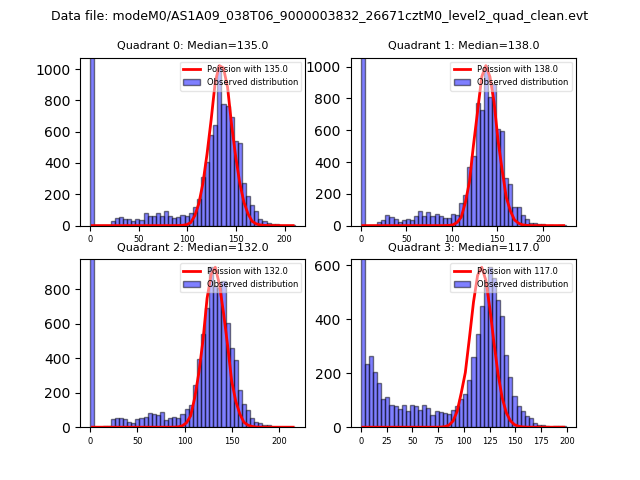 |
 |
| Quadrant-wise count rates Data is divided into 100 sec bins |
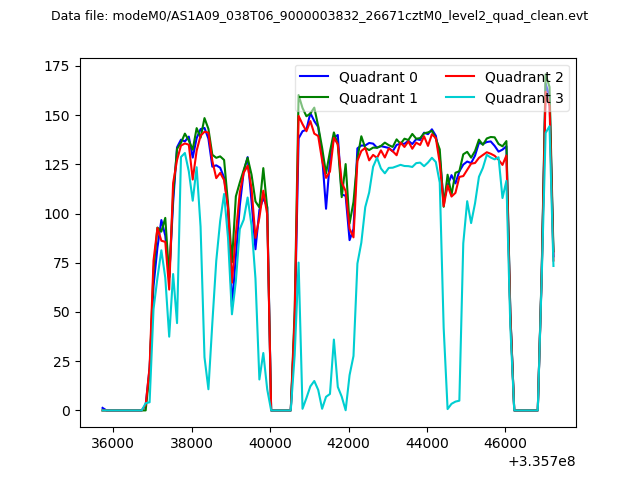 |
|
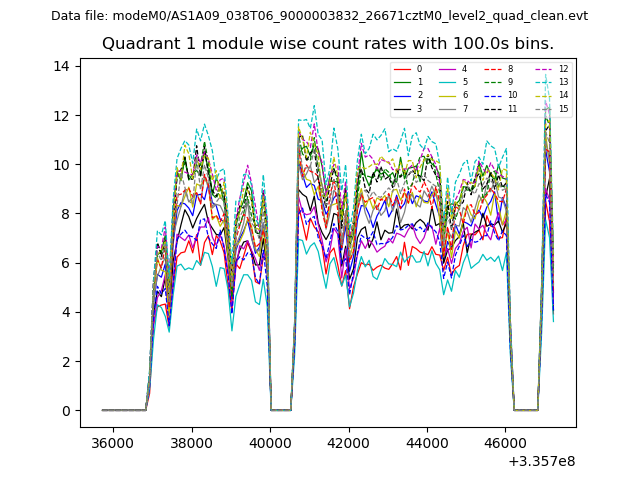
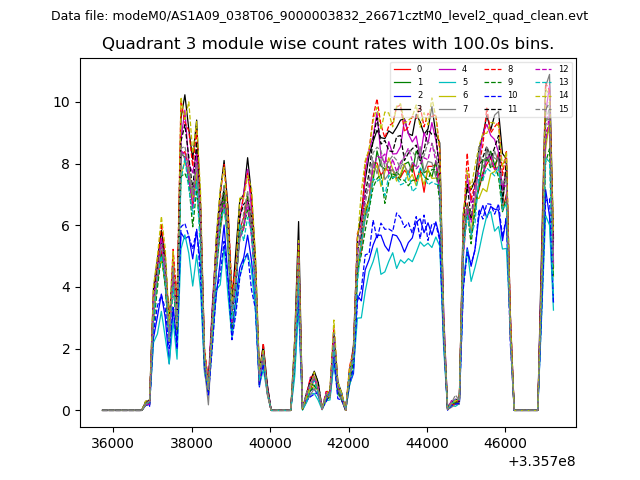
| Module-wise count rates for Quadrant A Data is divided into 100 sec bins |
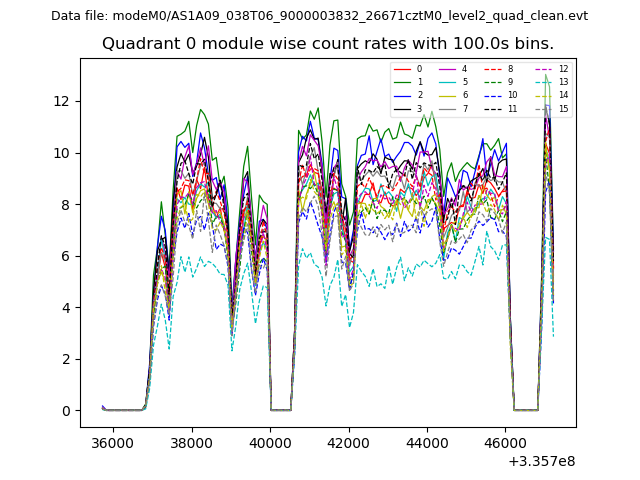 |
 |
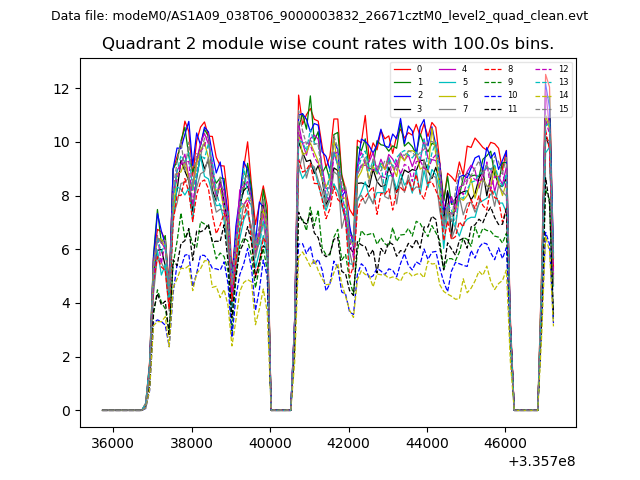
| Module-wise count rates for Quadrant B Data is divided into 100 sec bins |
 |
 |
| Module-wise count rates for Quadrant C Data is divided into 100 sec bins |
 |
 |
| Module-wise count rates for Quadrant D Data is divided into 100 sec bins |
 |
 |
| Parameter | Plot |
|---|---|
| CZT HV Monitor | 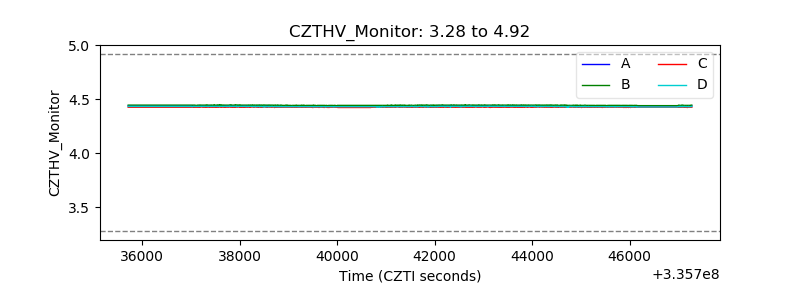 |
| D_VDD | 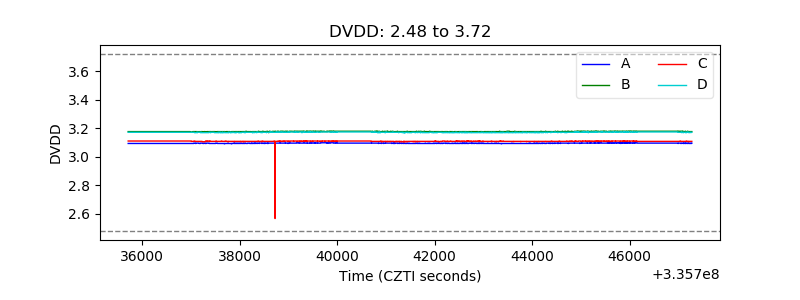 |
| Temperature 1 | 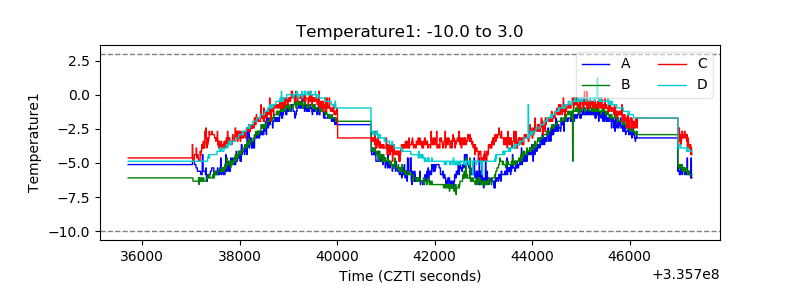 |
| Veto HV Monitor | 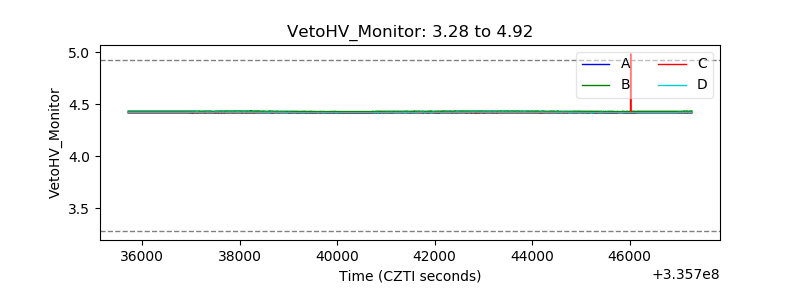 |
| Veto LLD | 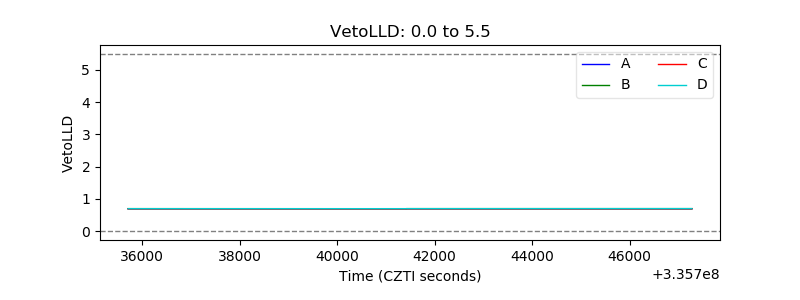 |
| Alpha Counter | 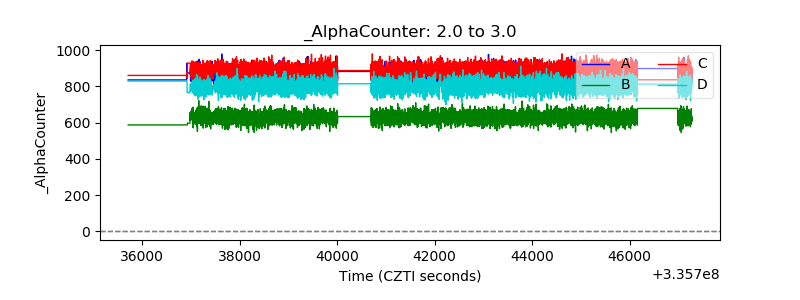 |
| _CPM_Rate | 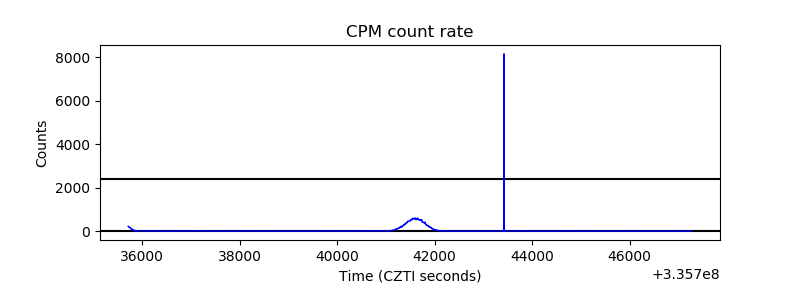 |
| CZT Counter | 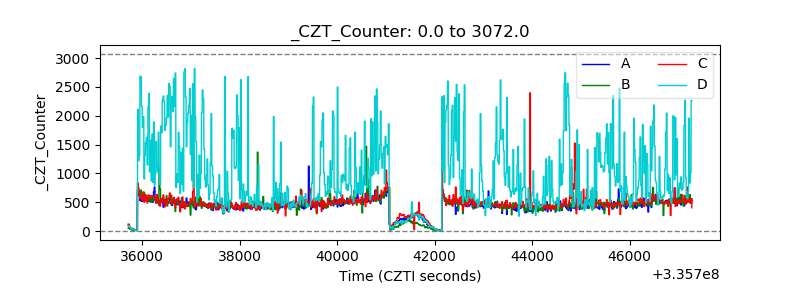 |
| +2.5 Volts monitor | 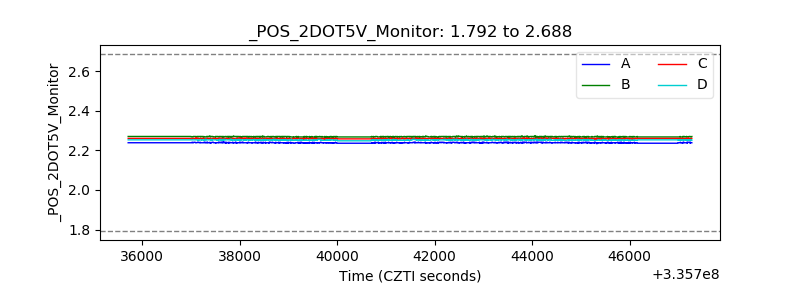 |
| +5 Volts monitor |  |
| _ROLL_ROT | 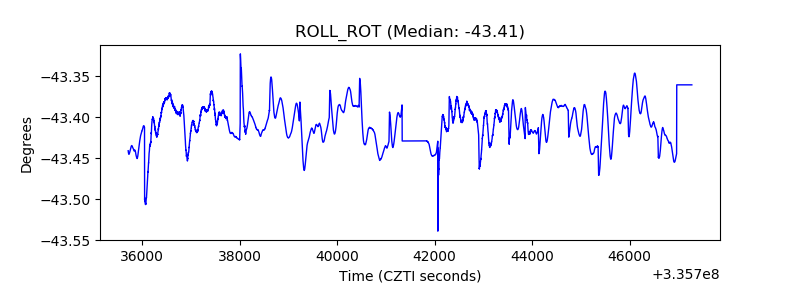 |
| _Roll_DEC | 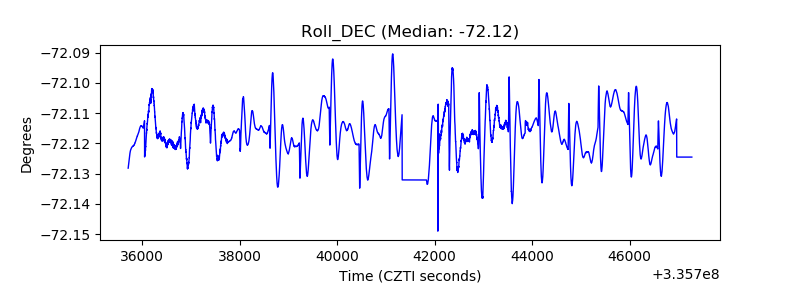 |
| _Roll_RA | 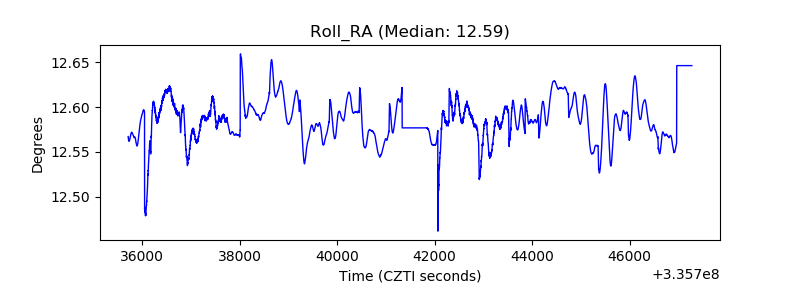 |
| Veto Counter | 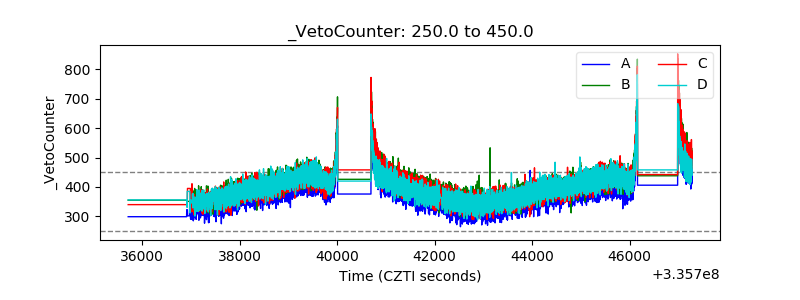 |