| Param | Original file | Final file |
|---|---|---|
| Filename | modeM0/AS1A09_120T02_9000003834cztM0_level2.fits | modeM0/AS1A09_120T02_9000003834cztM0_level2_quad_clean.evt |
| Size (bytes) | 29,468,160 | 36,051,840 |
| Size | 28.1 MB | 34.4 MB |
| Events in quadrant A | 180,268 | 235,632 |
| Events in quadrant B | 174,042 | 237,166 |
| Events in quadrant C | 174,408 | 224,562 |
| Events in quadrant D | 140,948 | 170,895 |
| Mode SS | |||
|---|---|---|---|
| Quadrant | BADHDUFLAG | Total packets | Discarded packets |
| A | 0 | 64 | 0 |
| B | 0 | 64 | 0 |
| C | 0 | 64 | 0 |
| D | 0 | 64 | 0 |
| Mode M0 | |||
|---|---|---|---|
| Quadrant | BADHDUFLAG | Total packets | Discarded packets |
| A | 0 | 6287 | 0 |
| B | 0 | 6307 | 0 |
| C | 0 | 6501 | 0 |
| D | 0 | 13986 | 0 |
| Quadrant | Total seconds | Saturated seconds | Saturation percentage |
|---|---|---|---|
| A | 3126 | 3 | 0.095969% |
| B | 3126 | 4 | 0.127959% |
| C | 3126 | 13 | 0.415867% |
| D | 3126 | 509 | 16.282790% |
Noise dominated data is calculated using 1-second bins in cleaned event files. If a bin has >2000 counts, and if more than 50% of those come from <1% of pixels, then it is considered to be noise-dominated and hence unusable.
| Quadrant | # 1 sec bins | Bins with >0 counts | Bins with >2000 counts | High rate bins dominated by noise | Noise dominated (total time) | Noise dominated (detector-on time) | Marked lightcurve |
|---|---|---|---|---|---|---|---|
| A | 3126 | 3126 | 0 | 0 | 0.00% | 0.00% |  |
| B | 3126 | 3126 | 0 | 0 | 0.00% | 0.00% |  |
| C | 3126 | 3126 | 0 | 0 | 0.00% | 0.00% |  |
| D | 3126 | 3126 | 0 | 0 | 0.00% | 0.00% |  |
Top three noisy pixels from each quadrant. If the there are fewer than three noisy pixels in the level2.evt file, extra rows are filled as -1
| Pixel properties | Quadrant properties | ||||||
|---|---|---|---|---|---|---|---|
| Quadrant | DetID | PixID | Counts | Sigma | Mean | Median | Sigma |
| A | 14 | 188 | 198 | 11.77 | 46 | 44 | 13.1 |
| A | 0 | 29 | 198 | 11.77 | 46 | 44 | 13.1 |
| A | 14 | 204 | 157 | 8.63 | 46 | 44 | 13.1 |
| B | 2 | 9 | 140 | 8.33 | 46 | 44 | 11.5 |
| B | 5 | 128 | 129 | 7.37 | 46 | 44 | 11.5 |
| B | 3 | 80 | 124 | 6.94 | 46 | 44 | 11.5 |
| C | 1 | 81 | 151 | 7.82 | 46 | 43 | 13.8 |
| C | 1 | 80 | 151 | 7.82 | 46 | 43 | 13.8 |
| C | 3 | 202 | 137 | 6.8 | 46 | 43 | 13.8 |
| D | 15 | 46 | 109 | 5.87 | 40 | 36 | 12.4 |
| D | 6 | 8 | 104 | 5.47 | 40 | 36 | 12.4 |
| D | 15 | 62 | 103 | 5.39 | 40 | 36 | 12.4 |
Histogram calculated using DETX and DETY for each event in the final _common_clean file
| Quadrant A | 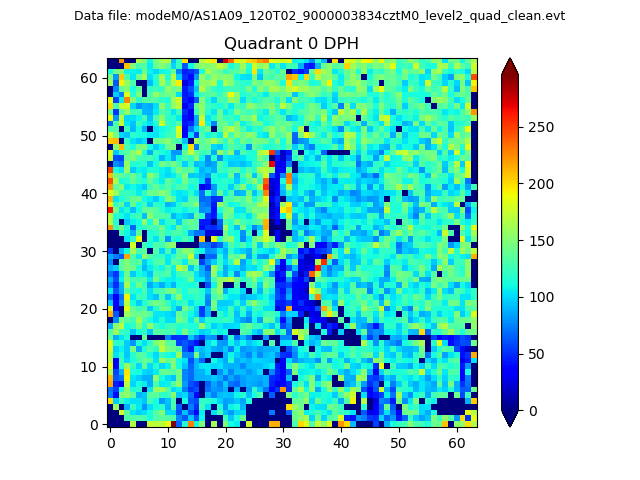 |
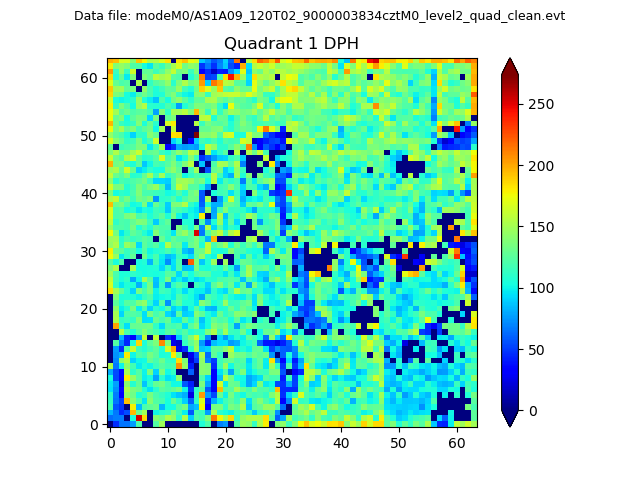 |
Quadrant B |
|---|---|---|---|
| Quadrant D |  |
 |
Quadrant C |
| Plot type | Count rate plots | Images |
|---|---|---|
| Comparison with Poisson distribution Blue bars denote a histogram of data divided into 1 sec bins. Red curve is a Poisson curve with rate = median count rate of data. |
 |
 |
| Quadrant-wise count rates Data is divided into 100 sec bins |
 |
|
| Module-wise count rates for Quadrant A Data is divided into 100 sec bins |
 |
 |
| Module-wise count rates for Quadrant B Data is divided into 100 sec bins |
 |
 |
| Module-wise count rates for Quadrant C Data is divided into 100 sec bins |
 |
 |
| Module-wise count rates for Quadrant D Data is divided into 100 sec bins |
 |
 |
| Parameter | Plot |
|---|---|
| CZT HV Monitor |  |
| D_VDD |  |
| Temperature 1 |  |
| Veto HV Monitor |  |
| Veto LLD |  |
| Alpha Counter |  |
| _CPM_Rate | 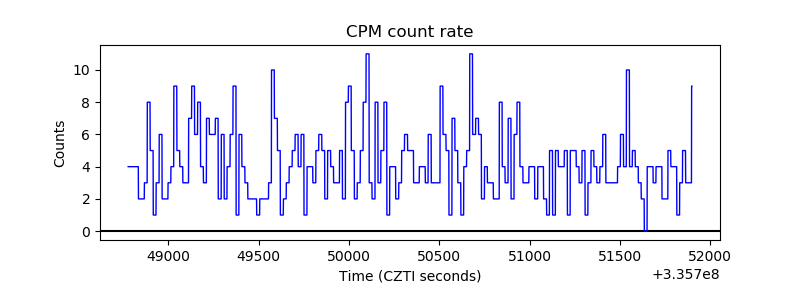 |
| CZT Counter |  |
| +2.5 Volts monitor |  |
| +5 Volts monitor |  |
| _ROLL_ROT |  |
| _Roll_DEC | 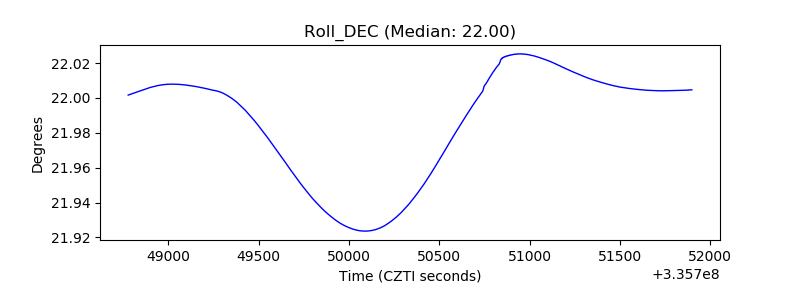 |
| _Roll_RA | 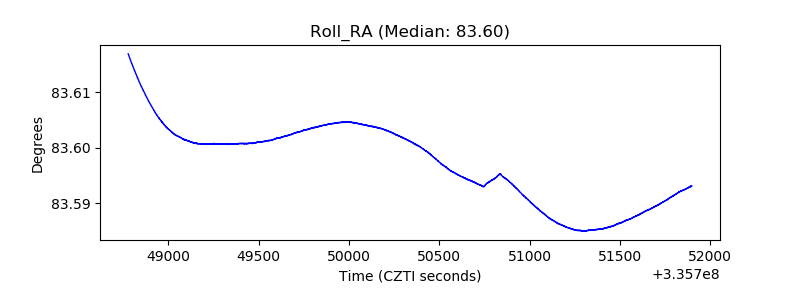 |
| Veto Counter |  |