| Param | Original file | Final file |
|---|---|---|
| Filename | modeM0/AS1A09_120T02_9000003834_26492cztM0_level2.evt | modeM0/AS1A09_120T02_9000003834_26492cztM0_level2_quad_clean.evt |
| Size (bytes) | 102,689,280 | 20,304,000 |
| Size | 97.9 MB | 19.4 MB |
| Events in quadrant A | 508,127 | 140,425 |
| Events in quadrant B | 523,119 | 142,645 |
| Events in quadrant C | 549,136 | 135,787 |
| Events in quadrant D | 1,457,211 | 116,947 |
| Mode M0 | |||
|---|---|---|---|
| Quadrant | BADHDUFLAG | Total packets | Discarded packets |
| A | 0 | 2058 | 0 |
| B | 0 | 2079 | 0 |
| C | 0 | 2181 | 0 |
| D | 0 | 5049 | 0 |
| Quadrant | Total seconds | Saturated seconds | Saturation percentage |
|---|---|---|---|
| A | 1015 | 1 | 0.098522% |
| B | 1015 | 3 | 0.295567% |
| C | 1015 | 9 | 0.886700% |
| D | 1014 | 280 | 27.613412% |
Noise dominated data is calculated using 1-second bins in cleaned event files. If a bin has >2000 counts, and if more than 50% of those come from <1% of pixels, then it is considered to be noise-dominated and hence unusable.
| Quadrant | # 1 sec bins | Bins with >0 counts | Bins with >2000 counts | High rate bins dominated by noise | Noise dominated (total time) | Noise dominated (detector-on time) | Marked lightcurve |
|---|---|---|---|---|---|---|---|
| A | 1015 | 1015 | 0 | 0 | 0.00% | 0.00% | 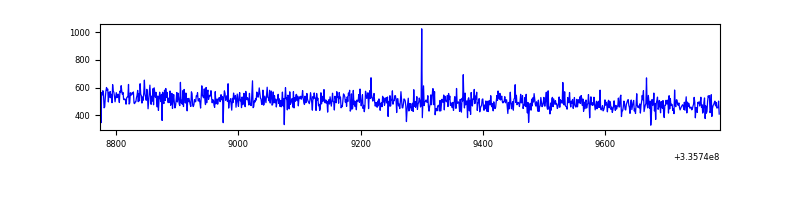 |
| B | 1015 | 1015 | 0 | 0 | 0.00% | 0.00% | 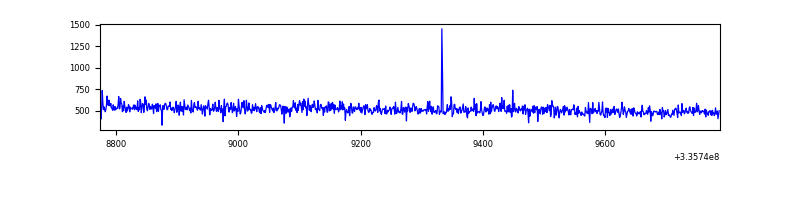 |
| C | 1015 | 1015 | 0 | 0 | 0.00% | 0.00% | 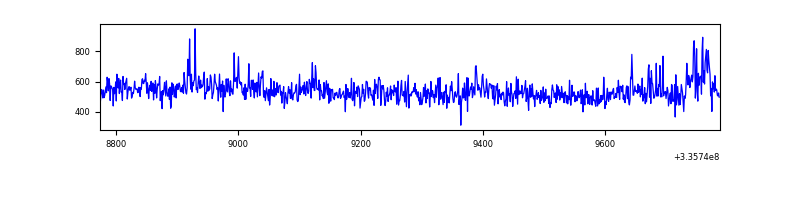 |
| D | 1014 | 1014 | 230 | 230 | 22.68% | 22.68% | 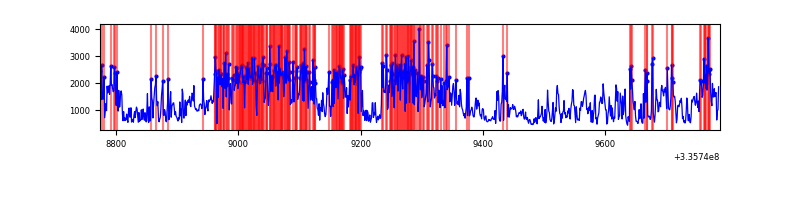 |
Top three noisy pixels from each quadrant. If the there are fewer than three noisy pixels in the level2.evt file, extra rows are filled as -1
| Pixel properties | Quadrant properties | ||||||
|---|---|---|---|---|---|---|---|
| Quadrant | DetID | PixID | Counts | Sigma | Mean | Median | Sigma |
| A | 13 | 254 | 1639 | 52.16 | 131 | 129 | 28.9 |
| A | 3 | 137 | 1193 | 36.76 | 131 | 129 | 28.9 |
| A | 0 | 226 | 1106 | 33.75 | 131 | 129 | 28.9 |
| B | 12 | 111 | 3065 | 104.86 | 132 | 129 | 28.0 |
| B | 11 | 111 | 2706 | 92.04 | 132 | 129 | 28.0 |
| B | 14 | 111 | 2464 | 83.39 | 132 | 129 | 28.0 |
| C | 3 | 233 | 28572 | 870.98 | 128 | 128 | 32.7 |
| C | 14 | 238 | 20751 | 631.5 | 128 | 128 | 32.7 |
| C | 13 | 61 | 873 | 22.81 | 128 | 128 | 32.7 |
| D | 1 | 52 | 577682 | 18839.97 | 118 | 115 | 30.7 |
| D | 12 | 233 | 260312 | 8487.51 | 118 | 115 | 30.7 |
| D | 7 | 80 | 161062 | 5250.02 | 118 | 115 | 30.7 |
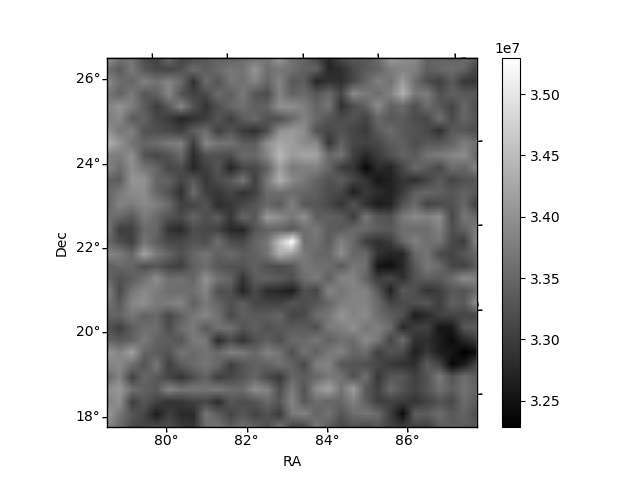
Histogram calculated using DETX and DETY for each event in the final _common_clean file
| Quadrant A | 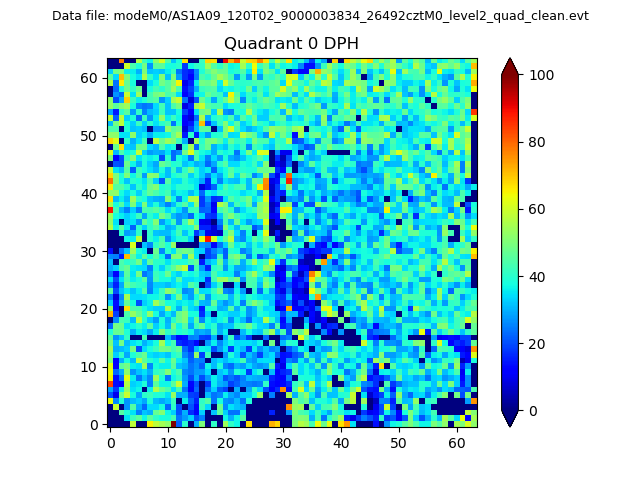 |
 |
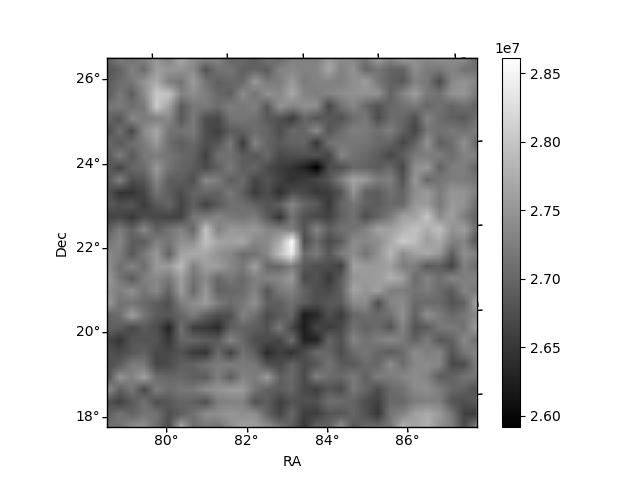
Quadrant B |
|---|---|---|---|
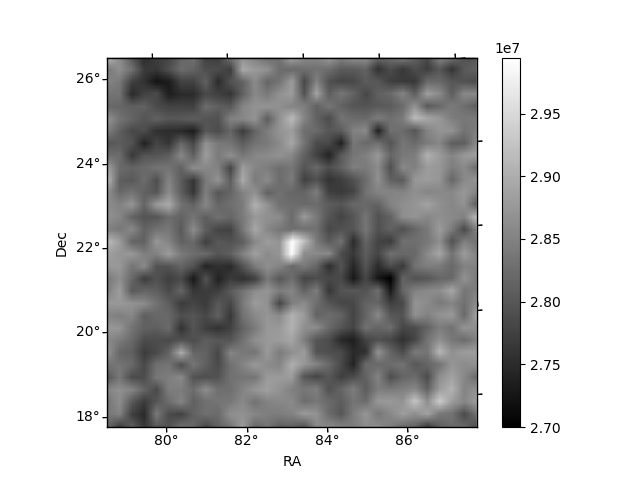
| Quadrant D | 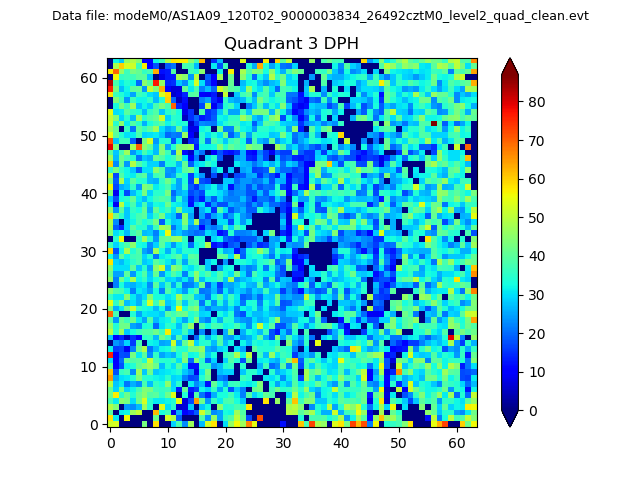 |
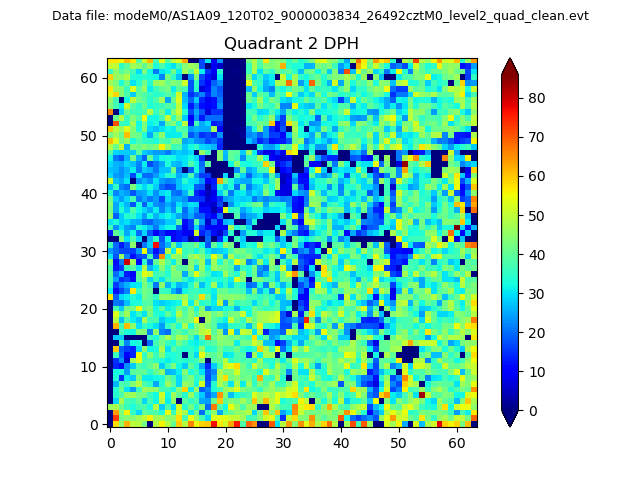 |
Quadrant C |
| Plot type | Count rate plots | Images |
|---|---|---|
| Comparison with Poisson distribution Blue bars denote a histogram of data divided into 1 sec bins. Red curve is a Poisson curve with rate = median count rate of data. |
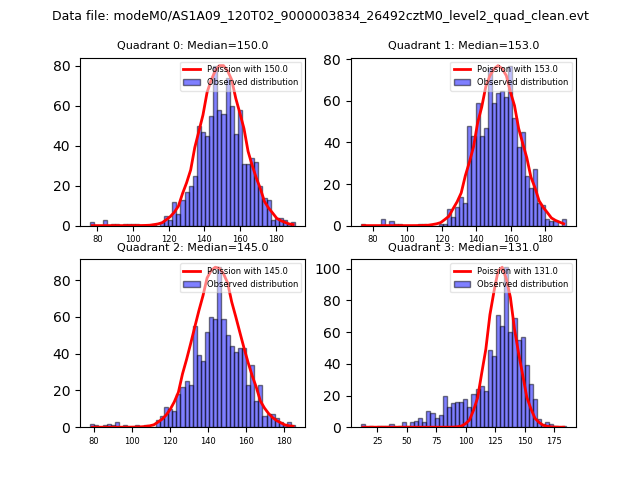 |
 |
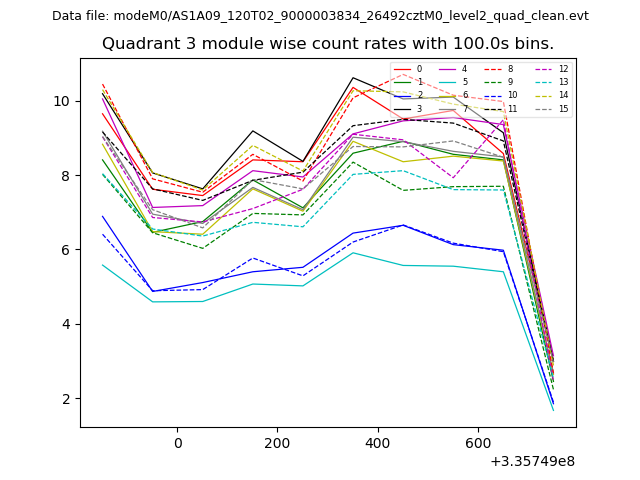
| Quadrant-wise count rates Data is divided into 100 sec bins |
 |
|
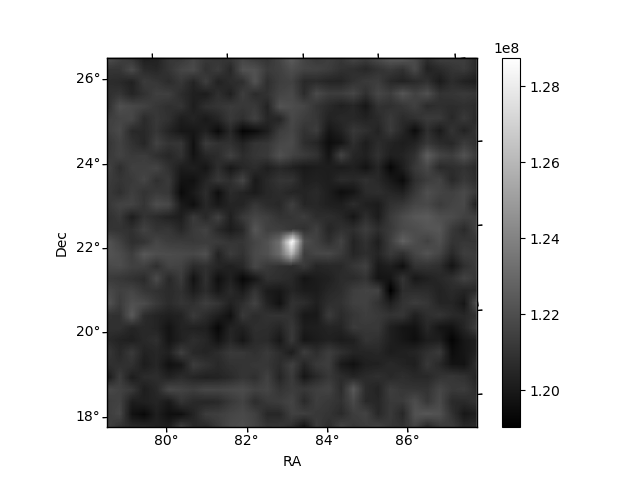
| Module-wise count rates for Quadrant A Data is divided into 100 sec bins |
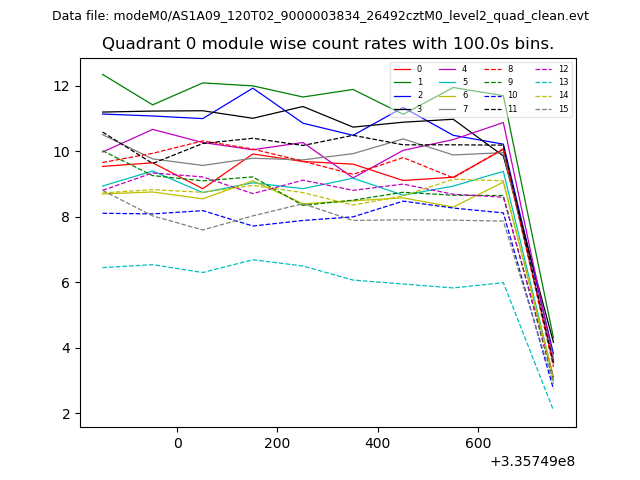 |
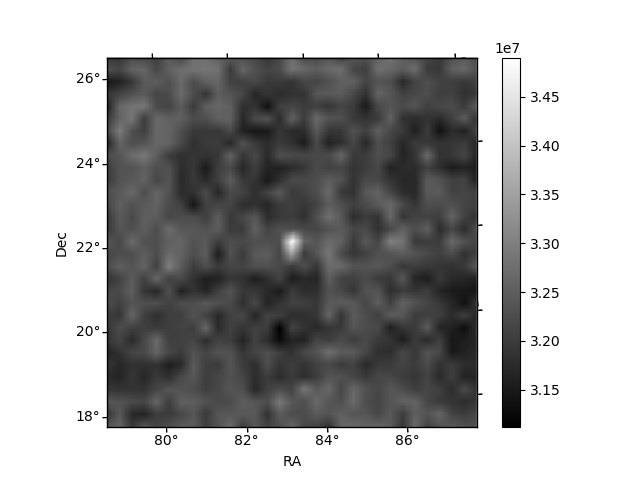 |
| Module-wise count rates for Quadrant B Data is divided into 100 sec bins |
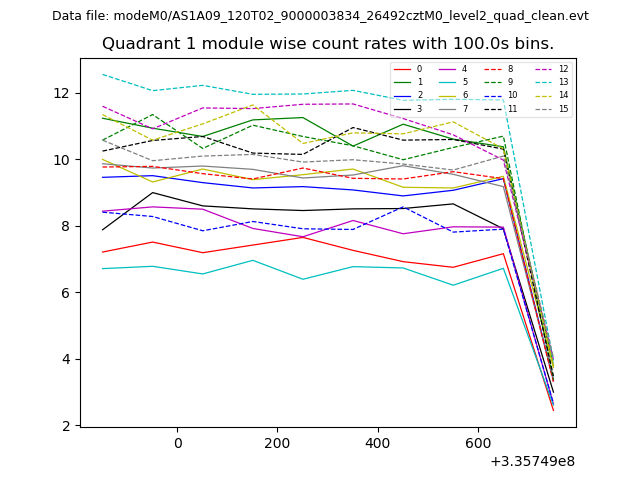 |
 |
| Module-wise count rates for Quadrant C Data is divided into 100 sec bins |
 |
 |
| Module-wise count rates for Quadrant D Data is divided into 100 sec bins |
 |
 |
| Parameter | Plot |
|---|---|
| CZT HV Monitor | 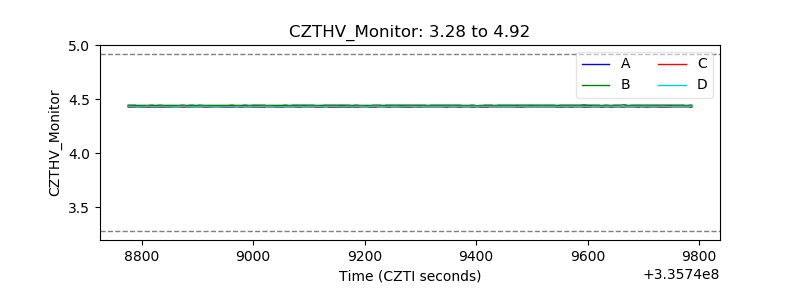 |
| D_VDD | 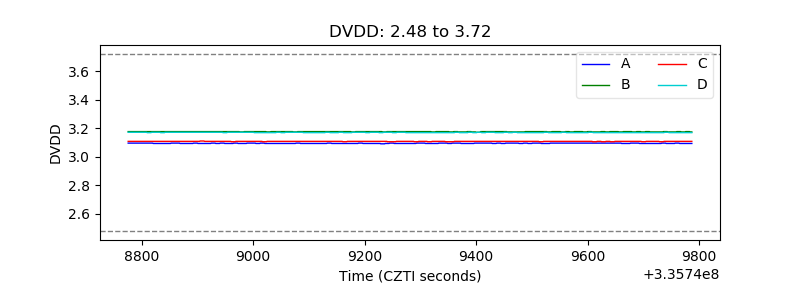 |
| Temperature 1 | 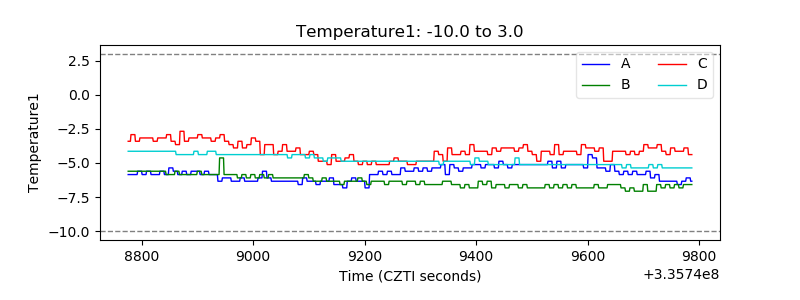 |
| Veto HV Monitor | 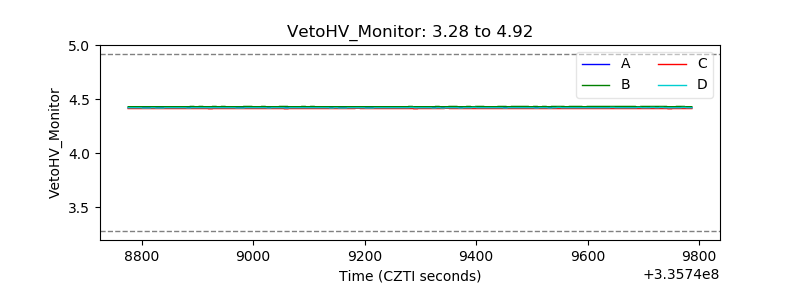 |
| Veto LLD | 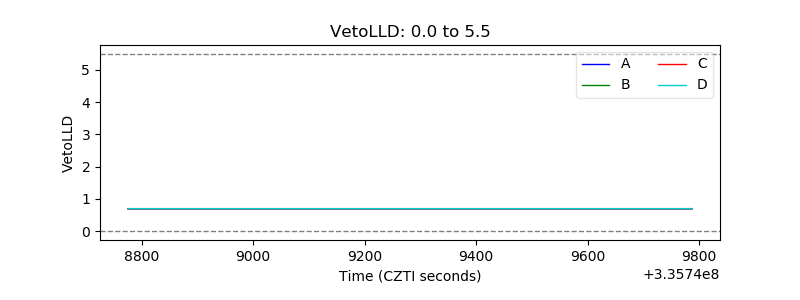 |
| Alpha Counter |  |
| _CPM_Rate |  |
| CZT Counter | 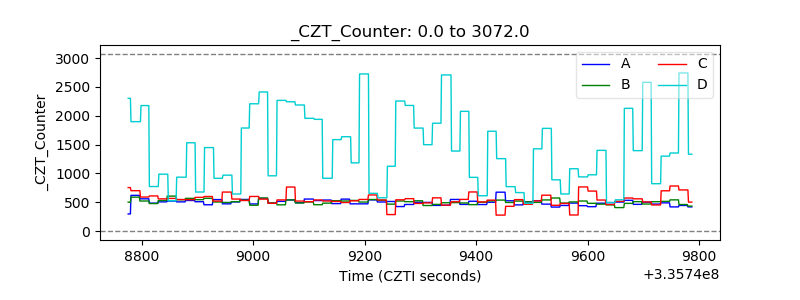 |
| +2.5 Volts monitor |  |
| +5 Volts monitor |  |
| _ROLL_ROT |  |
| _Roll_DEC | 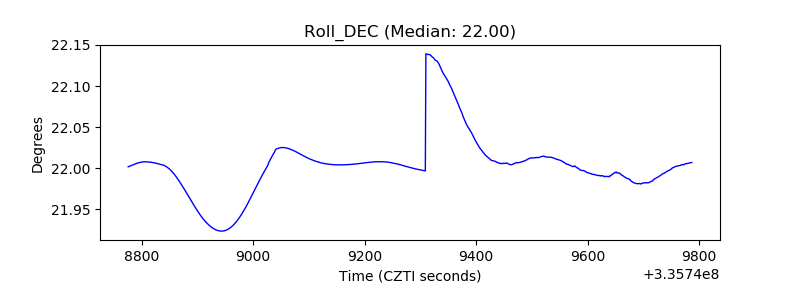 |
| _Roll_RA | 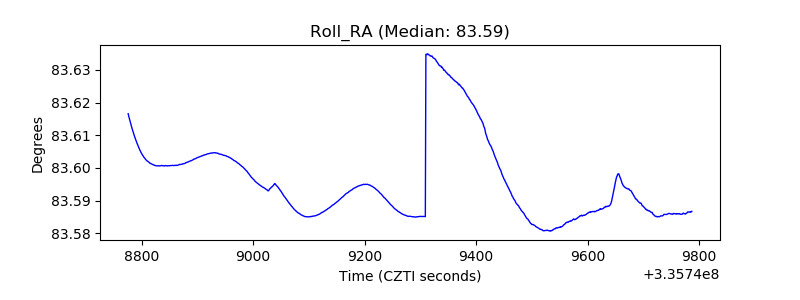 |
| Veto Counter | 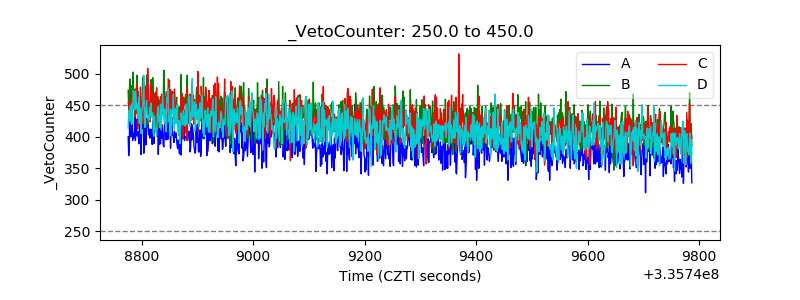 |