| Param | Original file | Final file |
|---|---|---|
| Filename | modeM0/AS1A09_120T02_9000003834_26493cztM0_level2.evt | modeM0/AS1A09_120T02_9000003834_26493cztM0_level2_quad_clean.evt |
| Size (bytes) | 284,019,840 | 63,426,240 |
| Size | 270.9 MB | 60.5 MB |
| Events in quadrant A | 1,407,013 | 440,758 |
| Events in quadrant B | 1,455,243 | 446,806 |
| Events in quadrant C | 1,556,846 | 426,669 |
| Events in quadrant D | 3,968,538 | 383,599 |
| Mode M0 | |||
|---|---|---|---|
| Quadrant | BADHDUFLAG | Total packets | Discarded packets |
| A | 0 | 6287 | 0 |
| B | 0 | 6307 | 0 |
| C | 0 | 6501 | 0 |
| D | 0 | 13986 | 0 |
| Quadrant | Total seconds | Saturated seconds | Saturation percentage |
|---|---|---|---|
| A | 3126 | 3 | 0.095969% |
| B | 3126 | 4 | 0.127959% |
| C | 3126 | 13 | 0.415867% |
| D | 3126 | 509 | 16.282790% |
Noise dominated data is calculated using 1-second bins in cleaned event files. If a bin has >2000 counts, and if more than 50% of those come from <1% of pixels, then it is considered to be noise-dominated and hence unusable.
| Quadrant | # 1 sec bins | Bins with >0 counts | Bins with >2000 counts | High rate bins dominated by noise | Noise dominated (total time) | Noise dominated (detector-on time) | Marked lightcurve |
|---|---|---|---|---|---|---|---|
| A | 3126 | 3126 | 0 | 0 | 0.00% | 0.00% | 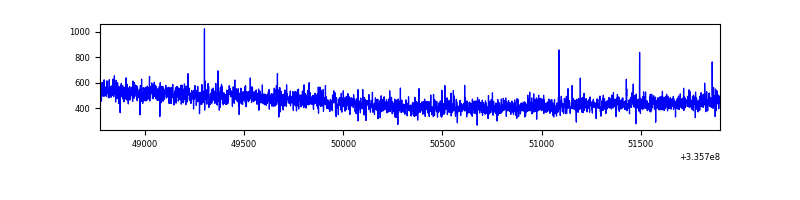 |
| B | 3126 | 3126 | 0 | 0 | 0.00% | 0.00% | 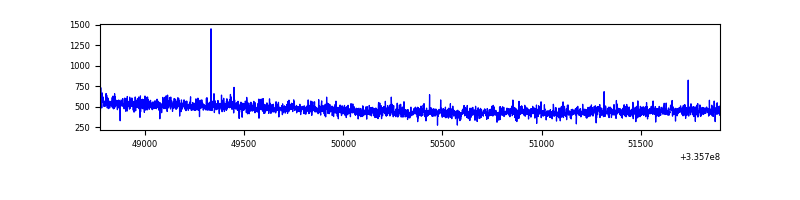 |
| C | 3126 | 3126 | 1 | 1 | 0.03% | 0.03% | 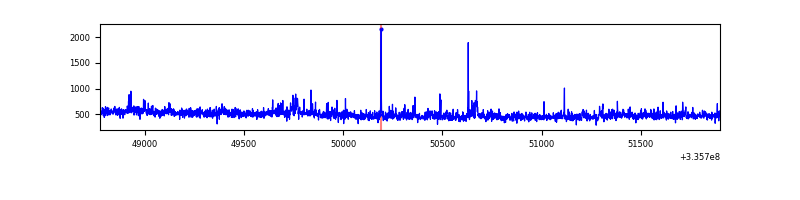 |
| D | 3126 | 3126 | 538 | 538 | 17.21% | 17.21% | 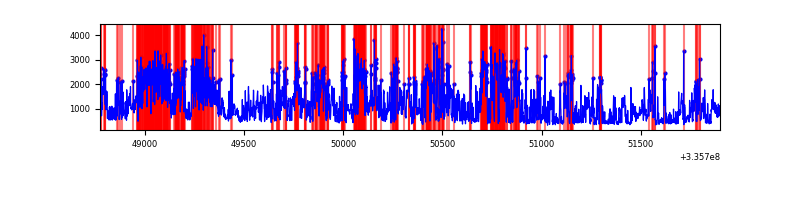 |
Top three noisy pixels from each quadrant. If the there are fewer than three noisy pixels in the level2.evt file, extra rows are filled as -1
| Pixel properties | Quadrant properties | ||||||
|---|---|---|---|---|---|---|---|
| Quadrant | DetID | PixID | Counts | Sigma | Mean | Median | Sigma |
| A | 13 | 254 | 4940 | 60.71 | 365 | 359 | 75.5 |
| A | 3 | 137 | 3167 | 37.22 | 365 | 359 | 75.5 |
| A | 0 | 226 | 2998 | 34.98 | 365 | 359 | 75.5 |
| B | 0 | 219 | 10301 | 137.49 | 368 | 361 | 72.3 |
| B | 12 | 111 | 8161 | 107.89 | 368 | 361 | 72.3 |
| B | 0 | 229 | 7605 | 100.2 | 368 | 361 | 72.3 |
| C | 3 | 233 | 113914 | 1324.25 | 354 | 358 | 85.8 |
| C | 14 | 238 | 57356 | 664.69 | 354 | 358 | 85.8 |
| C | 4 | 254 | 4882 | 52.76 | 354 | 358 | 85.8 |
| D | 1 | 52 | 1814773 | 22097.18 | 335 | 328 | 82.1 |
| D | 7 | 80 | 600770 | 7312.47 | 335 | 328 | 82.1 |
| D | 12 | 233 | 272582 | 3315.64 | 335 | 328 | 82.1 |
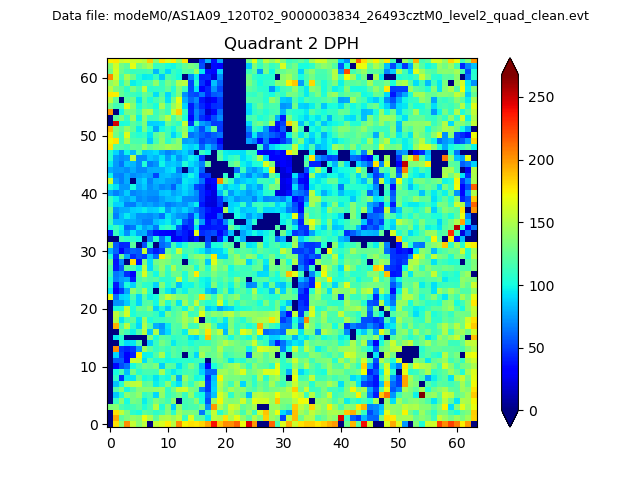
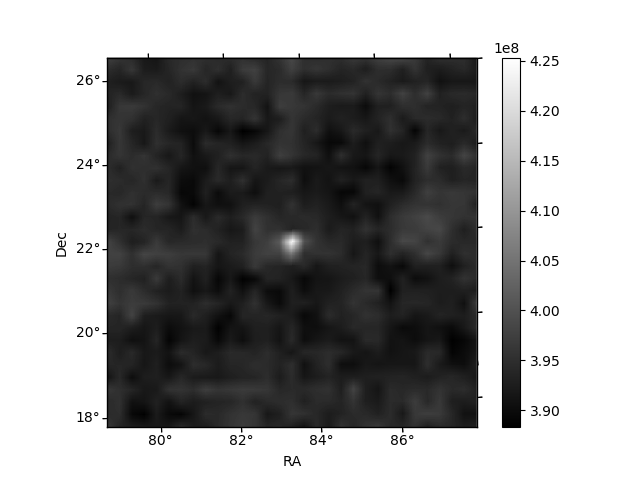
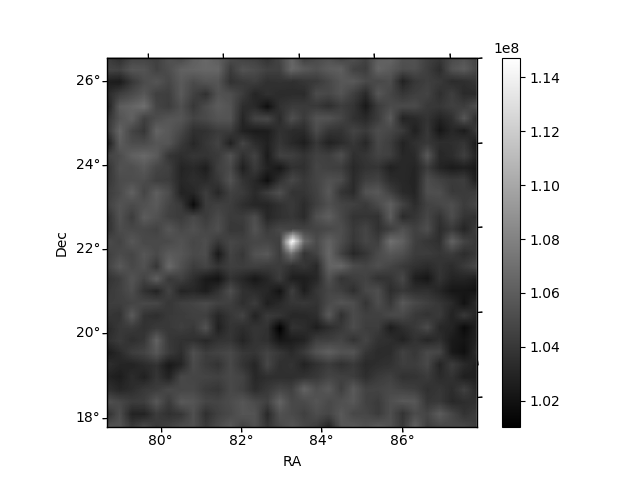
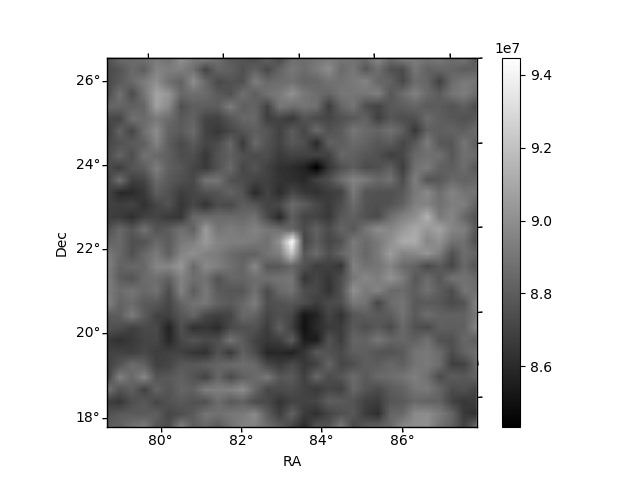
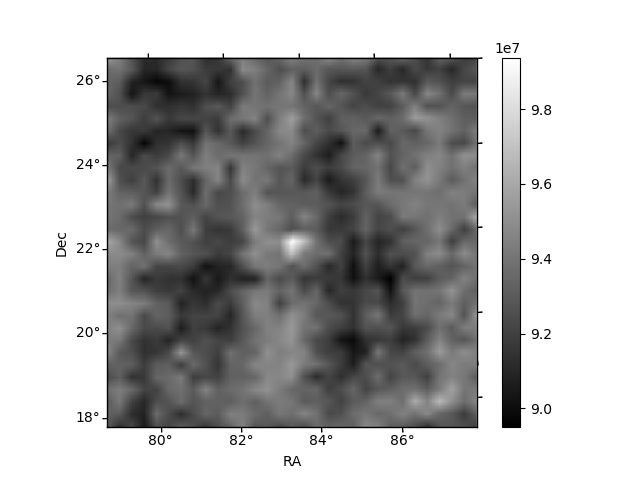
Histogram calculated using DETX and DETY for each event in the final _common_clean file
| Quadrant A | 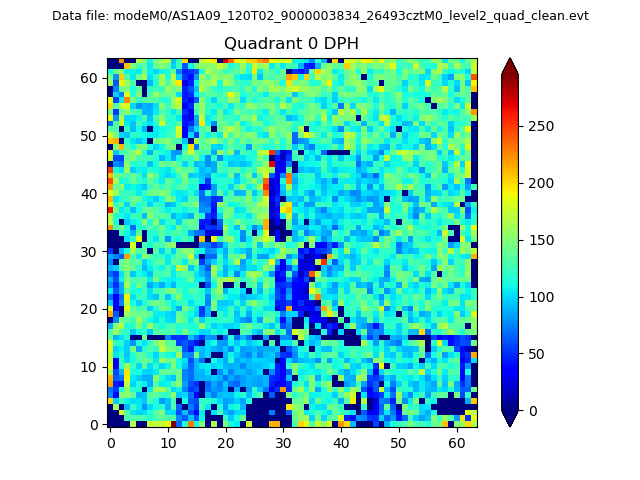 |
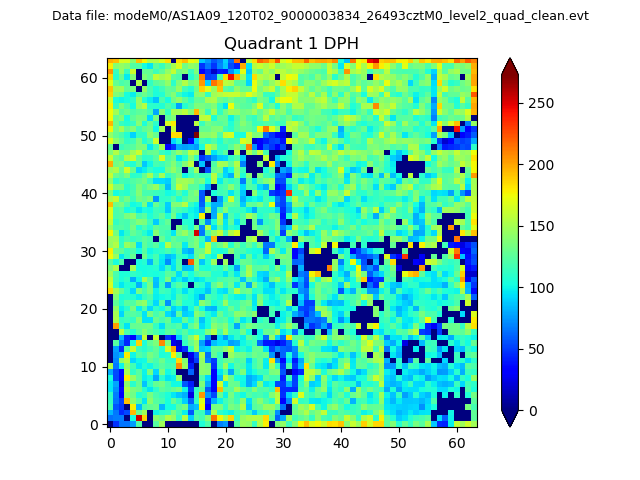 |
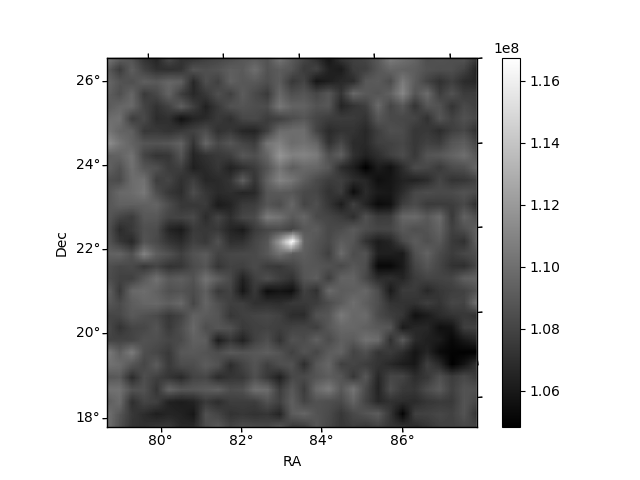
Quadrant B |
|---|---|---|---|
| Quadrant D | 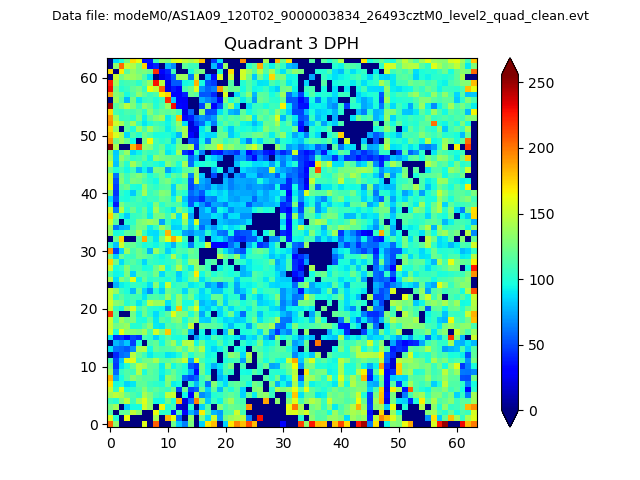 |
 |
Quadrant C |
| Plot type | Count rate plots | Images |
|---|---|---|
| Comparison with Poisson distribution Blue bars denote a histogram of data divided into 1 sec bins. Red curve is a Poisson curve with rate = median count rate of data. |
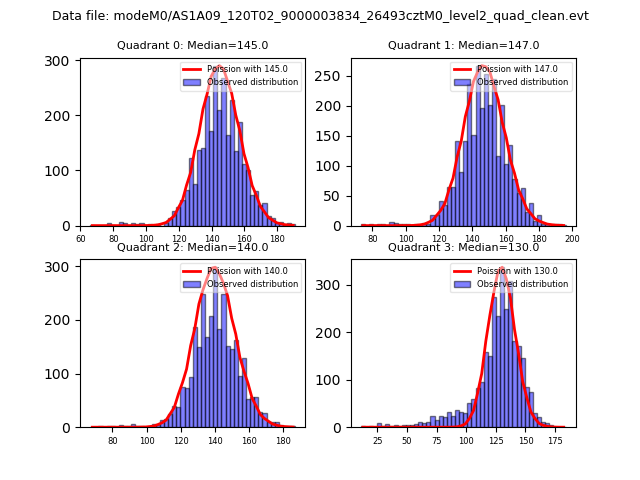 |
 |
| Quadrant-wise count rates Data is divided into 100 sec bins |
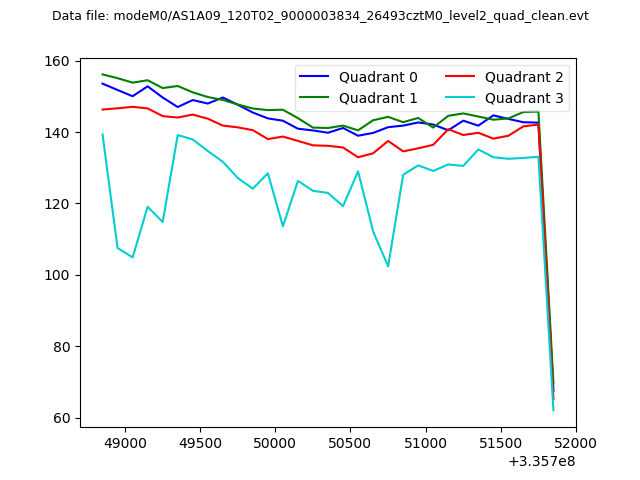 |
|
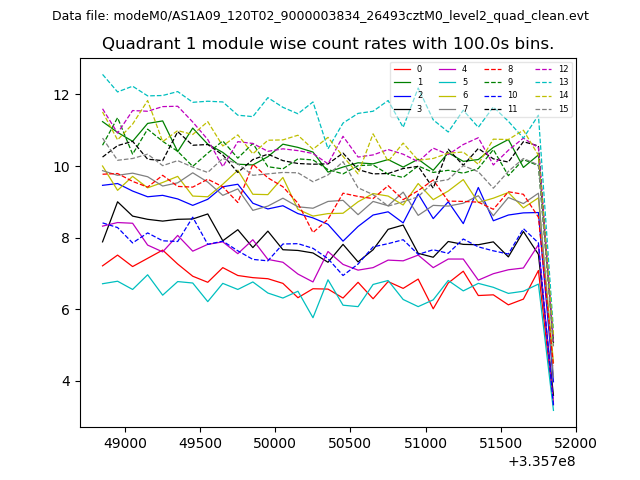
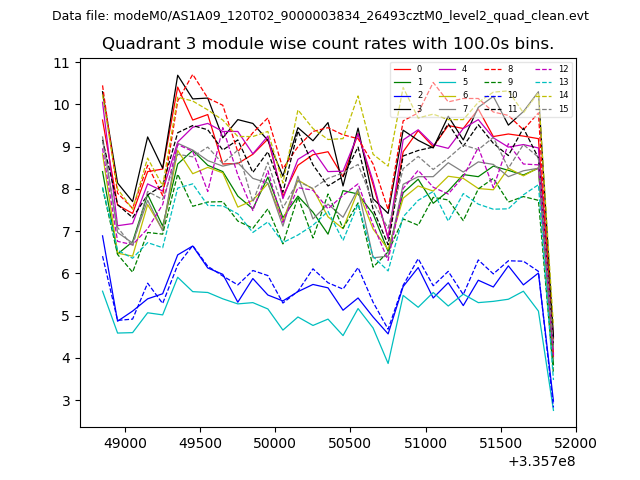
| Module-wise count rates for Quadrant A Data is divided into 100 sec bins |
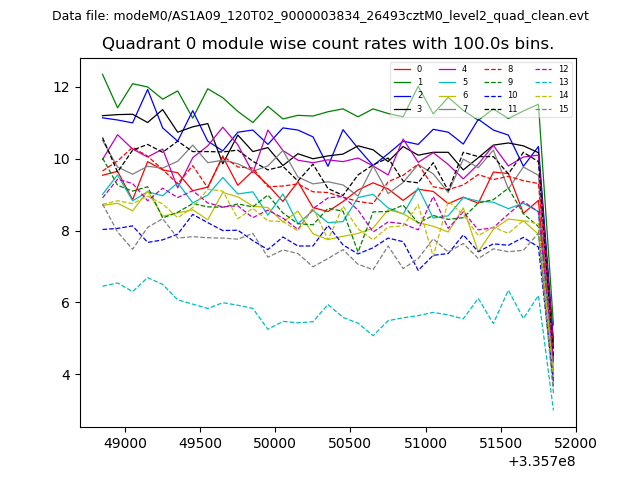 |
 |
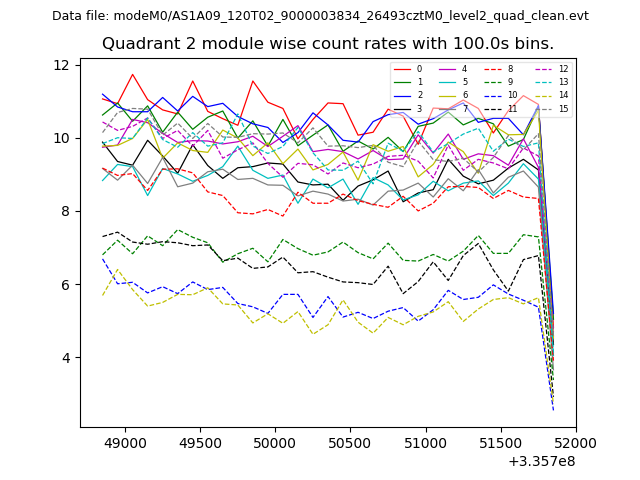
| Module-wise count rates for Quadrant B Data is divided into 100 sec bins |
 |
 |
| Module-wise count rates for Quadrant C Data is divided into 100 sec bins |
 |
 |
| Module-wise count rates for Quadrant D Data is divided into 100 sec bins |
 |
 |
| Parameter | Plot |
|---|---|
| CZT HV Monitor | 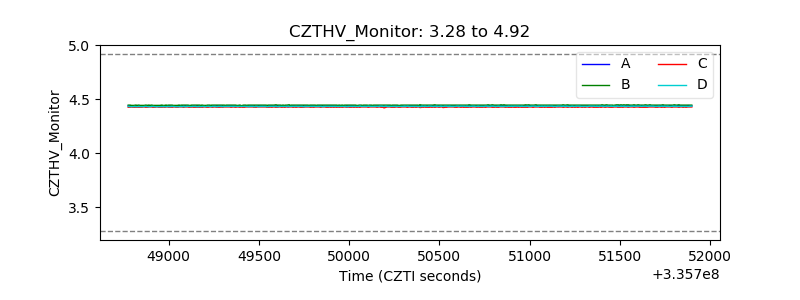 |
| D_VDD | 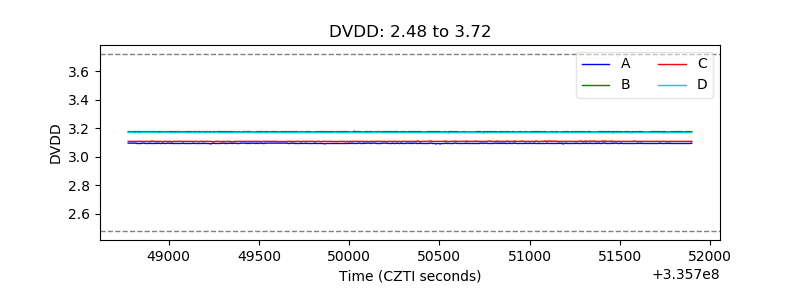 |
| Temperature 1 | 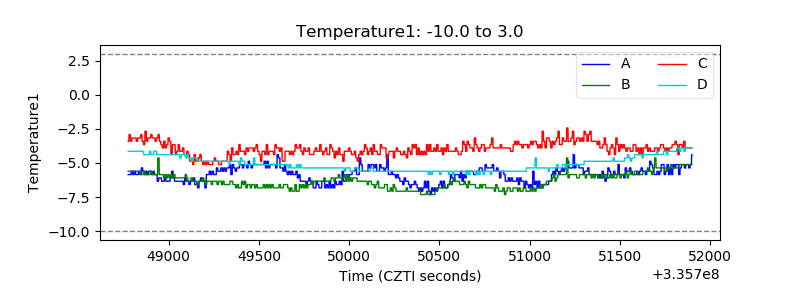 |
| Veto HV Monitor | 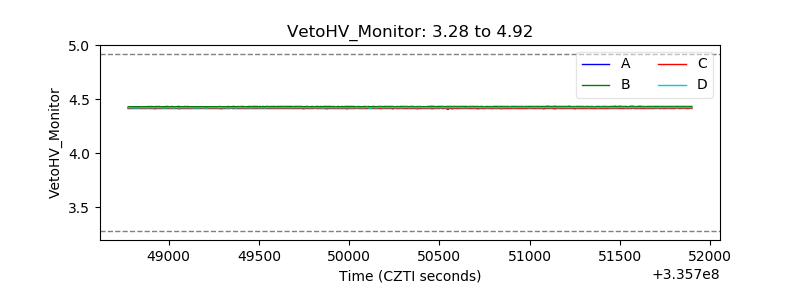 |
| Veto LLD | 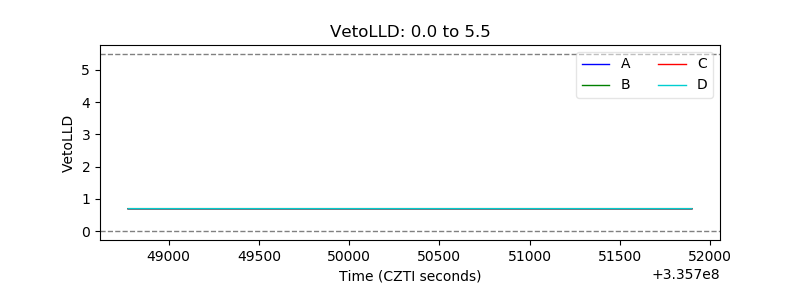 |
| Alpha Counter |  |
| _CPM_Rate | 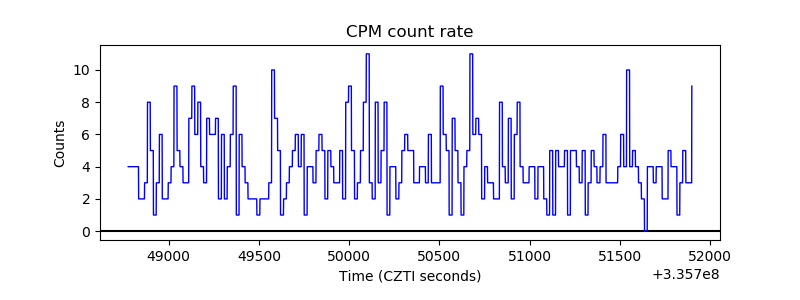 |
| CZT Counter | 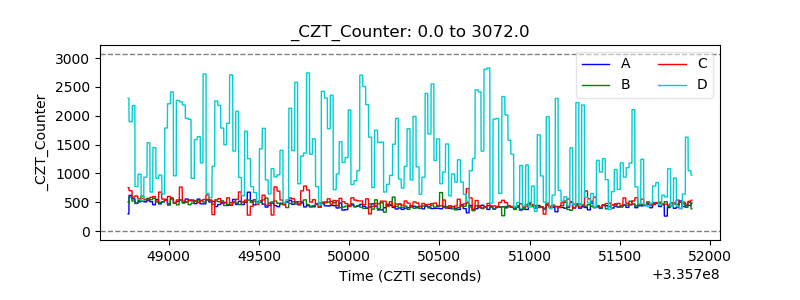 |
| +2.5 Volts monitor |  |
| +5 Volts monitor |  |
| _ROLL_ROT | 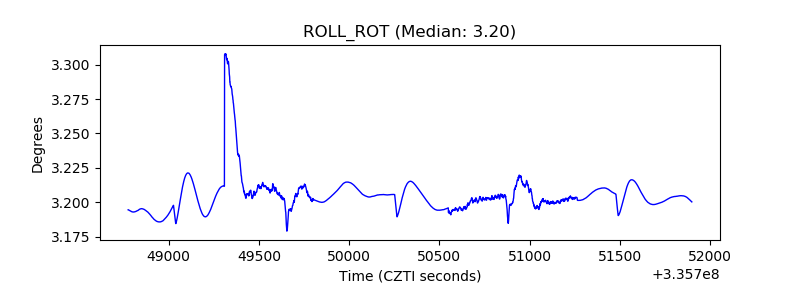 |
| _Roll_DEC | 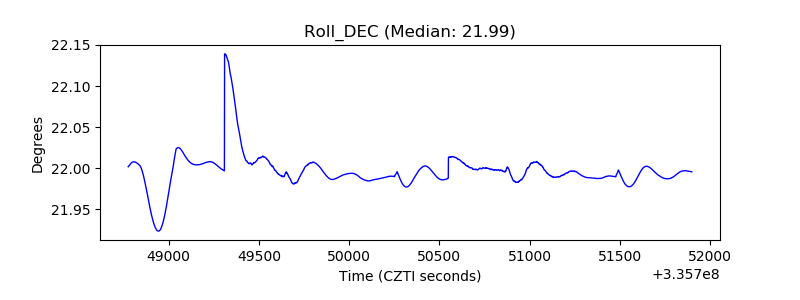 |
| _Roll_RA | 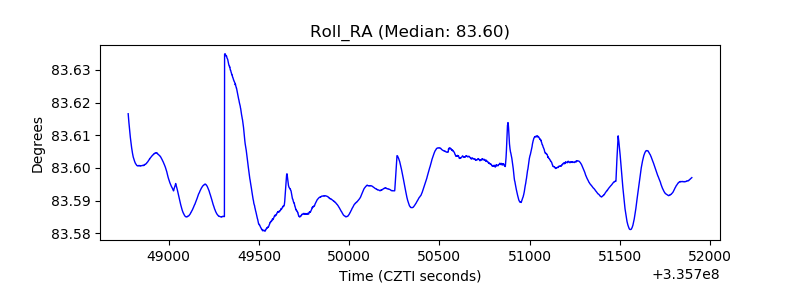 |
| Veto Counter | 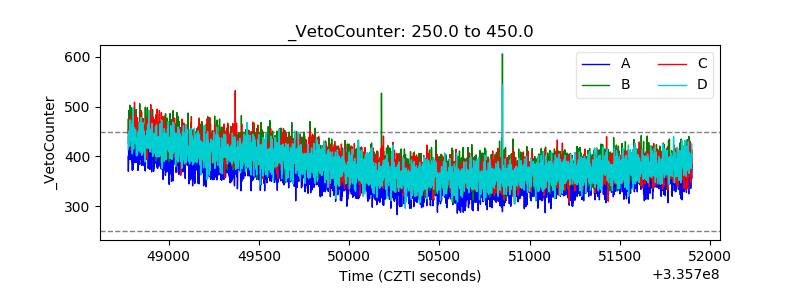 |