| Param | Original file | Final file |
|---|---|---|
| Filename | modeM0/AS1C05_017T01_9000003836_26493cztM0_level2.evt | modeM0/AS1C05_017T01_9000003836_26493cztM0_level2_quad_clean.evt |
| Size (bytes) | 366,825,600 | 40,052,160 |
| Size | 349.8 MB | 38.2 MB |
| Events in quadrant A | 1,915,433 | 247,420 |
| Events in quadrant B | 1,965,360 | 251,193 |
| Events in quadrant C | 1,999,304 | 238,408 |
| Events in quadrant D | 4,983,924 | 220,194 |
| Mode M9 | |||
|---|---|---|---|
| Quadrant | BADHDUFLAG | Total packets | Discarded packets |
| A | 0 | 3 | 0 |
| B | 0 | 3 | 0 |
| C | 0 | 3 | 0 |
| D | 0 | 3 | 0 |
| Mode M0 | |||
|---|---|---|---|
| Quadrant | BADHDUFLAG | Total packets | Discarded packets |
| A | 0 | 7725 | 0 |
| B | 0 | 7880 | 0 |
| C | 0 | 8028 | 0 |
| D | 0 | 17308 | 0 |
| Quadrant | Total seconds | Saturated seconds | Saturation percentage |
|---|---|---|---|
| A | 3601 | 42 | 1.166343% |
| B | 3601 | 80 | 2.221605% |
| C | 3601 | 107 | 2.971397% |
| D | 3601 | 1089 | 30.241600% |
Noise dominated data is calculated using 1-second bins in cleaned event files. If a bin has >2000 counts, and if more than 50% of those come from <1% of pixels, then it is considered to be noise-dominated and hence unusable.
| Quadrant | # 1 sec bins | Bins with >0 counts | Bins with >2000 counts | High rate bins dominated by noise | Noise dominated (total time) | Noise dominated (detector-on time) | Marked lightcurve |
|---|---|---|---|---|---|---|---|
| A | 3886 | 3602 | 0 | 0 | 0.00% | 0.00% | 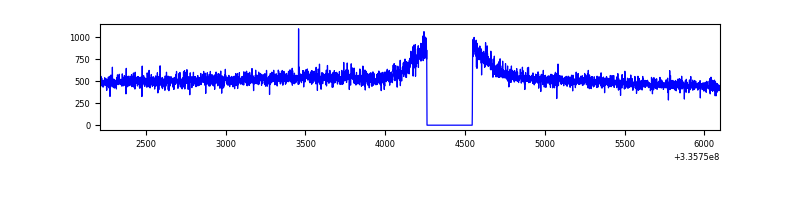 |
| B | 3886 | 3602 | 2 | 2 | 0.05% | 0.06% | 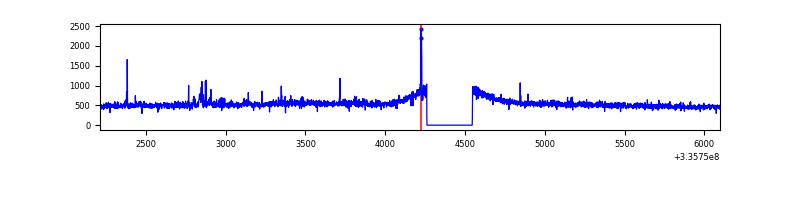 |
| C | 3886 | 3602 | 0 | 0 | 0.00% | 0.00% | 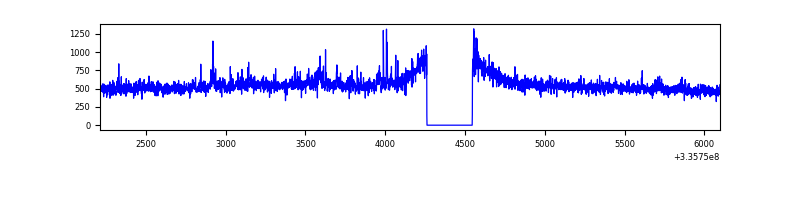 |
| D | 3886 | 3602 | 719 | 719 | 18.50% | 19.96% | 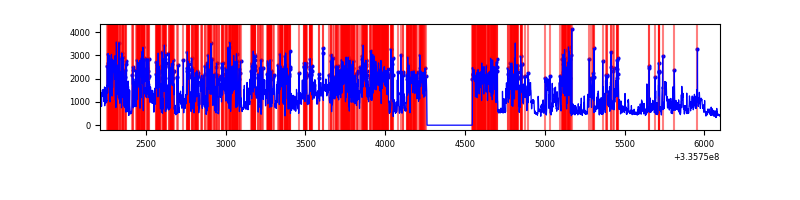 |
Top three noisy pixels from each quadrant. If the there are fewer than three noisy pixels in the level2.evt file, extra rows are filled as -1
| Pixel properties | Quadrant properties | ||||||
|---|---|---|---|---|---|---|---|
| Quadrant | DetID | PixID | Counts | Sigma | Mean | Median | Sigma |
| A | 12 | 16 | 9579 | 88.91 | 493 | 484 | 102.3 |
| A | 13 | 254 | 6275 | 56.61 | 493 | 484 | 102.3 |
| A | 12 | 194 | 5080 | 44.93 | 493 | 484 | 102.3 |
| B | 0 | 190 | 21722 | 223.24 | 490 | 478 | 95.2 |
| B | 5 | 172 | 16155 | 164.74 | 490 | 478 | 95.2 |
| B | 12 | 111 | 11472 | 115.53 | 490 | 478 | 95.2 |
| C | 3 | 233 | 94125 | 830.82 | 469 | 472 | 112.7 |
| C | 14 | 238 | 74376 | 655.62 | 469 | 472 | 112.7 |
| C | 4 | 254 | 4376 | 34.63 | 469 | 472 | 112.7 |
| D | 1 | 52 | 3193037 | 30397.24 | 428 | 417 | 105.0 |
| D | 7 | 80 | 105341 | 998.99 | 428 | 417 | 105.0 |
| D | 12 | 233 | 36651 | 344.99 | 428 | 417 | 105.0 |
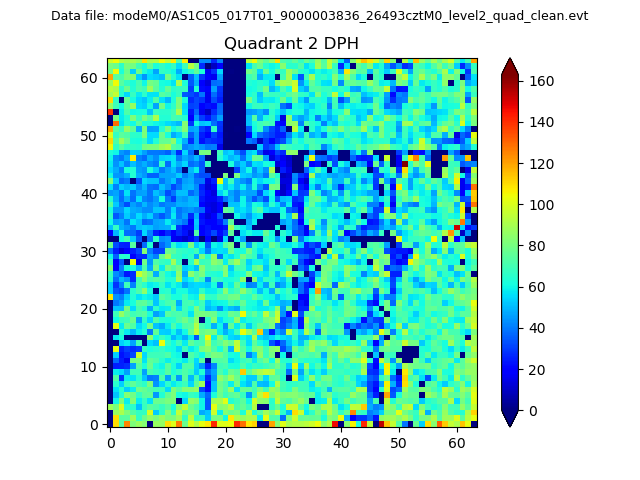
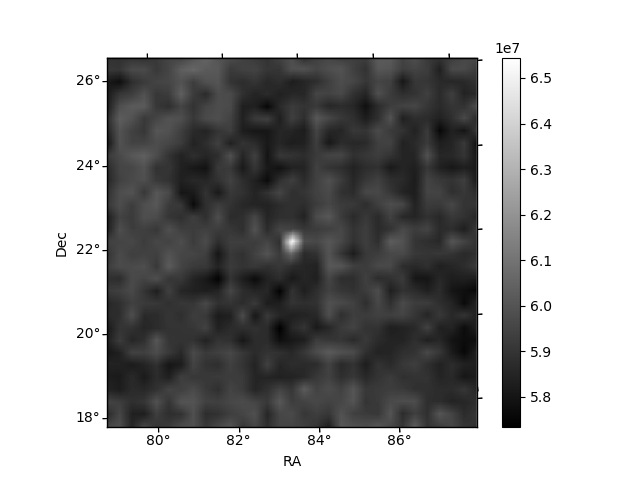
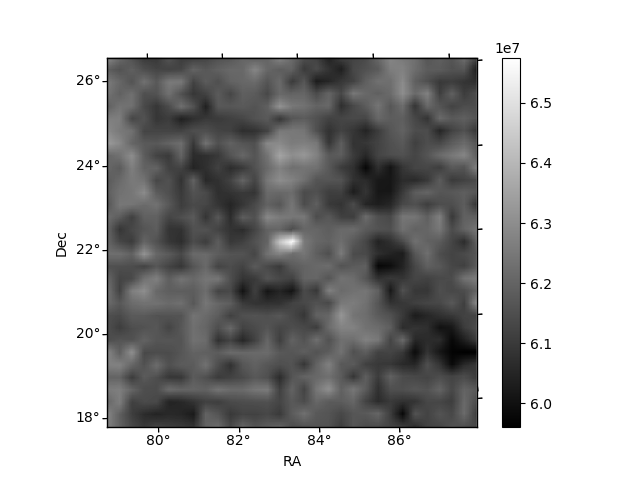
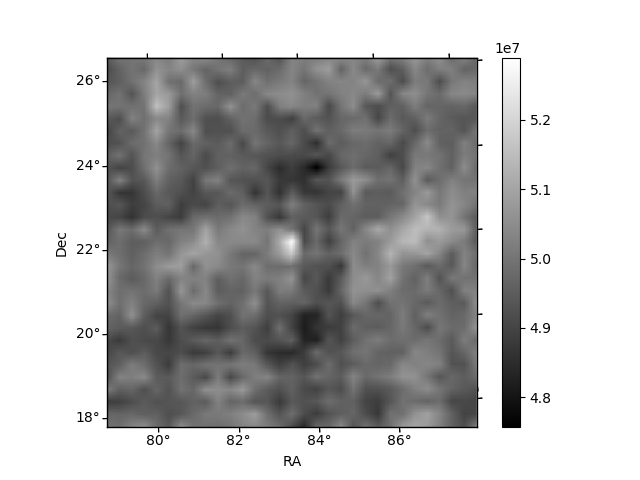
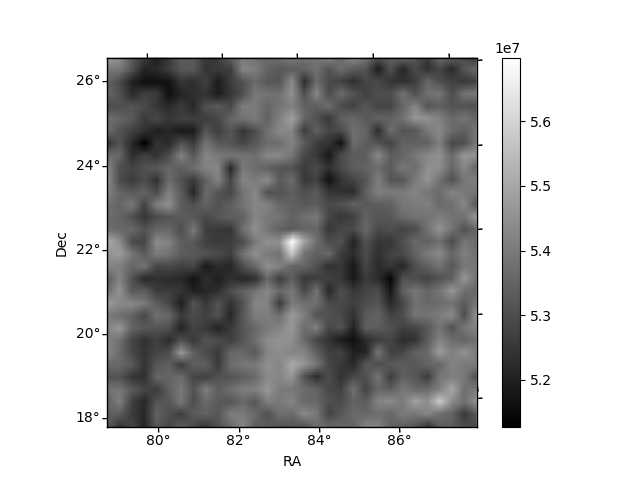
Histogram calculated using DETX and DETY for each event in the final _common_clean file
| Quadrant A | 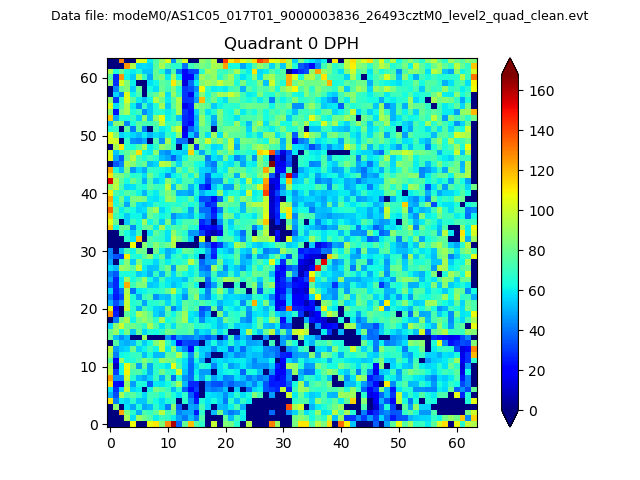 |
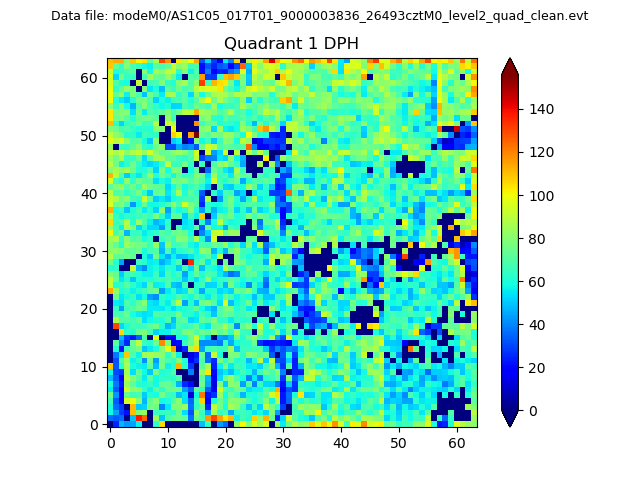 |
Quadrant B |
|---|---|---|---|
| Quadrant D | 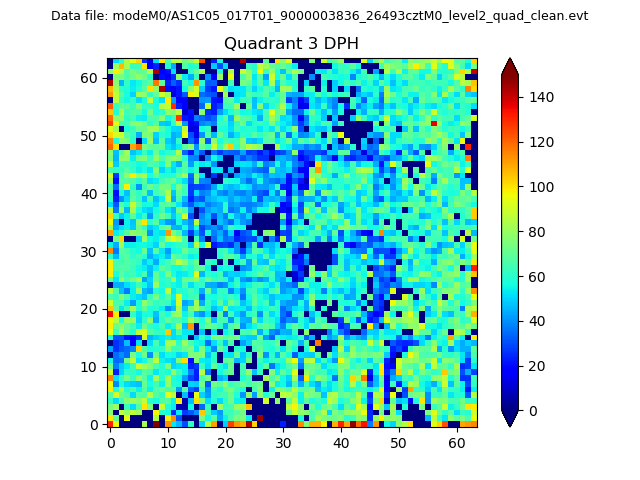 |
 |
Quadrant C |
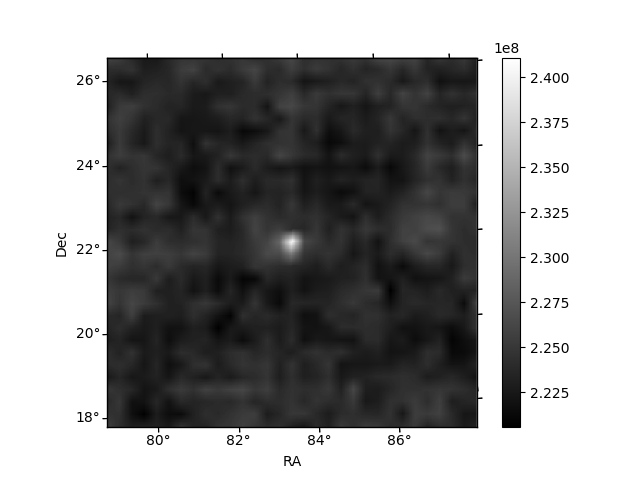
| Plot type | Count rate plots | Images |
|---|---|---|
| Comparison with Poisson distribution Blue bars denote a histogram of data divided into 1 sec bins. Red curve is a Poisson curve with rate = median count rate of data. |
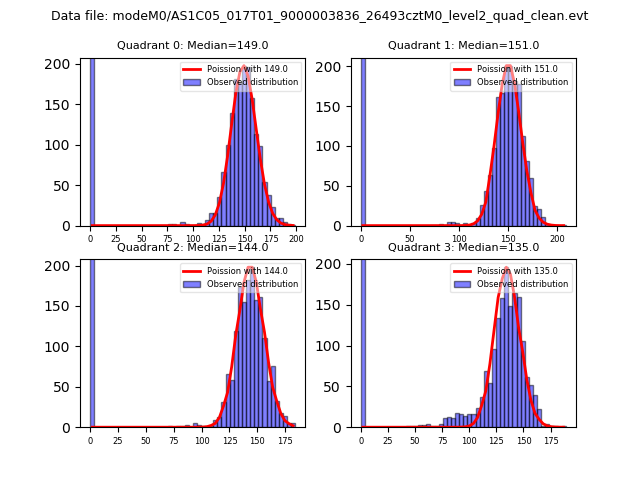 |
 |
| Quadrant-wise count rates Data is divided into 100 sec bins |
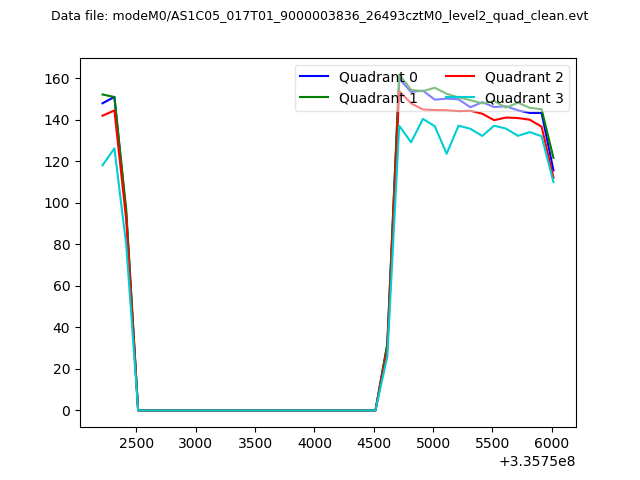 |
|
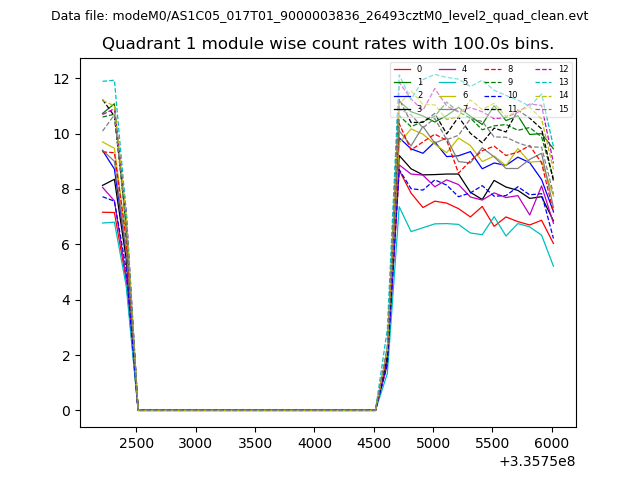
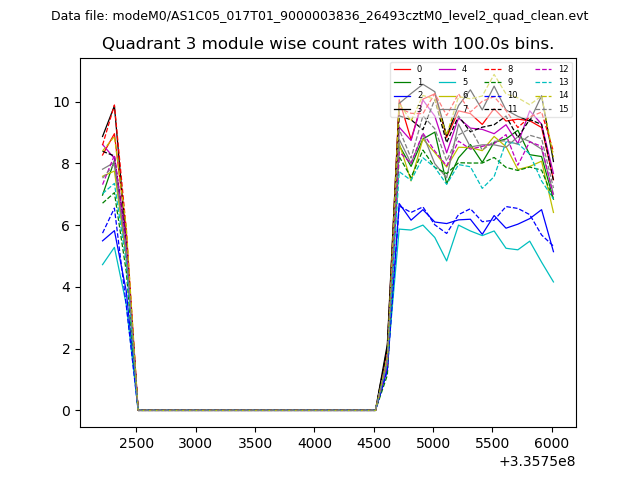
| Module-wise count rates for Quadrant A Data is divided into 100 sec bins |
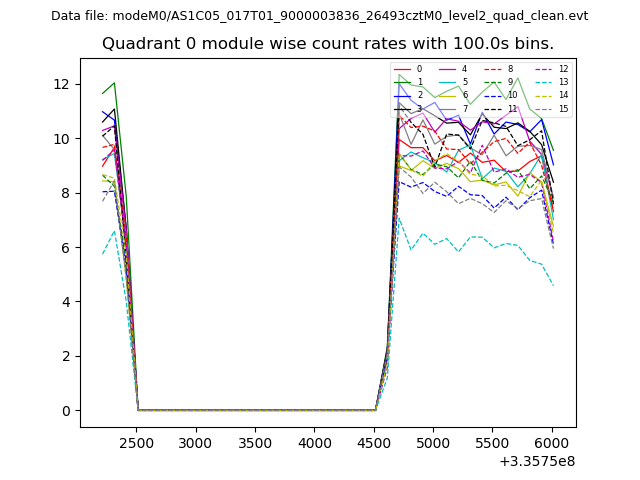 |
 |
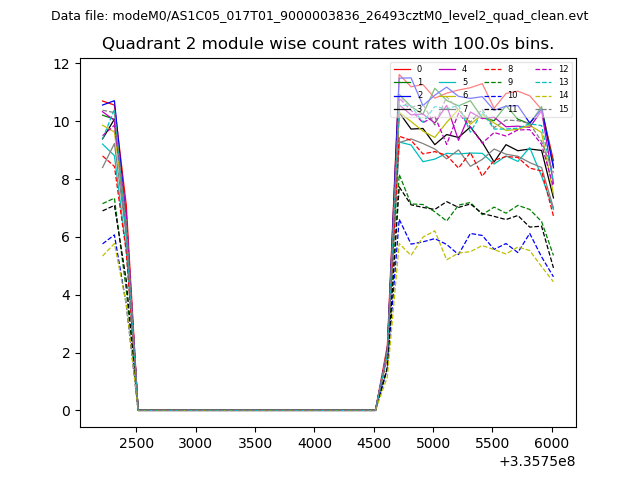
| Module-wise count rates for Quadrant B Data is divided into 100 sec bins |
 |
 |
| Module-wise count rates for Quadrant C Data is divided into 100 sec bins |
 |
 |
| Module-wise count rates for Quadrant D Data is divided into 100 sec bins |
 |
 |
| Parameter | Plot |
|---|---|
| CZT HV Monitor | 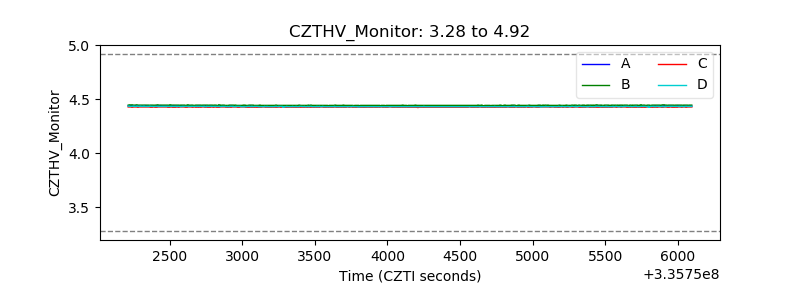 |
| D_VDD | 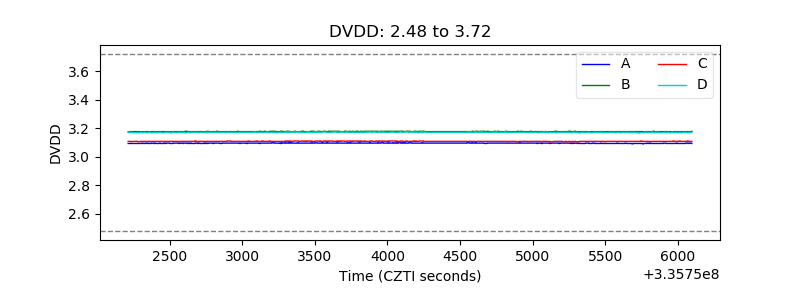 |
| Temperature 1 | 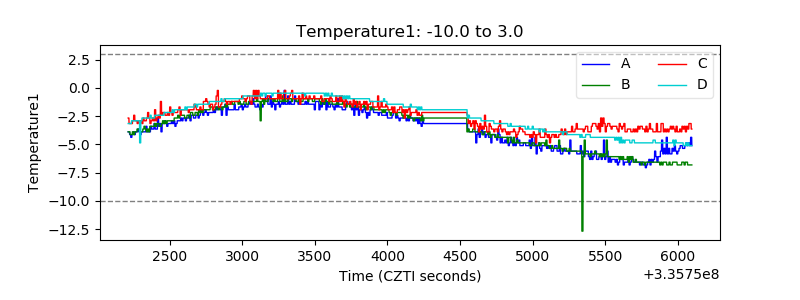 |
| Veto HV Monitor | 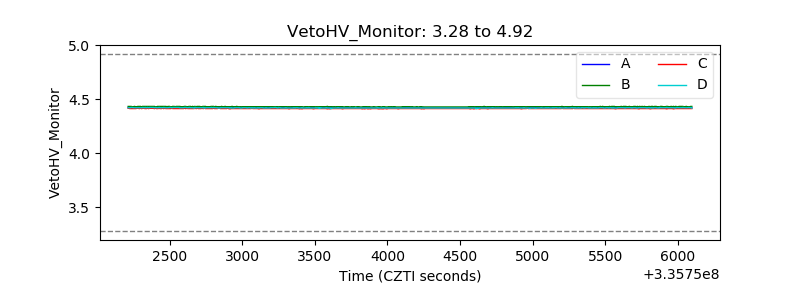 |
| Veto LLD | 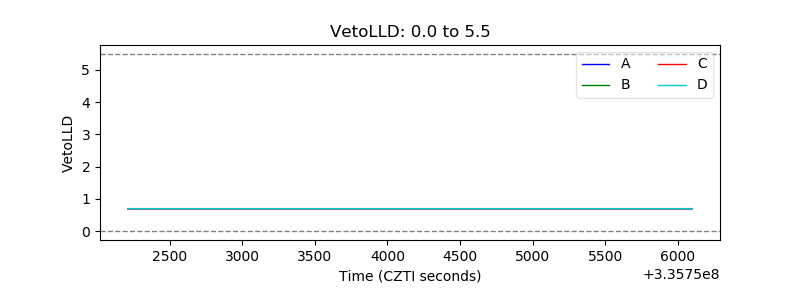 |
| Alpha Counter | 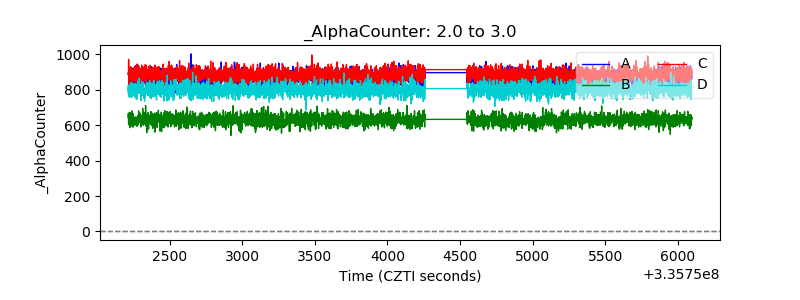 |
| _CPM_Rate | 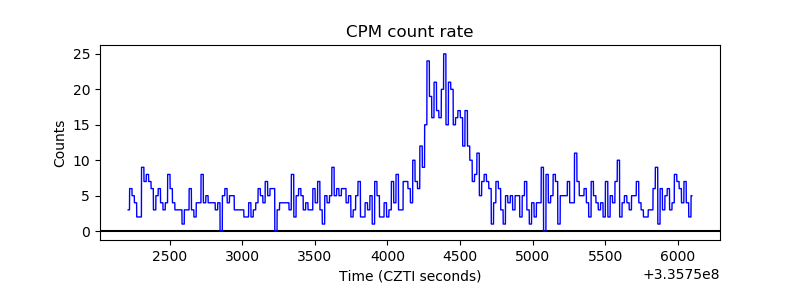 |
| CZT Counter | 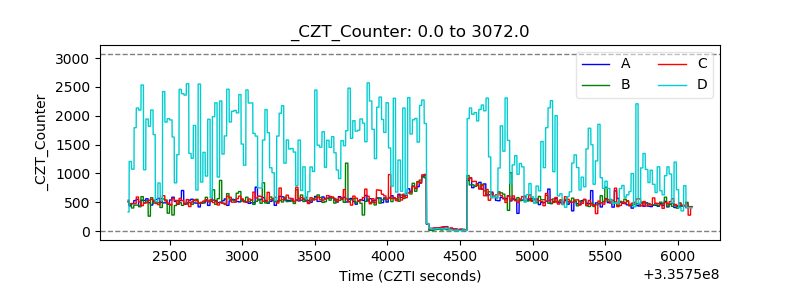 |
| +2.5 Volts monitor |  |
| +5 Volts monitor |  |
| _ROLL_ROT |  |
| _Roll_DEC | 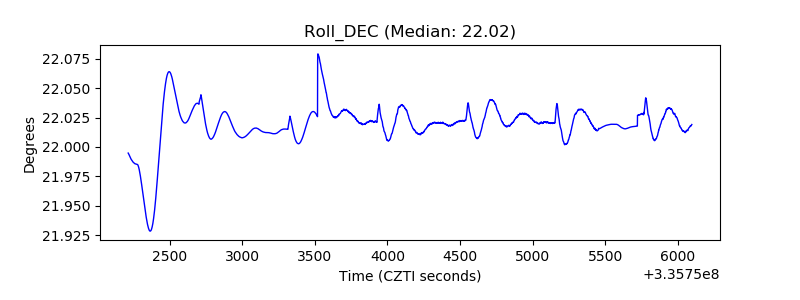 |
| _Roll_RA | 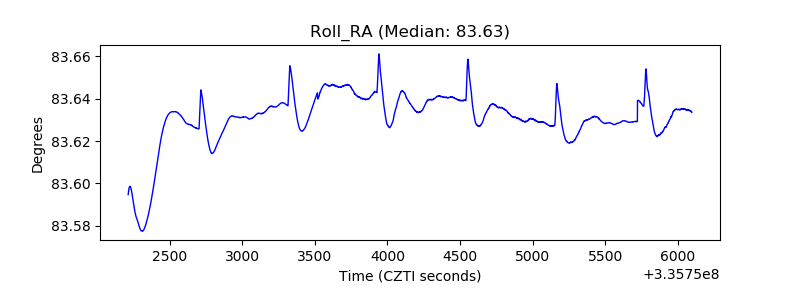 |
| Veto Counter | 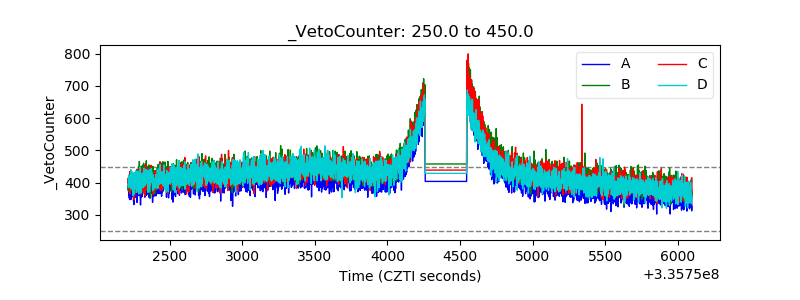 |