| Param | Original file | Final file |
|---|---|---|
| Filename | modeM0/AS1C05_017T01_9000003836_26494cztM0_level2.evt | modeM0/AS1C05_017T01_9000003836_26494cztM0_level2_quad_clean.evt |
| Size (bytes) | 741,833,280 | 115,116,480 |
| Size | 707.5 MB | 109.8 MB |
| Events in quadrant A | 3,838,226 | 775,478 |
| Events in quadrant B | 3,939,940 | 786,877 |
| Events in quadrant C | 4,097,309 | 750,110 |
| Events in quadrant D | 10,069,723 | 637,217 |
| Mode M9 | |||
|---|---|---|---|
| Quadrant | BADHDUFLAG | Total packets | Discarded packets |
| A | 0 | 2 | 0 |
| B | 0 | 3 | 0 |
| C | 0 | 3 | 0 |
| D | 0 | 3 | 0 |
| Mode M0 | |||
|---|---|---|---|
| Quadrant | BADHDUFLAG | Total packets | Discarded packets |
| A | 0 | 16267 | 0 |
| B | 0 | 16439 | 0 |
| C | 0 | 17065 | 0 |
| D | 0 | 35337 | 0 |
| Quadrant | Total seconds | Saturated seconds | Saturation percentage |
|---|---|---|---|
| A | 7707 | 123 | 1.595952% |
| B | 7707 | 178 | 2.309589% |
| C | 7707 | 219 | 2.841573% |
| D | 7707 | 1840 | 23.874400% |
Noise dominated data is calculated using 1-second bins in cleaned event files. If a bin has >2000 counts, and if more than 50% of those come from <1% of pixels, then it is considered to be noise-dominated and hence unusable.
| Quadrant | # 1 sec bins | Bins with >0 counts | Bins with >2000 counts | High rate bins dominated by noise | Noise dominated (total time) | Noise dominated (detector-on time) | Marked lightcurve |
|---|---|---|---|---|---|---|---|
| A | 7887 | 7708 | 0 | 0 | 0.00% | 0.00% | 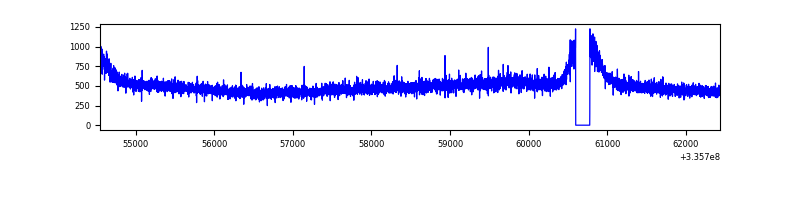 |
| B | 7887 | 7708 | 0 | 0 | 0.00% | 0.00% | 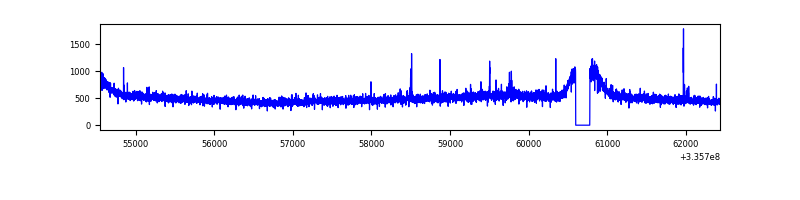 |
| C | 7887 | 7708 | 2 | 2 | 0.03% | 0.03% | 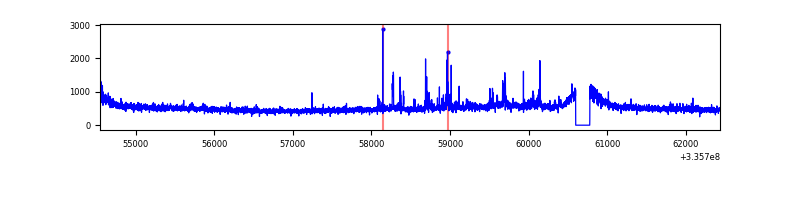 |
| D | 7887 | 7708 | 1357 | 1357 | 17.21% | 17.61% | 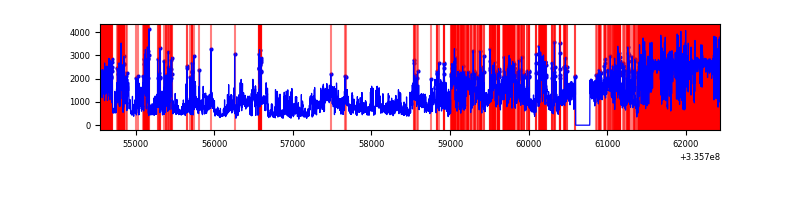 |
Top three noisy pixels from each quadrant. If the there are fewer than three noisy pixels in the level2.evt file, extra rows are filled as -1
| Pixel properties | Quadrant properties | ||||||
|---|---|---|---|---|---|---|---|
| Quadrant | DetID | PixID | Counts | Sigma | Mean | Median | Sigma |
| A | 13 | 254 | 13643 | 62.91 | 994 | 975 | 201.4 |
| A | 3 | 137 | 9218 | 40.93 | 994 | 975 | 201.4 |
| A | 0 | 226 | 8533 | 37.53 | 994 | 975 | 201.4 |
| B | 12 | 111 | 22929 | 114.84 | 992 | 969 | 191.2 |
| B | 11 | 111 | 20214 | 100.64 | 992 | 969 | 191.2 |
| B | 14 | 111 | 17366 | 85.74 | 992 | 969 | 191.2 |
| C | 3 | 233 | 169695 | 742.65 | 952 | 961 | 227.2 |
| C | 14 | 238 | 150911 | 659.97 | 952 | 961 | 227.2 |
| C | 2 | 16 | 65093 | 282.26 | 952 | 961 | 227.2 |
| D | 1 | 52 | 4088233 | 19457.82 | 868 | 850 | 210.1 |
| D | 12 | 233 | 2218833 | 10558.62 | 868 | 850 | 210.1 |
| D | 7 | 80 | 342750 | 1627.6 | 868 | 850 | 210.1 |
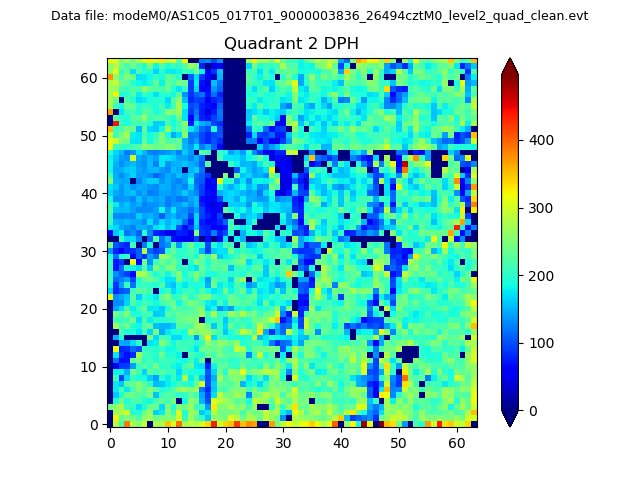
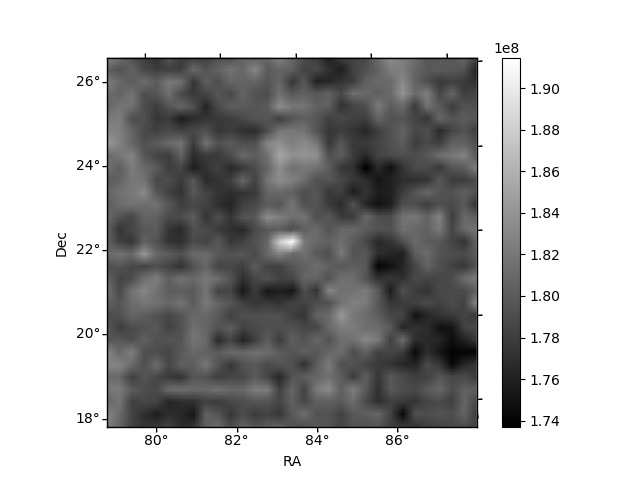
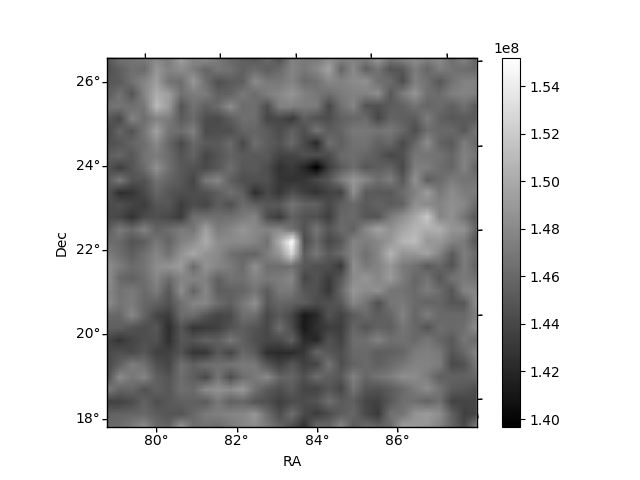
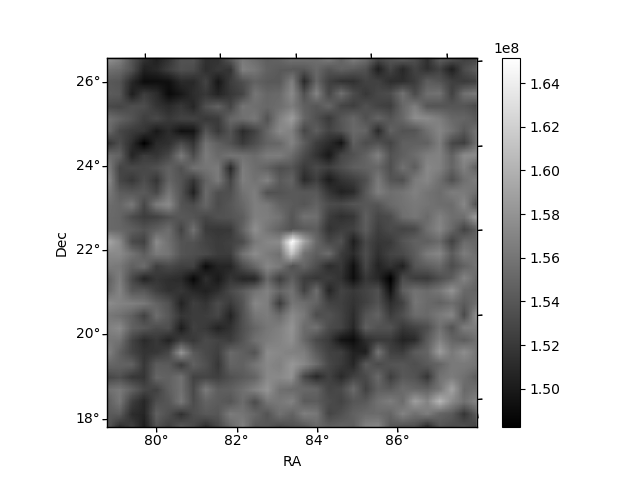
Histogram calculated using DETX and DETY for each event in the final _common_clean file
| Quadrant A | 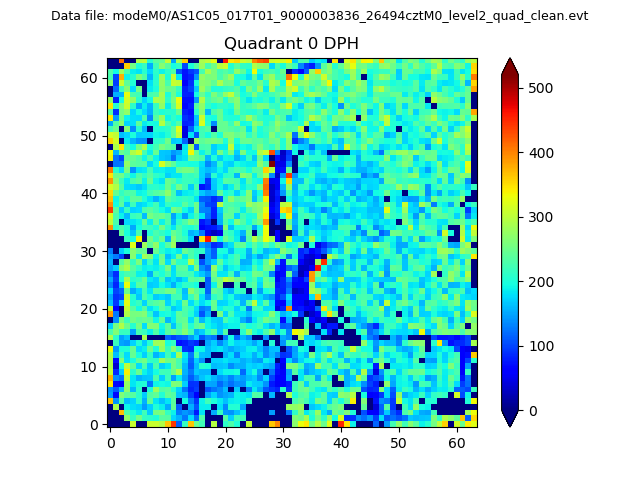 |
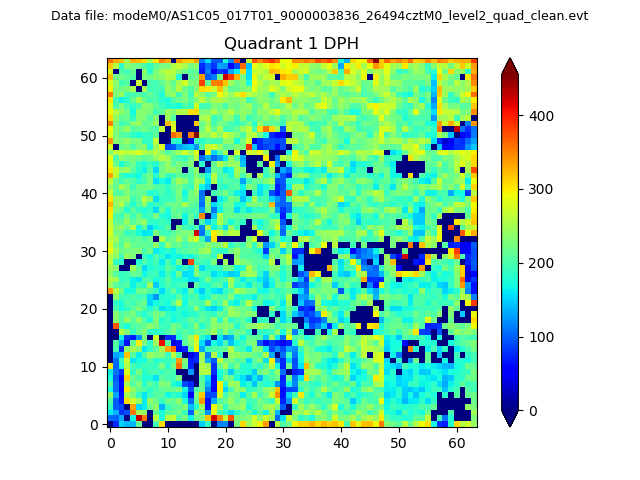 |
Quadrant B |
|---|---|---|---|
| Quadrant D | 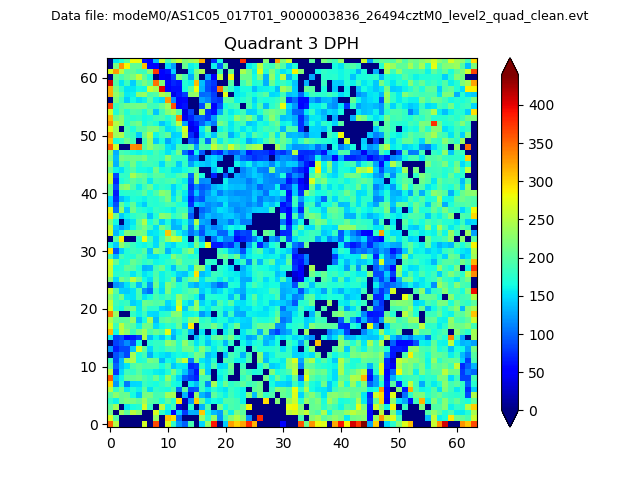 |
 |
Quadrant C |
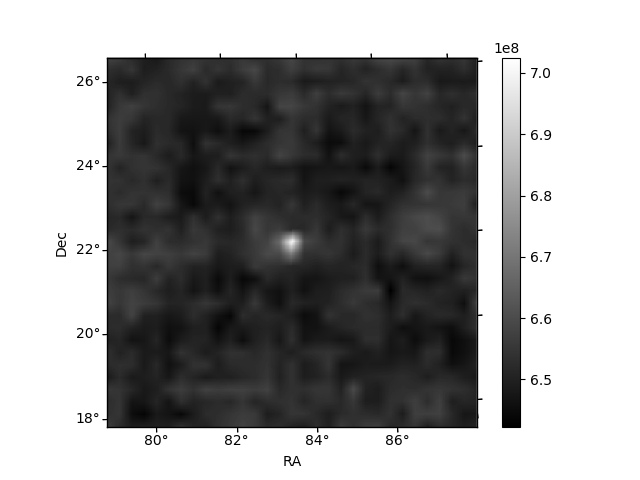
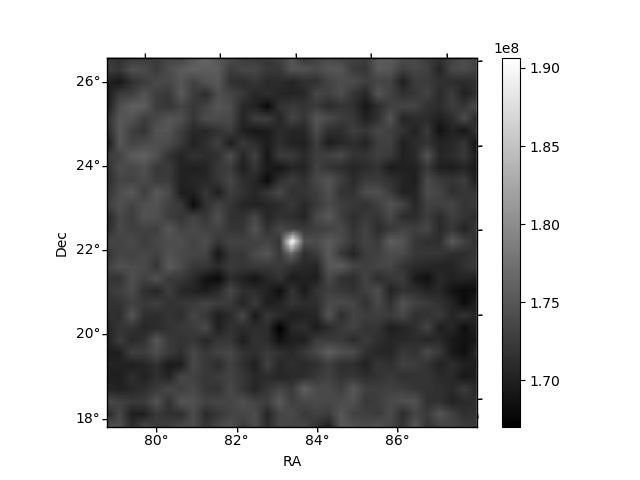
| Plot type | Count rate plots | Images |
|---|---|---|
| Comparison with Poisson distribution Blue bars denote a histogram of data divided into 1 sec bins. Red curve is a Poisson curve with rate = median count rate of data. |
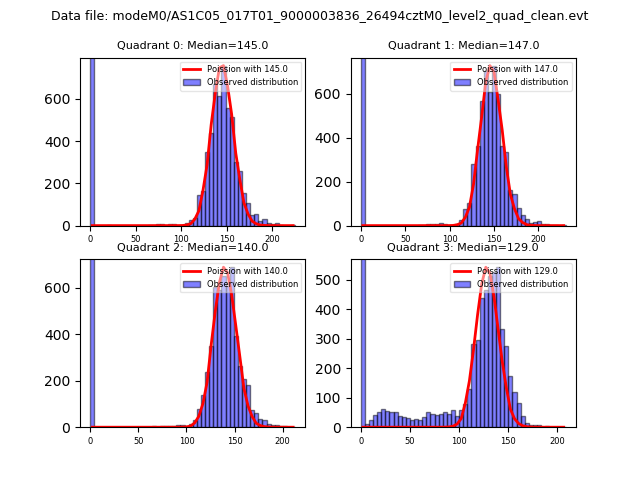 |
 |
| Quadrant-wise count rates Data is divided into 100 sec bins |
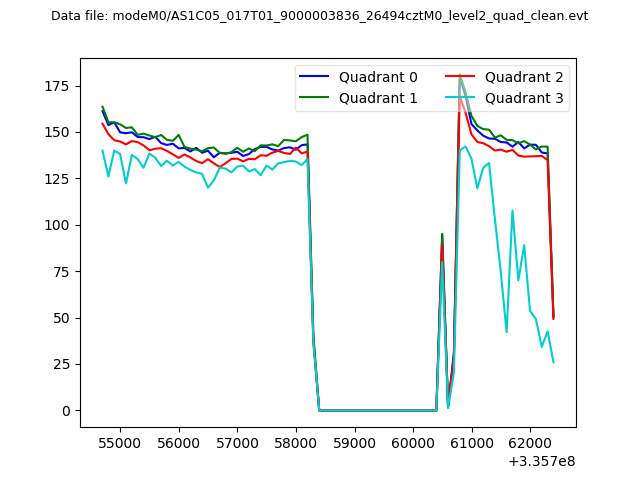 |
|
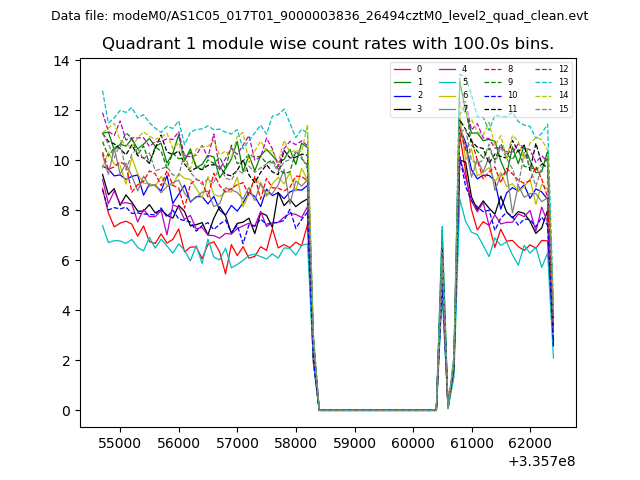
| Module-wise count rates for Quadrant A Data is divided into 100 sec bins |
 |
 |
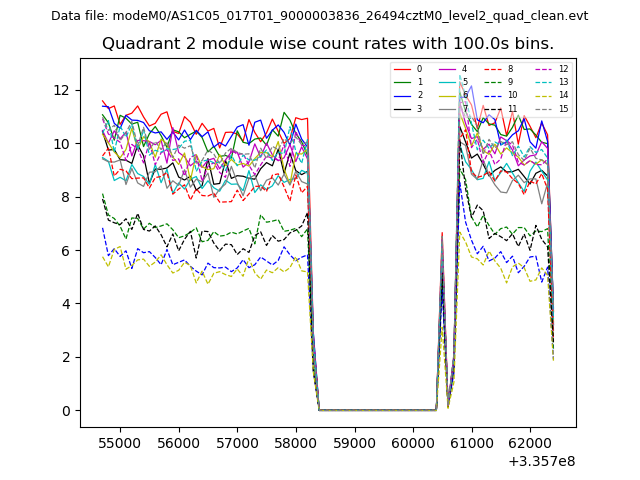
| Module-wise count rates for Quadrant B Data is divided into 100 sec bins |
 |
 |
| Module-wise count rates for Quadrant C Data is divided into 100 sec bins |
 |
 |
| Module-wise count rates for Quadrant D Data is divided into 100 sec bins |
 |
 |
| Parameter | Plot |
|---|---|
| CZT HV Monitor |  |
| D_VDD | 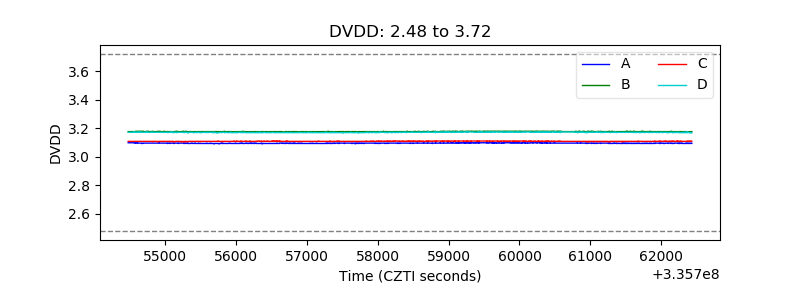 |
| Temperature 1 | 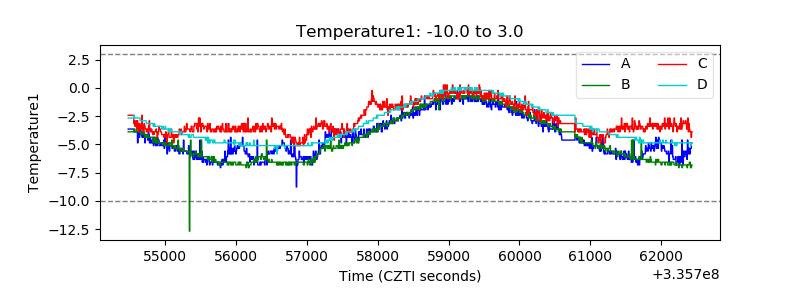 |
| Veto HV Monitor | 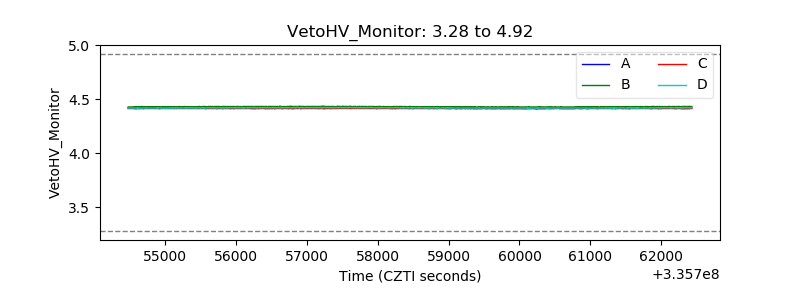 |
| Veto LLD | 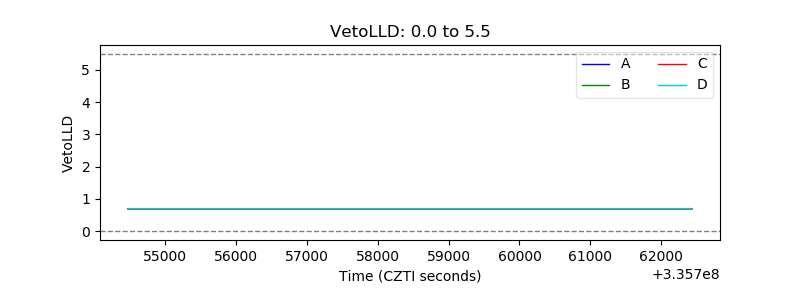 |
| Alpha Counter | 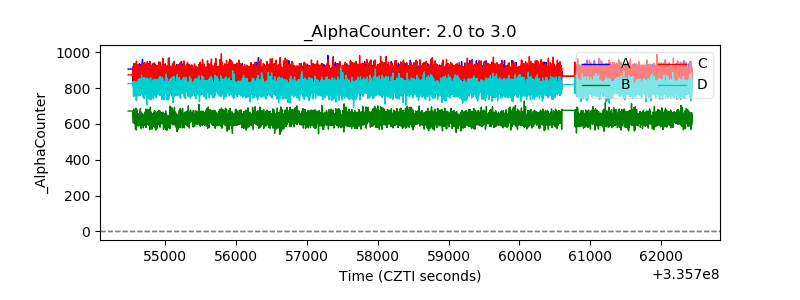 |
| _CPM_Rate | 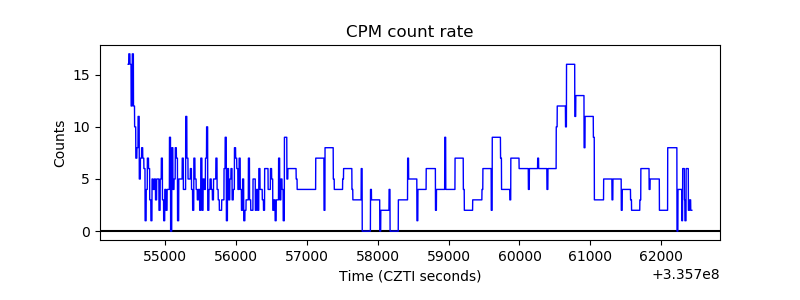 |
| CZT Counter | 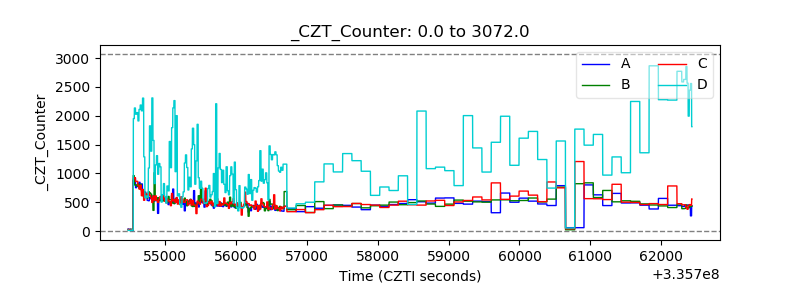 |
| +2.5 Volts monitor | 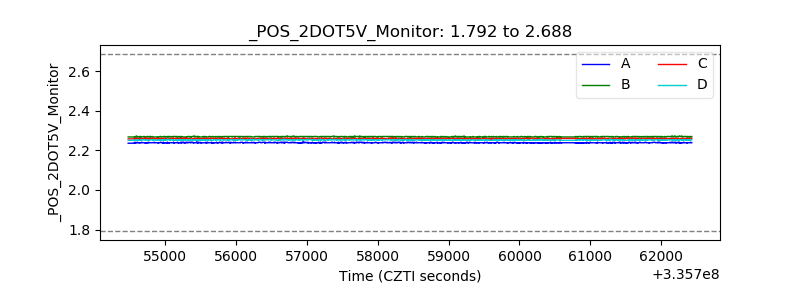 |
| +5 Volts monitor | 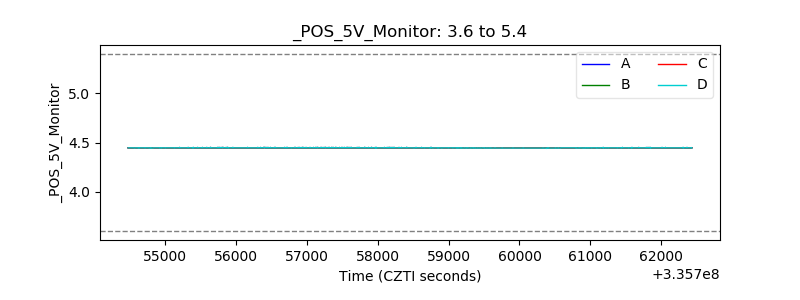 |
| _ROLL_ROT |  |
| _Roll_DEC | 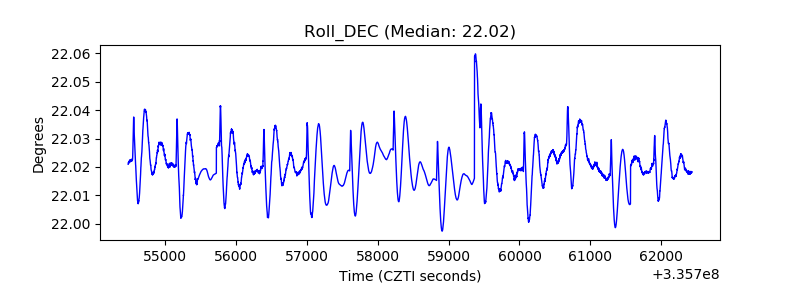 |
| _Roll_RA | 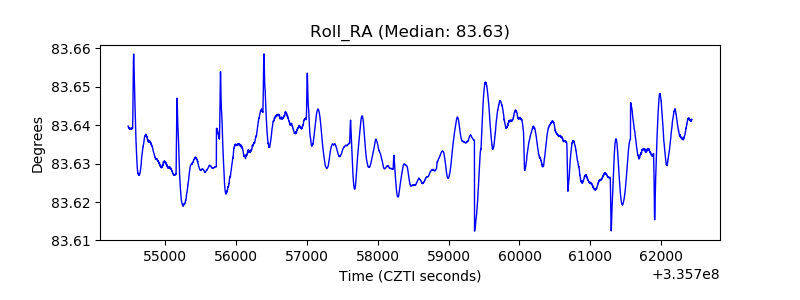 |
| Veto Counter | 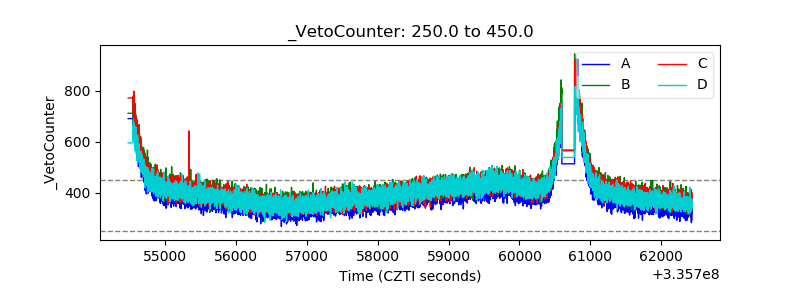 |