| Param | Original file | Final file |
|---|---|---|
| Filename | modeM0/AS1C05_017T01_9000003836_26500cztM0_level2.evt | modeM0/AS1C05_017T01_9000003836_26500cztM0_level2_quad_clean.evt |
| Size (bytes) | 527,846,400 | 84,375,360 |
| Size | 503.4 MB | 80.5 MB |
| Events in quadrant A | 3,034,209 | 555,451 |
| Events in quadrant B | 3,090,536 | 562,552 |
| Events in quadrant C | 4,605,806 | 498,394 |
| Events in quadrant D | 4,850,141 | 521,084 |
| Mode M9 | |||
|---|---|---|---|
| Quadrant | BADHDUFLAG | Total packets | Discarded packets |
| A | 0 | 11 | 0 |
| B | 0 | 11 | 0 |
| C | 0 | 11 | 0 |
| D | 0 | 11 | 0 |
| Mode M0 | |||
|---|---|---|---|
| Quadrant | BADHDUFLAG | Total packets | Discarded packets |
| A | 0 | 12584 | 0 |
| B | 0 | 12672 | 0 |
| C | 0 | 17507 | 0 |
| D | 0 | 18297 | 0 |
| Quadrant | Total seconds | Saturated seconds | Saturation percentage |
|---|---|---|---|
| A | 5977 | 47 | 0.786348% |
| B | 5977 | 56 | 0.936925% |
| C | 5978 | 520 | 8.698561% |
| D | 5978 | 339 | 5.670793% |
Noise dominated data is calculated using 1-second bins in cleaned event files. If a bin has >2000 counts, and if more than 50% of those come from <1% of pixels, then it is considered to be noise-dominated and hence unusable.
| Quadrant | # 1 sec bins | Bins with >0 counts | Bins with >2000 counts | High rate bins dominated by noise | Noise dominated (total time) | Noise dominated (detector-on time) | Marked lightcurve |
|---|---|---|---|---|---|---|---|
| A | 7072 | 5977 | 0 | 0 | 0.00% | 0.00% | 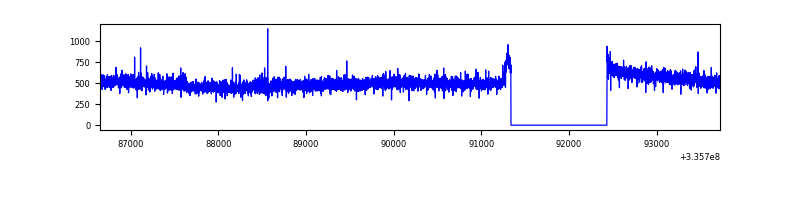 |
| B | 7072 | 5977 | 0 | 0 | 0.00% | 0.00% | 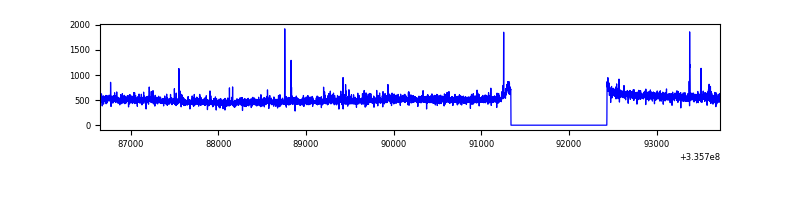 |
| C | 7073 | 5978 | 328 | 328 | 4.64% | 5.49% | 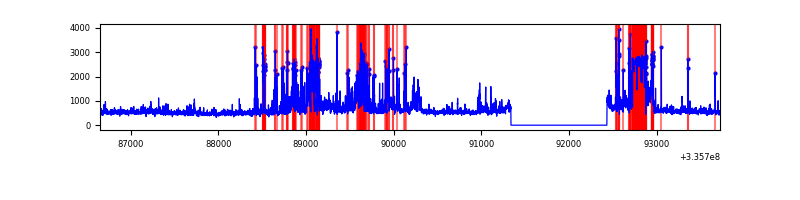 |
| D | 7073 | 5978 | 296 | 296 | 4.18% | 4.95% | 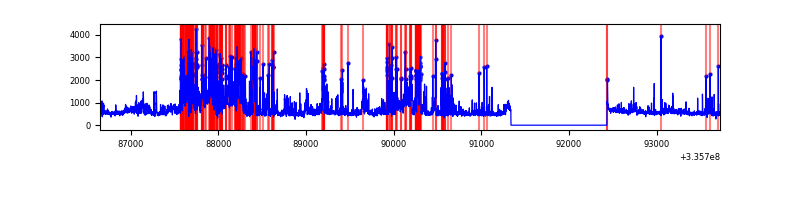 |
Top three noisy pixels from each quadrant. If the there are fewer than three noisy pixels in the level2.evt file, extra rows are filled as -1
| Pixel properties | Quadrant properties | ||||||
|---|---|---|---|---|---|---|---|
| Quadrant | DetID | PixID | Counts | Sigma | Mean | Median | Sigma |
| A | 13 | 254 | 9432 | 54.52 | 787 | 774 | 158.8 |
| A | 3 | 137 | 6819 | 38.07 | 787 | 774 | 158.8 |
| A | 0 | 226 | 6656 | 37.04 | 787 | 774 | 158.8 |
| B | 0 | 190 | 25156 | 164.33 | 777 | 760 | 148.5 |
| B | 12 | 111 | 17130 | 110.26 | 777 | 760 | 148.5 |
| B | 11 | 111 | 15276 | 97.78 | 777 | 760 | 148.5 |
| C | 4 | 254 | 1320418 | 7925.15 | 711 | 719 | 166.5 |
| C | 3 | 233 | 276369 | 1655.35 | 711 | 719 | 166.5 |
| C | 2 | 16 | 124404 | 742.76 | 711 | 719 | 166.5 |
| D | 1 | 52 | 1704788 | 9245.66 | 747 | 730 | 184.3 |
| D | 12 | 233 | 128687 | 694.25 | 747 | 730 | 184.3 |
| D | 11 | 176 | 120629 | 650.53 | 747 | 730 | 184.3 |
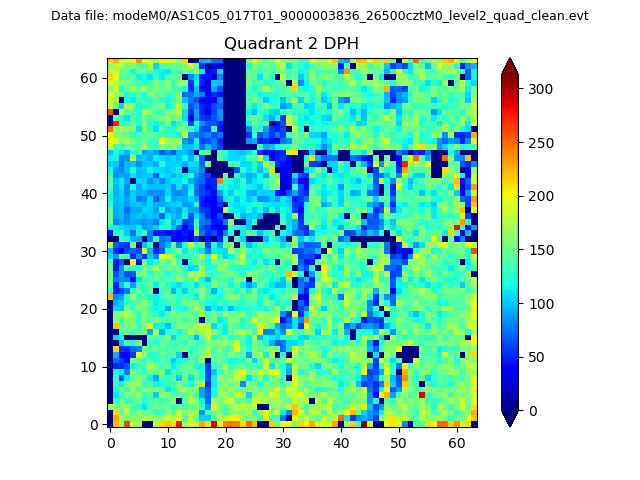
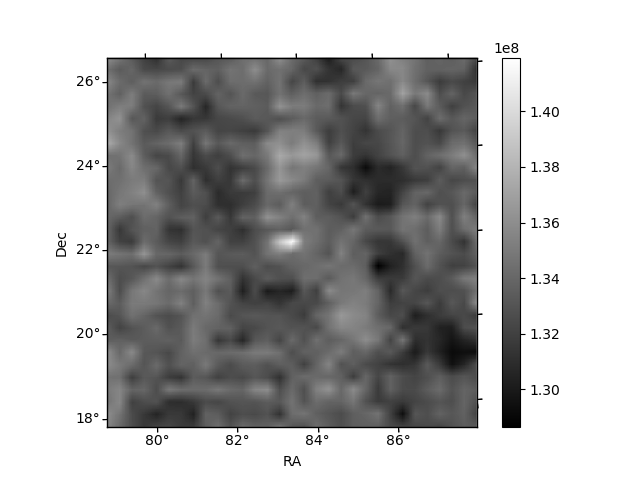
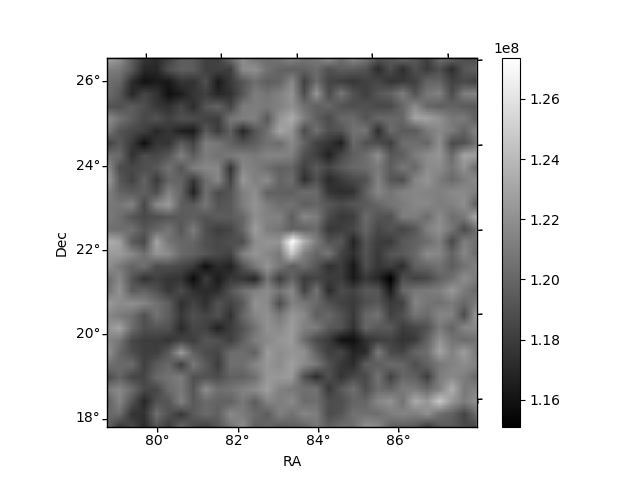
Histogram calculated using DETX and DETY for each event in the final _common_clean file
| Quadrant A | 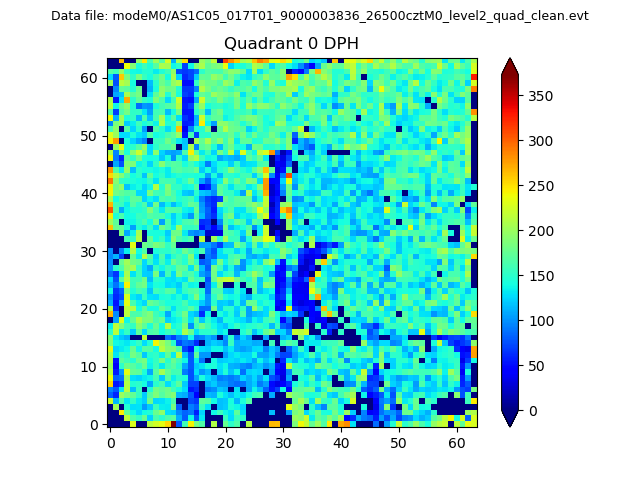 |
 |
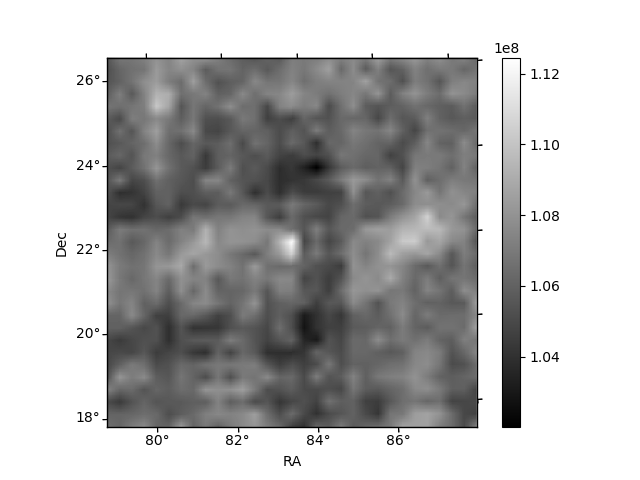
Quadrant B |
|---|---|---|---|
| Quadrant D | 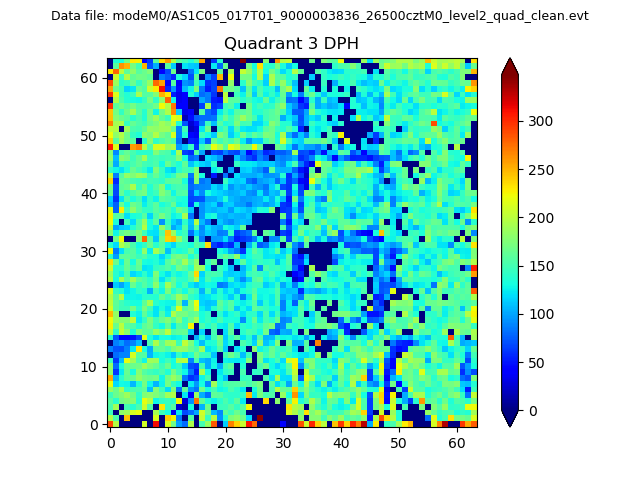 |
 |
Quadrant C |
| Plot type | Count rate plots | Images |
|---|---|---|
| Comparison with Poisson distribution Blue bars denote a histogram of data divided into 1 sec bins. Red curve is a Poisson curve with rate = median count rate of data. |
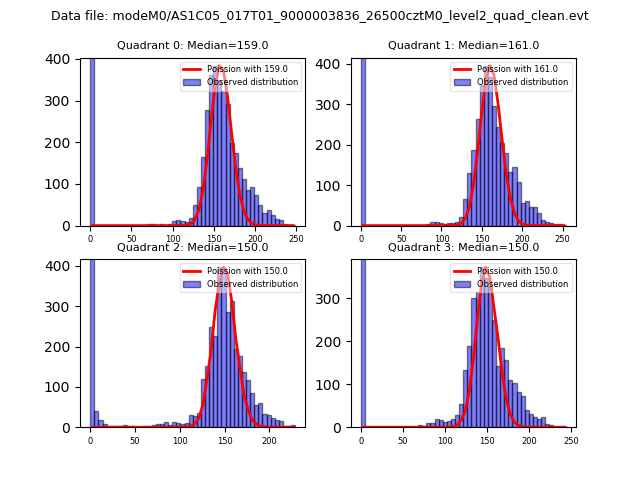 |
 |
| Quadrant-wise count rates Data is divided into 100 sec bins |
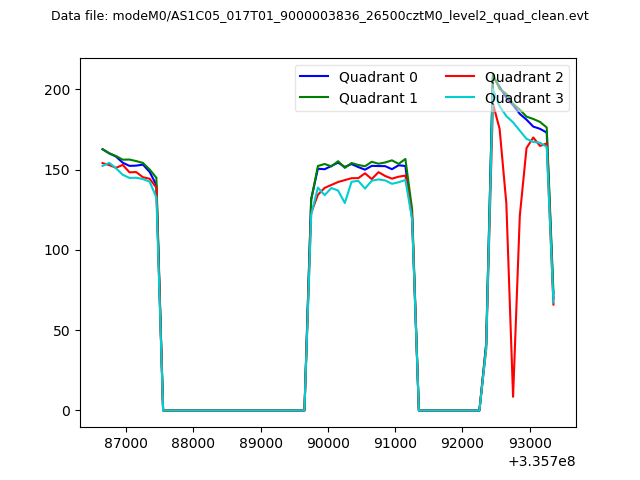 |
|
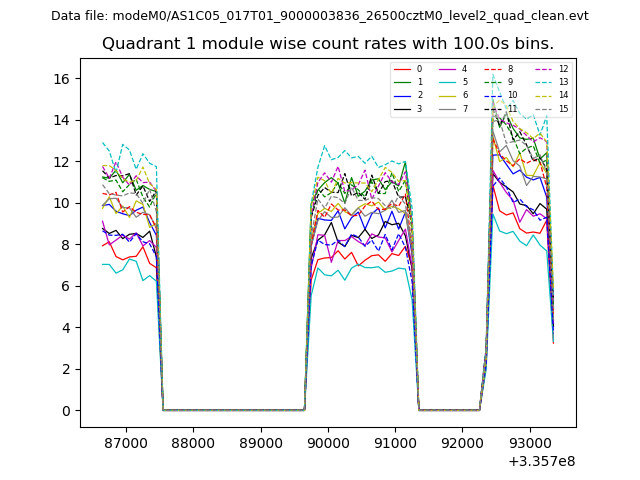
| Module-wise count rates for Quadrant A Data is divided into 100 sec bins |
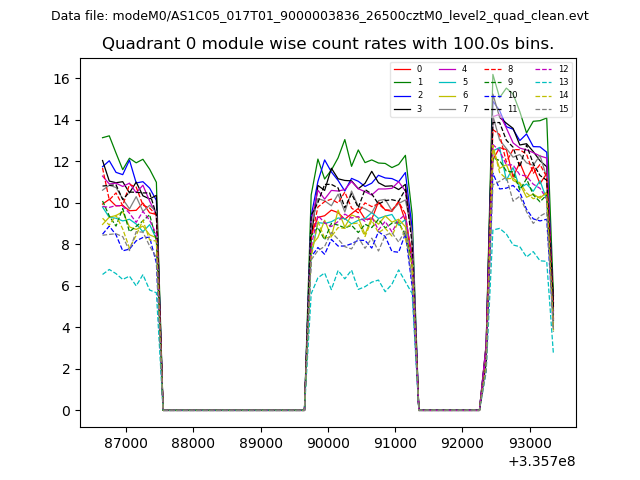 |
 |
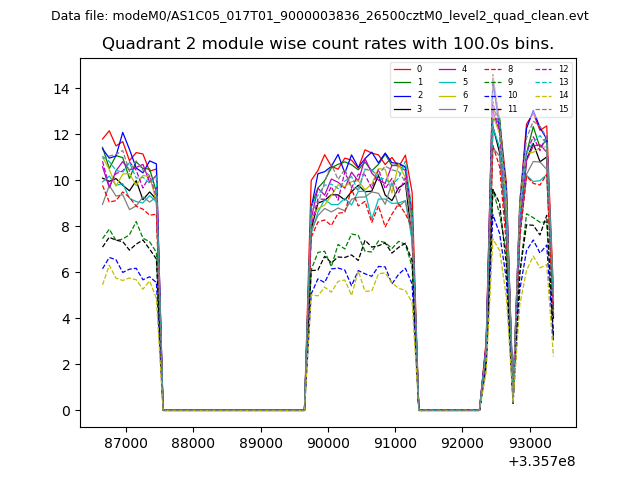
| Module-wise count rates for Quadrant B Data is divided into 100 sec bins |
 |
 |
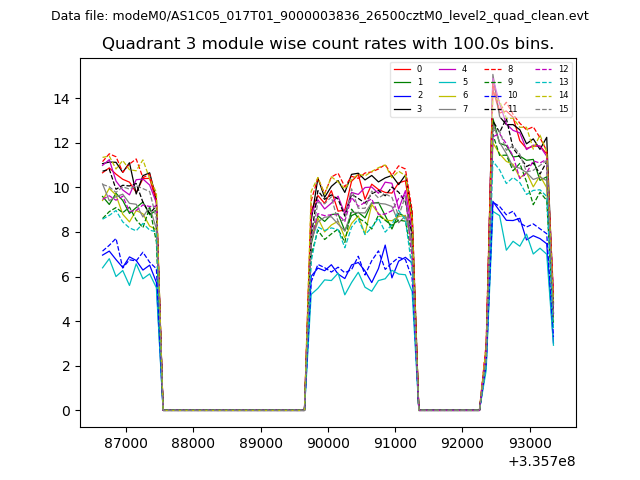
| Module-wise count rates for Quadrant C Data is divided into 100 sec bins |
 |
 |
| Module-wise count rates for Quadrant D Data is divided into 100 sec bins |
 |
 |
| Parameter | Plot |
|---|---|
| CZT HV Monitor | 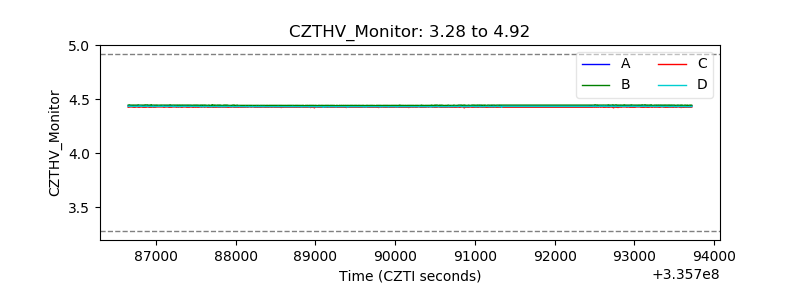 |
| D_VDD | 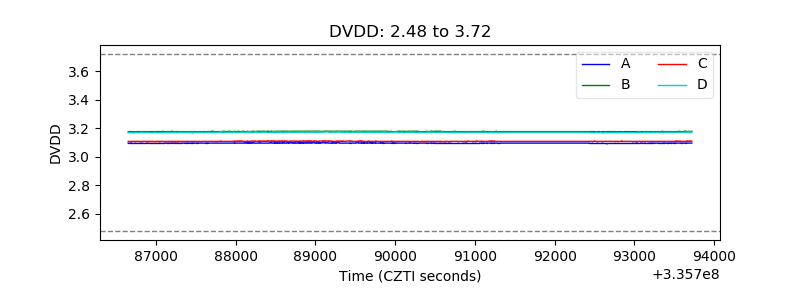 |
| Temperature 1 | 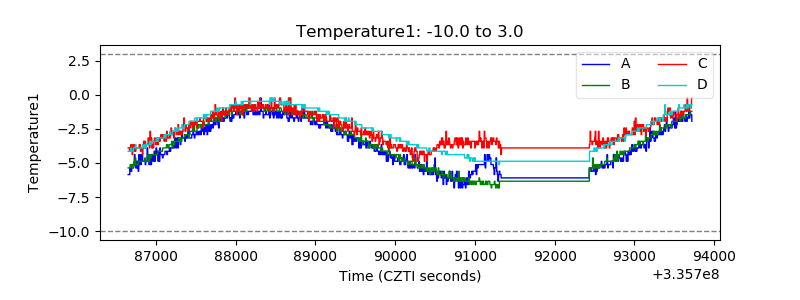 |
| Veto HV Monitor | 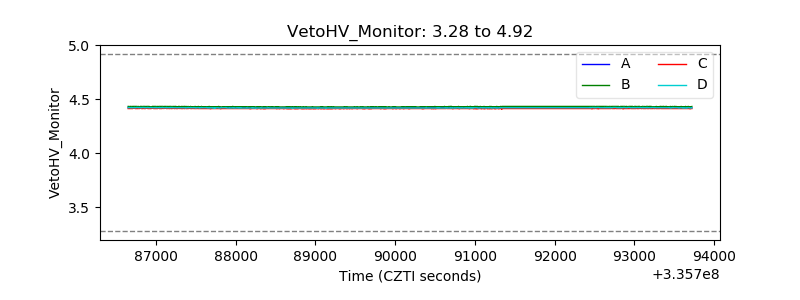 |
| Veto LLD | 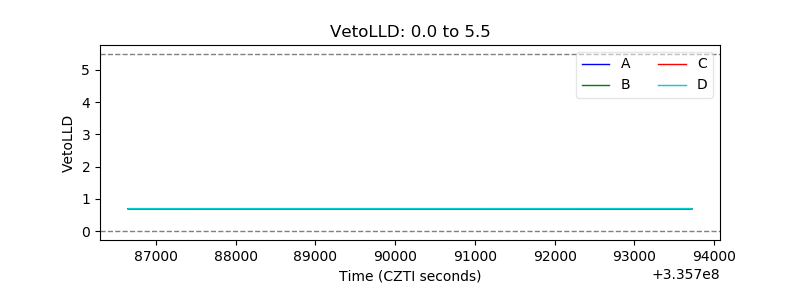 |
| Alpha Counter | 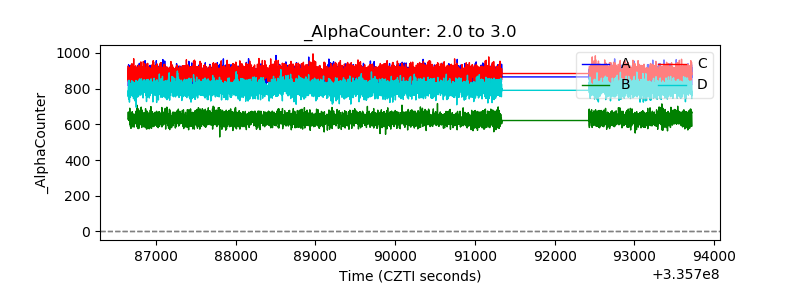 |
| _CPM_Rate | 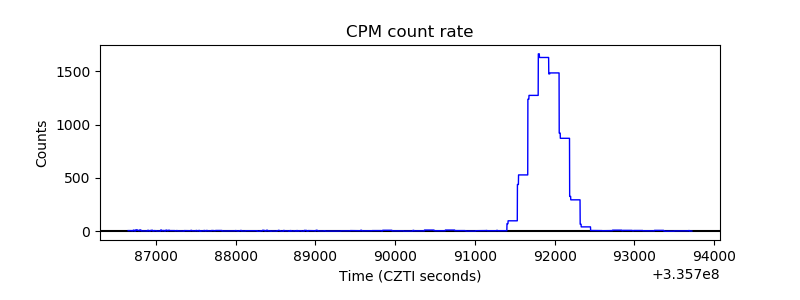 |
| CZT Counter | 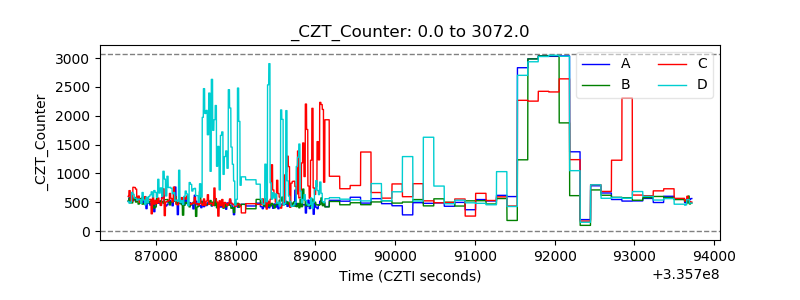 |
| +2.5 Volts monitor |  |
| +5 Volts monitor |  |
| _ROLL_ROT | 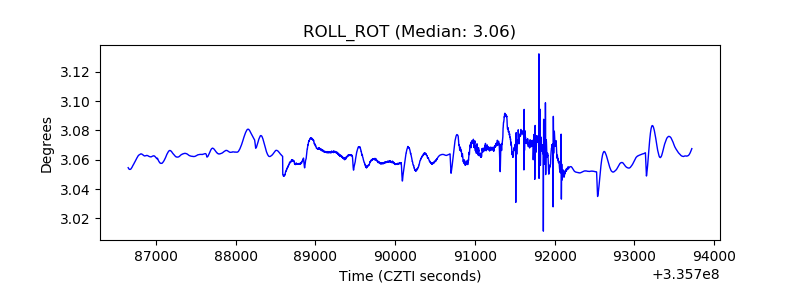 |
| _Roll_DEC |  |
| _Roll_RA | 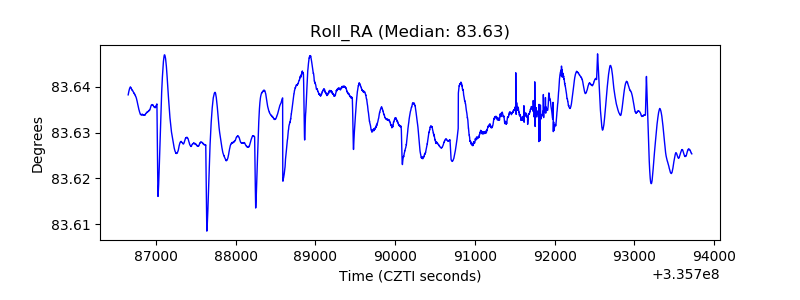 |
| Veto Counter | 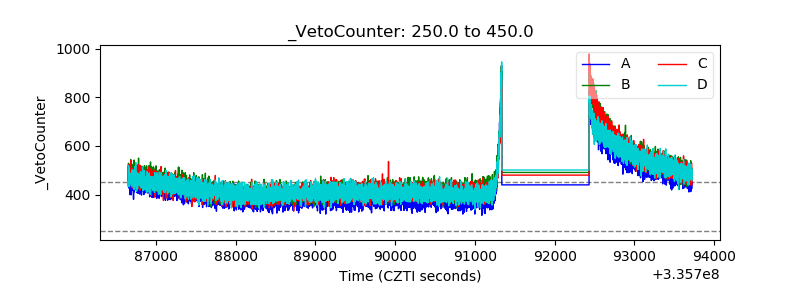 |