| Param | Original file | Final file |
|---|---|---|
| Filename | modeM0/AS1C05_017T01_9000003836_26501cztM0_level2.evt | modeM0/AS1C05_017T01_9000003836_26501cztM0_level2_quad_clean.evt |
| Size (bytes) | 3,006,213,120 | 436,910,400 |
| Size | 2.8 GB | 416.7 MB |
| Events in quadrant A | 16,363,378 | 2,845,554 |
| Events in quadrant B | 17,001,419 | 2,880,670 |
| Events in quadrant C | 19,930,386 | 2,711,928 |
| Events in quadrant D | 35,523,569 | 2,522,235 |
| Mode M9 | |||
|---|---|---|---|
| Quadrant | BADHDUFLAG | Total packets | Discarded packets |
| A | 0 | 51 | 1 |
| B | 0 | 51 | 1 |
| C | 0 | 51 | 0 |
| D | 0 | 51 | 2 |
| Mode M0 | |||
|---|---|---|---|
| Quadrant | BADHDUFLAG | Total packets | Discarded packets |
| A | 0 | 68930 | 0 |
| B | 0 | 70537 | 0 |
| C | 0 | 80313 | 0 |
| D | 0 | 127935 | 0 |
| Quadrant | Total seconds | Saturated seconds | Saturation percentage |
|---|---|---|---|
| A | 33070 | 269 | 0.813426% |
| B | 33076 | 367 | 1.109566% |
| C | 33069 | 1031 | 3.117724% |
| D | 33070 | 5161 | 15.606290% |
Noise dominated data is calculated using 1-second bins in cleaned event files. If a bin has >2000 counts, and if more than 50% of those come from <1% of pixels, then it is considered to be noise-dominated and hence unusable.
| Quadrant | # 1 sec bins | Bins with >0 counts | Bins with >2000 counts | High rate bins dominated by noise | Noise dominated (total time) | Noise dominated (detector-on time) | Marked lightcurve |
|---|---|---|---|---|---|---|---|
| A | 38067 | 33092 | 0 | 0 | 0.00% | 0.00% | 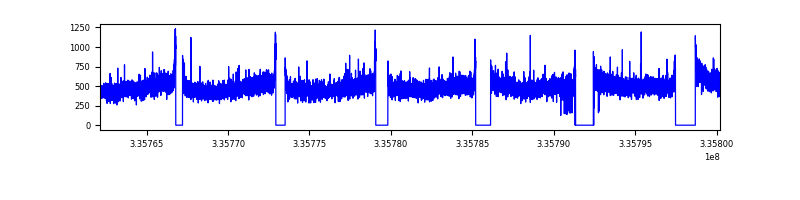 |
| B | 38068 | 33092 | 33 | 33 | 0.09% | 0.10% | 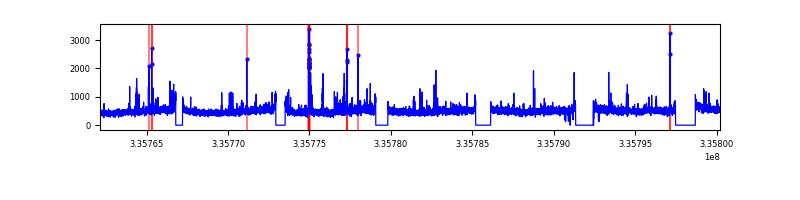 |
| C | 38068 | 33080 | 354 | 354 | 0.93% | 1.07% | 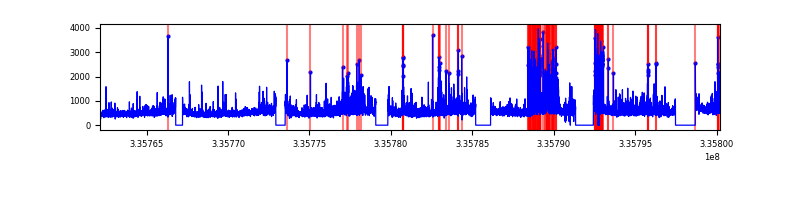 |
| D | 38068 | 33091 | 4370 | 4370 | 11.48% | 13.21% | 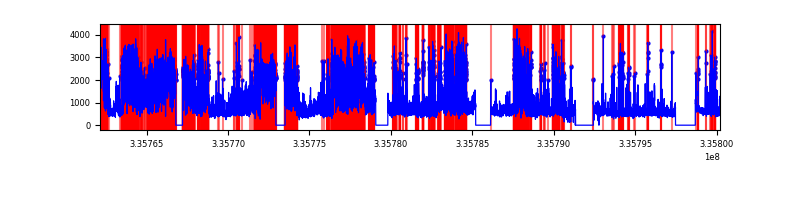 |
Top three noisy pixels from each quadrant. If the there are fewer than three noisy pixels in the level2.evt file, extra rows are filled as -1
| Pixel properties | Quadrant properties | ||||||
|---|---|---|---|---|---|---|---|
| Quadrant | DetID | PixID | Counts | Sigma | Mean | Median | Sigma |
| A | 13 | 254 | 53261 | 57.93 | 4244 | 4168 | 847.5 |
| A | 3 | 137 | 37554 | 39.39 | 4244 | 4168 | 847.5 |
| A | 0 | 226 | 36116 | 37.7 | 4244 | 4168 | 847.5 |
| B | 0 | 190 | 198179 | 246.31 | 4206 | 4113 | 787.9 |
| B | 15 | 222 | 131356 | 161.5 | 4206 | 4113 | 787.9 |
| B | 12 | 111 | 94179 | 114.31 | 4206 | 4113 | 787.9 |
| C | 3 | 233 | 1852272 | 1981.2 | 4002 | 4048 | 932.9 |
| C | 4 | 254 | 1425341 | 1523.55 | 4002 | 4048 | 932.9 |
| C | 14 | 238 | 640745 | 682.51 | 4002 | 4048 | 932.9 |
| D | 1 | 52 | 15006207 | 16203.79 | 3882 | 3800 | 925.9 |
| D | 12 | 233 | 4530480 | 4889.17 | 3882 | 3800 | 925.9 |
| D | 7 | 80 | 785437 | 844.23 | 3882 | 3800 | 925.9 |
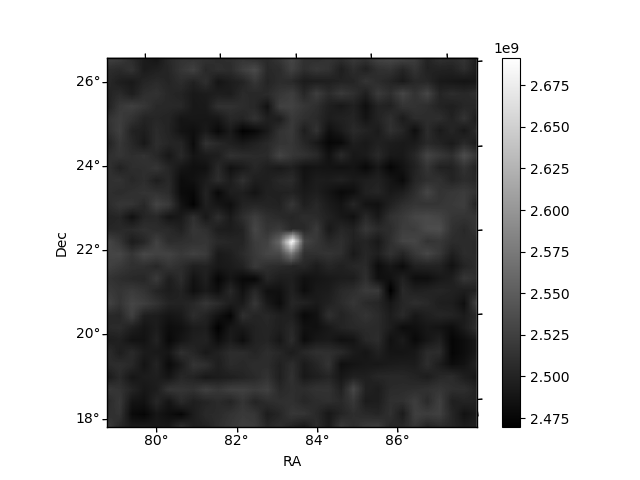
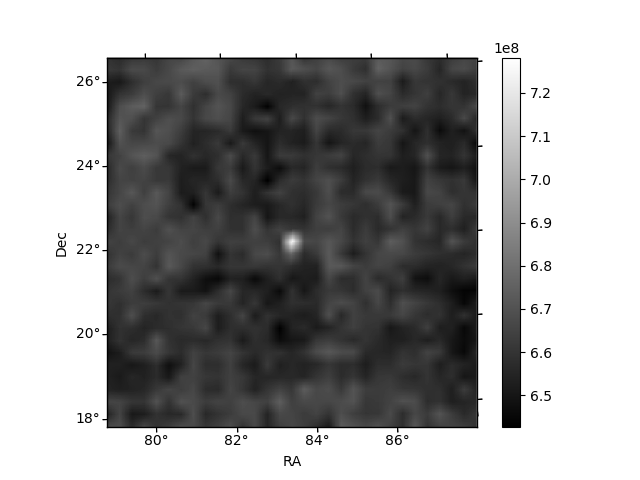
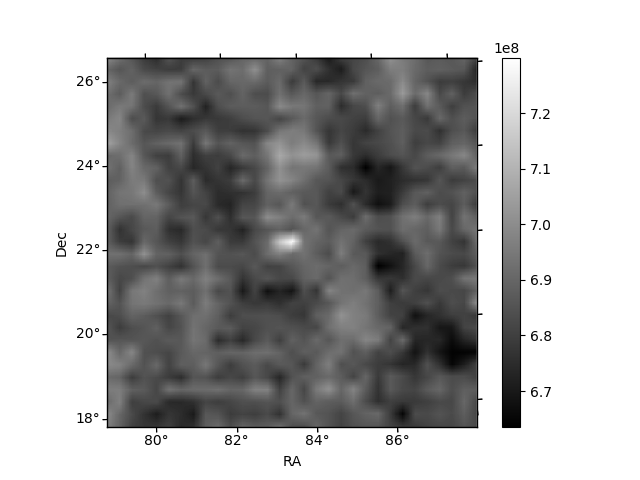
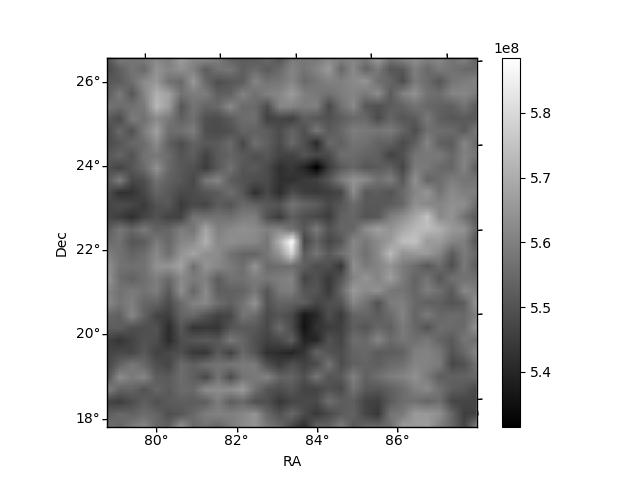
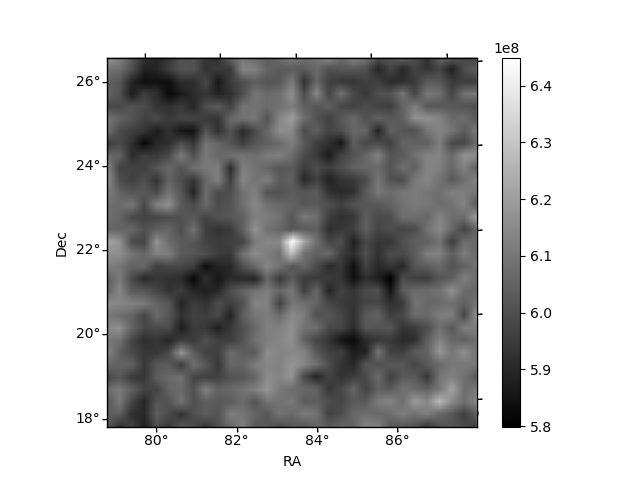
Histogram calculated using DETX and DETY for each event in the final _common_clean file
| Quadrant A | 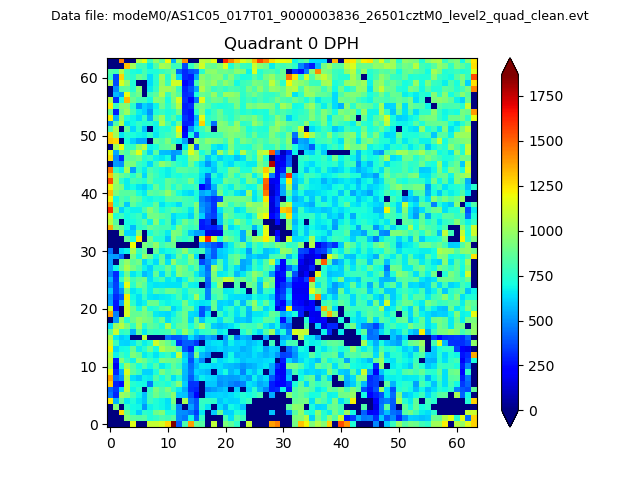 |
 |
Quadrant B |
|---|---|---|---|
| Quadrant D | 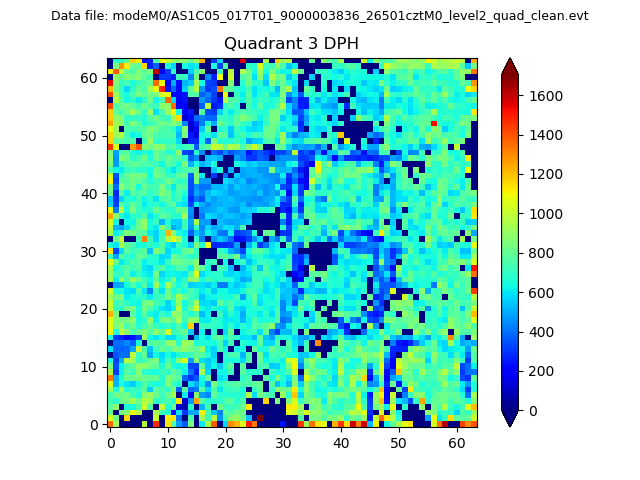 |
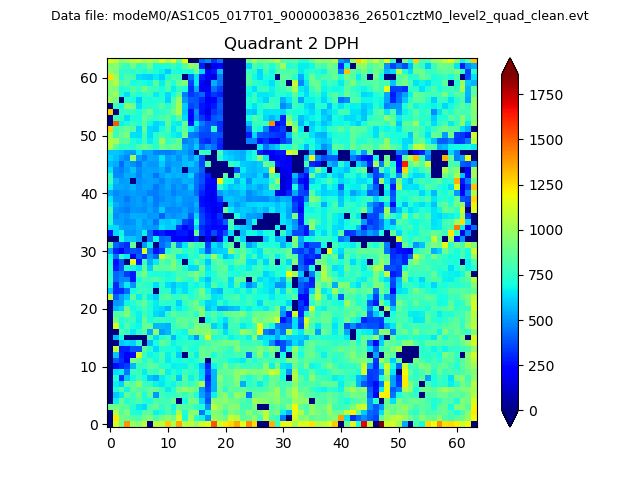 |
Quadrant C |
| Plot type | Count rate plots | Images |
|---|---|---|
| Comparison with Poisson distribution Blue bars denote a histogram of data divided into 1 sec bins. Red curve is a Poisson curve with rate = median count rate of data. |
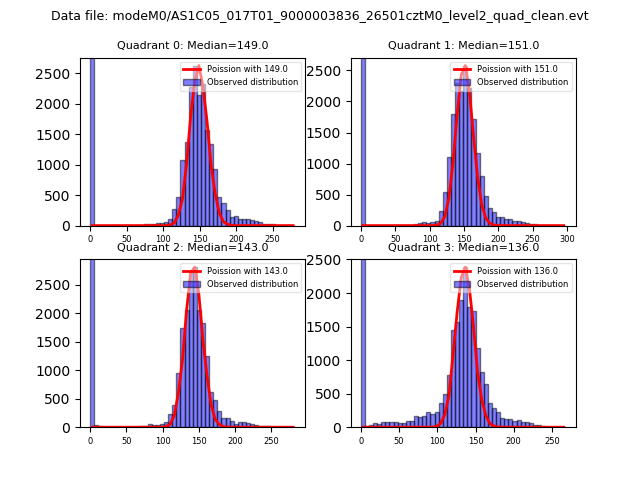 |
 |
| Quadrant-wise count rates Data is divided into 100 sec bins |
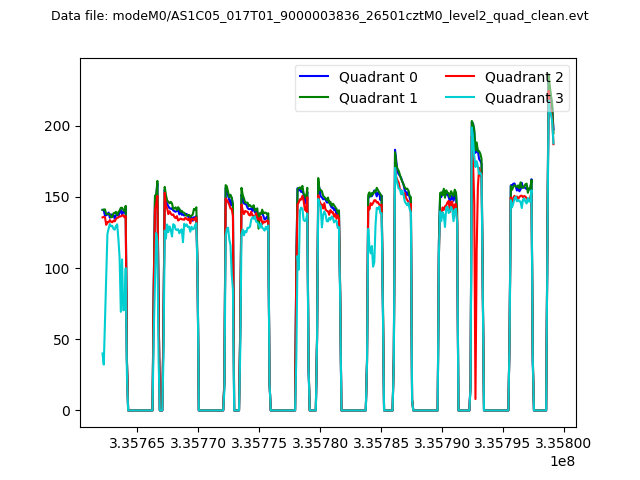 |
|
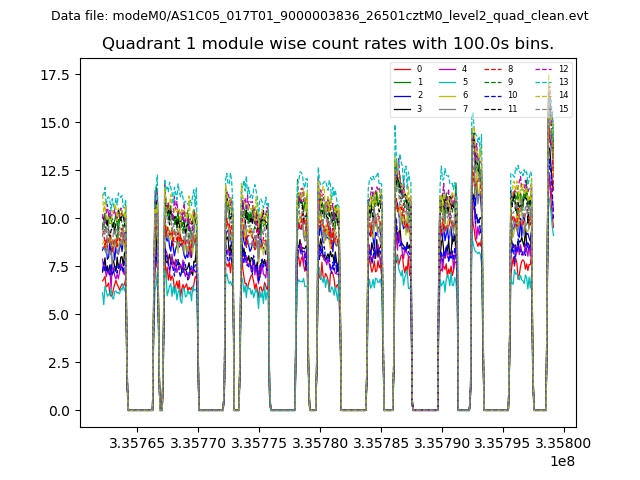
| Module-wise count rates for Quadrant A Data is divided into 100 sec bins |
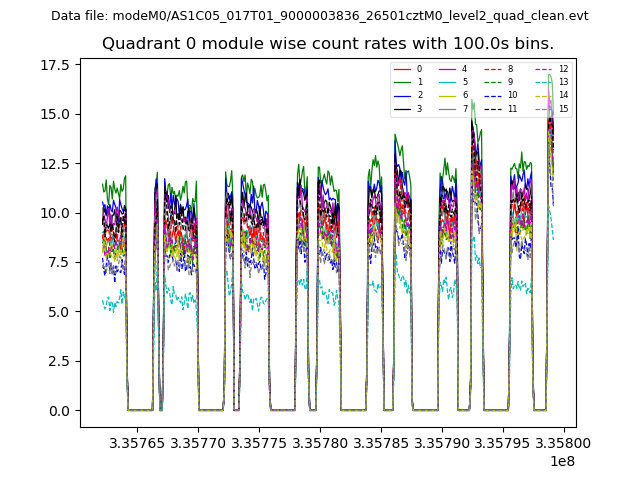 |
 |
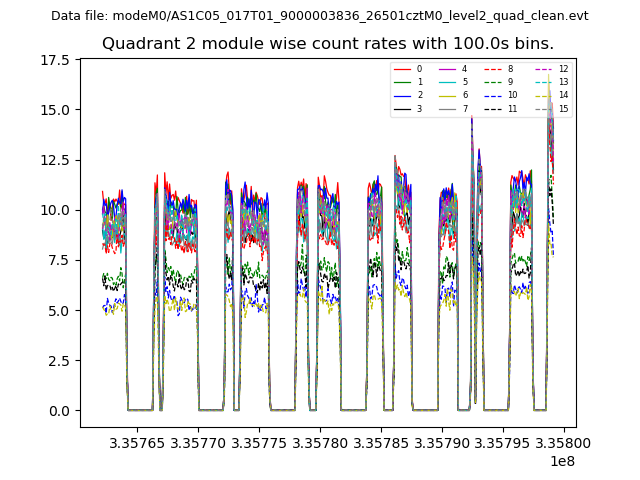
| Module-wise count rates for Quadrant B Data is divided into 100 sec bins |
 |
 |
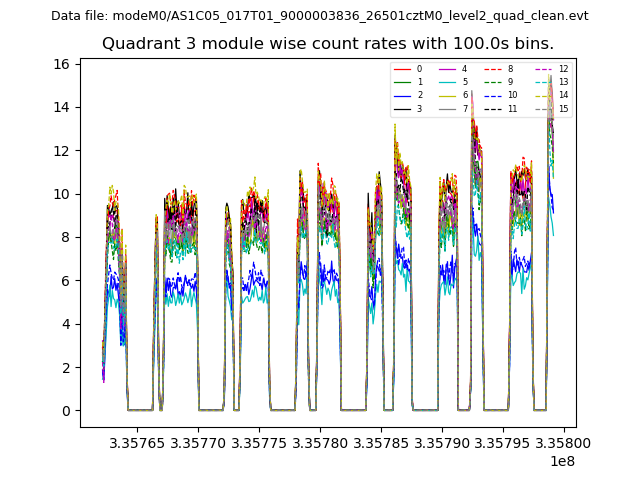
| Module-wise count rates for Quadrant C Data is divided into 100 sec bins |
 |
 |
| Module-wise count rates for Quadrant D Data is divided into 100 sec bins |
 |
 |
| Parameter | Plot |
|---|---|
| CZT HV Monitor | 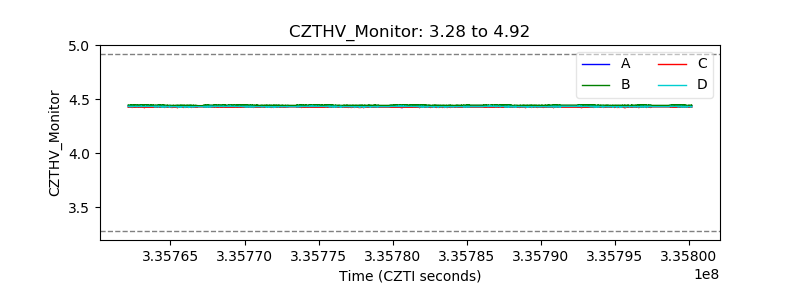 |
| D_VDD | 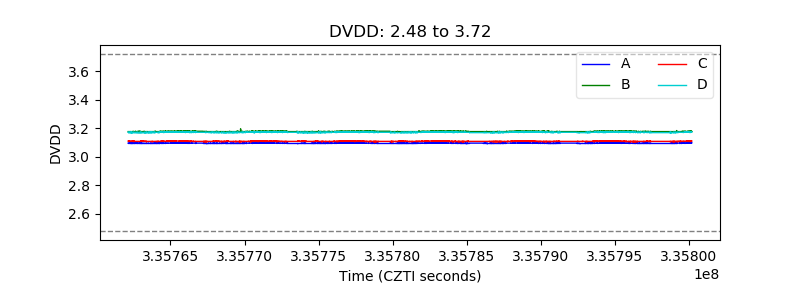 |
| Temperature 1 | 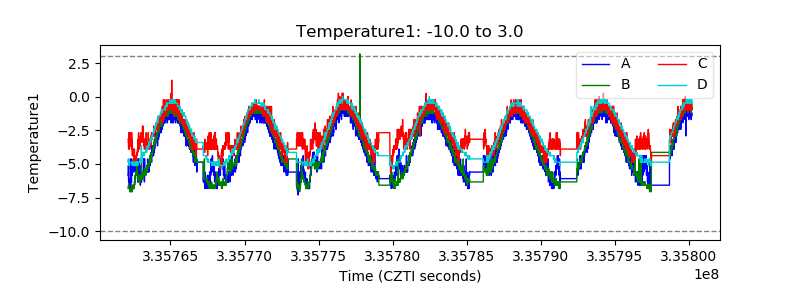 |
| Veto HV Monitor | 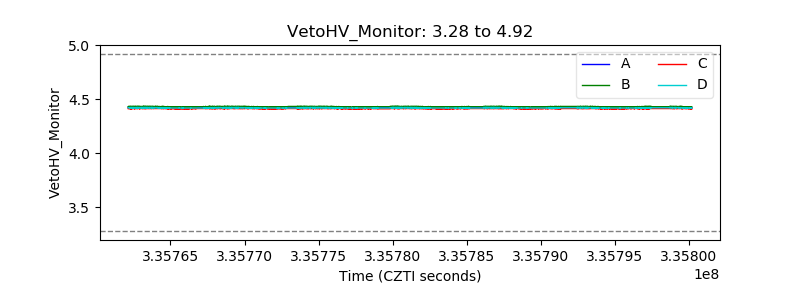 |
| Veto LLD |  |
| Alpha Counter | 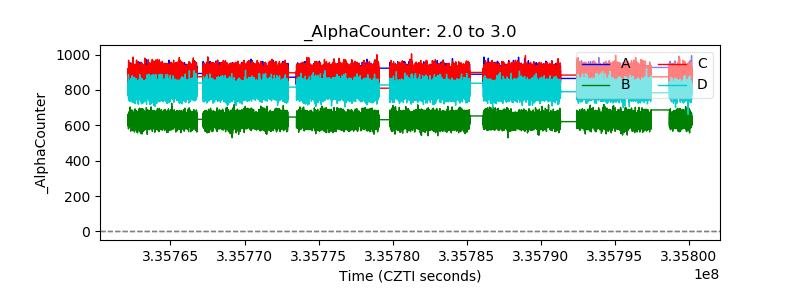 |
| _CPM_Rate | 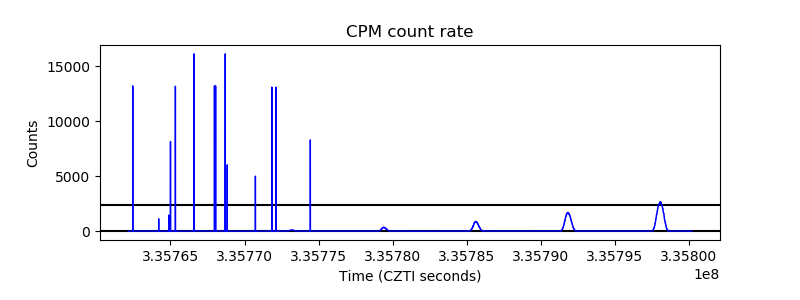 |
| CZT Counter | 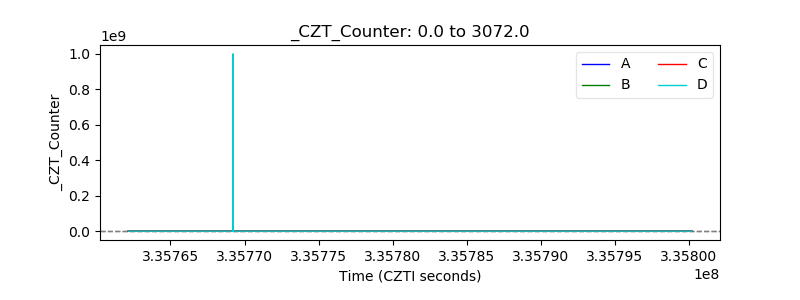 |
| +2.5 Volts monitor |  |
| +5 Volts monitor |  |
| _ROLL_ROT | 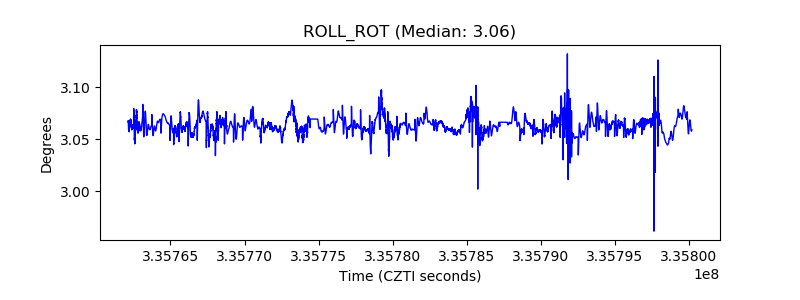 |
| _Roll_DEC | 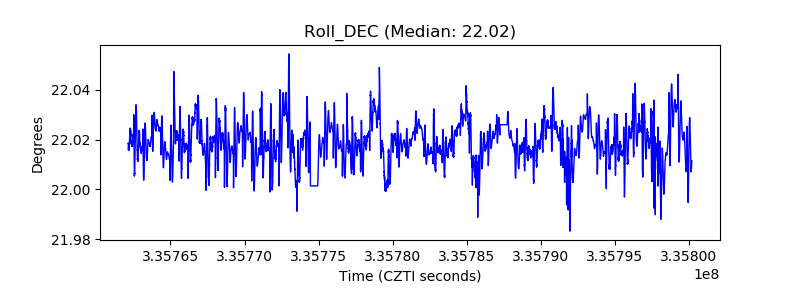 |
| _Roll_RA | 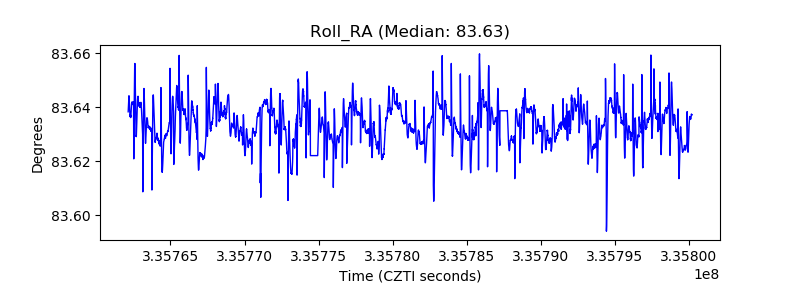 |
| Veto Counter | 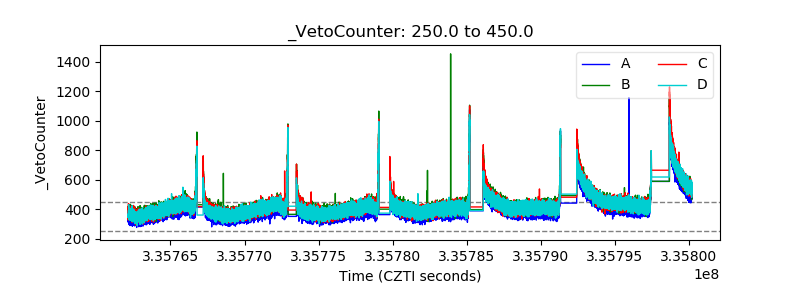 |