| Param | Original file | Final file |
|---|---|---|
| Filename | modeM0/AS1C05_017T01_9000003836_26502cztM0_level2.evt | modeM0/AS1C05_017T01_9000003836_26502cztM0_level2_quad_clean.evt |
| Size (bytes) | 602,127,360 | 80,982,720 |
| Size | 574.2 MB | 77.2 MB |
| Events in quadrant A | 3,746,873 | 514,268 |
| Events in quadrant B | 3,844,669 | 517,087 |
| Events in quadrant C | 4,786,356 | 490,301 |
| Events in quadrant D | 5,420,718 | 479,741 |
| Mode M9 | |||
|---|---|---|---|
| Quadrant | BADHDUFLAG | Total packets | Discarded packets |
| A | 0 | 13 | 0 |
| B | 0 | 13 | 0 |
| C | 0 | 13 | 0 |
| D | 0 | 13 | 0 |
| Mode M0 | |||
|---|---|---|---|
| Quadrant | BADHDUFLAG | Total packets | Discarded packets |
| A | 0 | 15247 | 0 |
| B | 0 | 15509 | 0 |
| C | 0 | 18966 | 0 |
| D | 0 | 20628 | 0 |
| Quadrant | Total seconds | Saturated seconds | Saturation percentage |
|---|---|---|---|
| A | 6464 | 102 | 1.577970% |
| B | 6465 | 111 | 1.716937% |
| C | 6465 | 272 | 4.207270% |
| D | 6464 | 540 | 8.353960% |
Noise dominated data is calculated using 1-second bins in cleaned event files. If a bin has >2000 counts, and if more than 50% of those come from <1% of pixels, then it is considered to be noise-dominated and hence unusable.
| Quadrant | # 1 sec bins | Bins with >0 counts | Bins with >2000 counts | High rate bins dominated by noise | Noise dominated (total time) | Noise dominated (detector-on time) | Marked lightcurve |
|---|---|---|---|---|---|---|---|
| A | 7744 | 6464 | 0 | 0 | 0.00% | 0.00% | 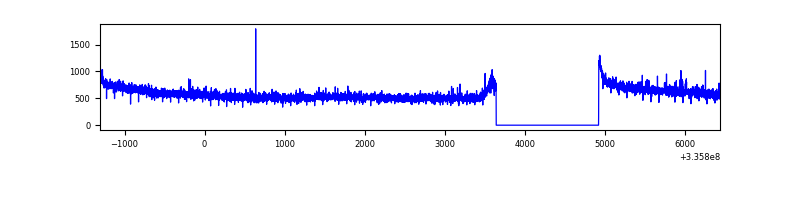 |
| B | 7745 | 6465 | 9 | 9 | 0.12% | 0.14% | 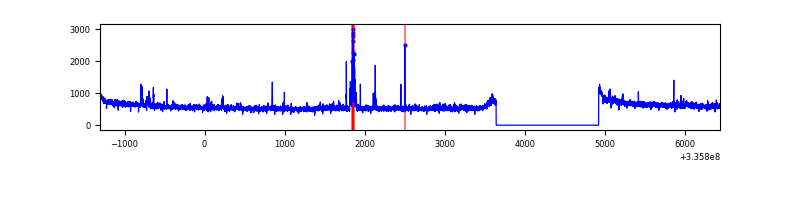 |
| C | 7745 | 6465 | 76 | 76 | 0.98% | 1.18% | 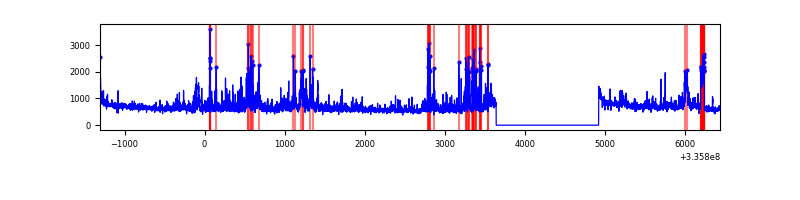 |
| D | 7744 | 6464 | 414 | 414 | 5.35% | 6.40% | 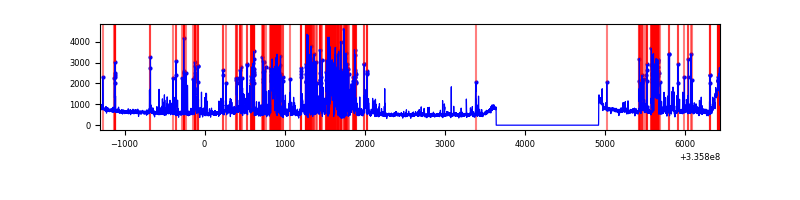 |
Top three noisy pixels from each quadrant. If the there are fewer than three noisy pixels in the level2.evt file, extra rows are filled as -1
| Pixel properties | Quadrant properties | ||||||
|---|---|---|---|---|---|---|---|
| Quadrant | DetID | PixID | Counts | Sigma | Mean | Median | Sigma |
| A | 13 | 254 | 10734 | 51.15 | 968 | 955 | 191.2 |
| A | 0 | 226 | 8441 | 39.16 | 968 | 955 | 191.2 |
| A | 3 | 137 | 7531 | 34.4 | 968 | 955 | 191.2 |
| B | 15 | 33 | 55373 | 310.95 | 949 | 932 | 175.1 |
| B | 0 | 190 | 35051 | 194.88 | 949 | 932 | 175.1 |
| B | 0 | 219 | 20793 | 113.44 | 949 | 932 | 175.1 |
| C | 3 | 233 | 880779 | 4221.79 | 912 | 924 | 208.4 |
| C | 4 | 254 | 159300 | 759.93 | 912 | 924 | 208.4 |
| C | 14 | 238 | 148989 | 710.46 | 912 | 924 | 208.4 |
| D | 1 | 52 | 1184123 | 5459.21 | 916 | 900 | 216.7 |
| D | 12 | 233 | 588173 | 2709.59 | 916 | 900 | 216.7 |
| D | 15 | 0 | 93701 | 428.17 | 916 | 900 | 216.7 |
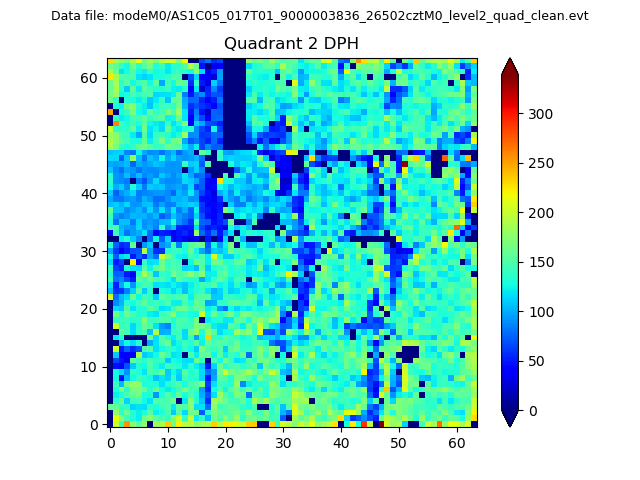
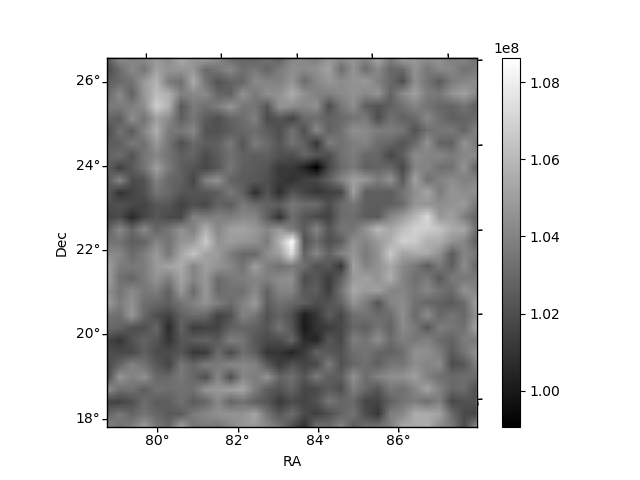
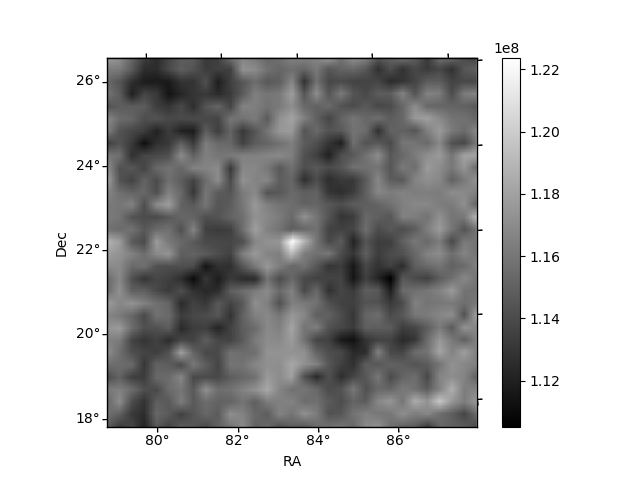
Histogram calculated using DETX and DETY for each event in the final _common_clean file
| Quadrant A | 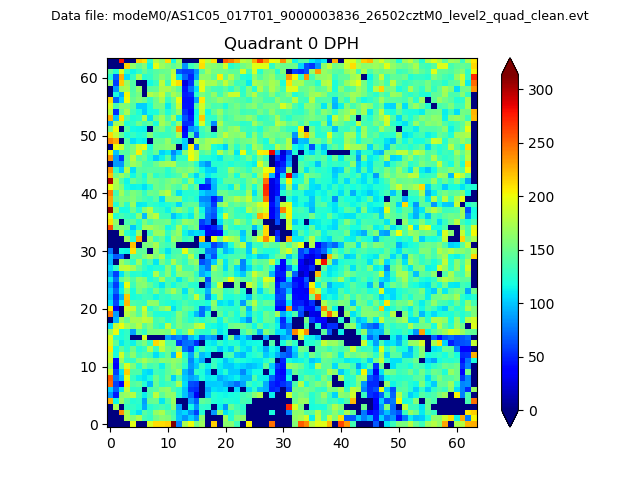 |
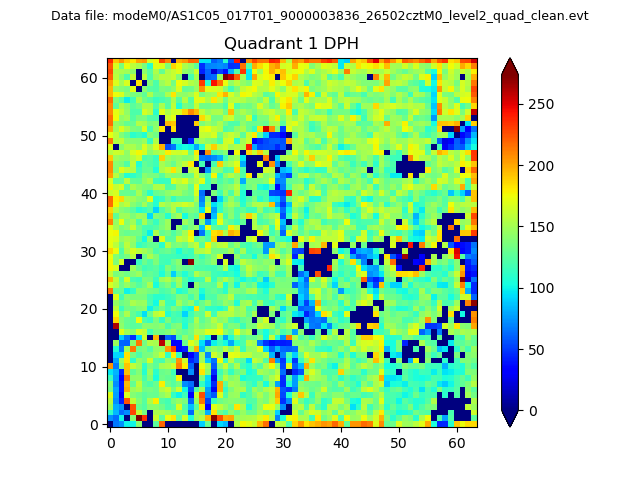 |
Quadrant B |
|---|---|---|---|
| Quadrant D | 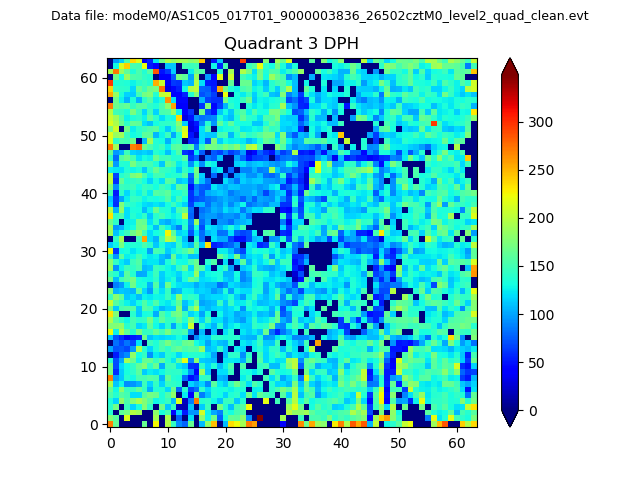 |
 |
Quadrant C |
| Plot type | Count rate plots | Images |
|---|---|---|
| Comparison with Poisson distribution Blue bars denote a histogram of data divided into 1 sec bins. Red curve is a Poisson curve with rate = median count rate of data. |
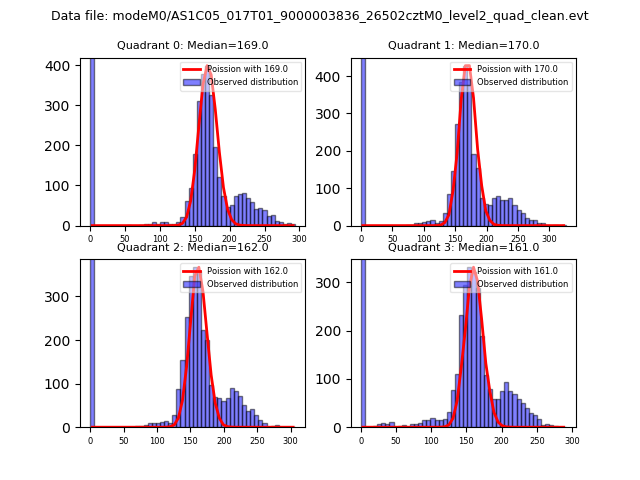 |
 |
| Quadrant-wise count rates Data is divided into 100 sec bins |
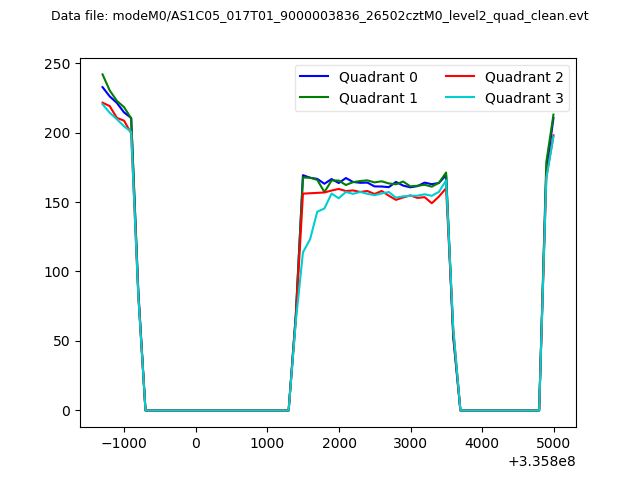 |
|
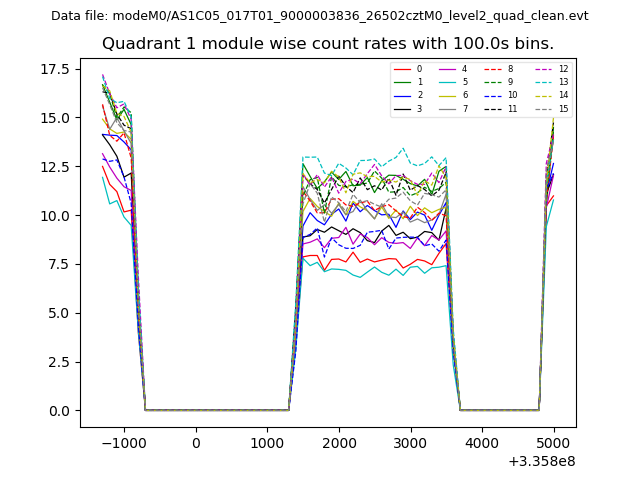
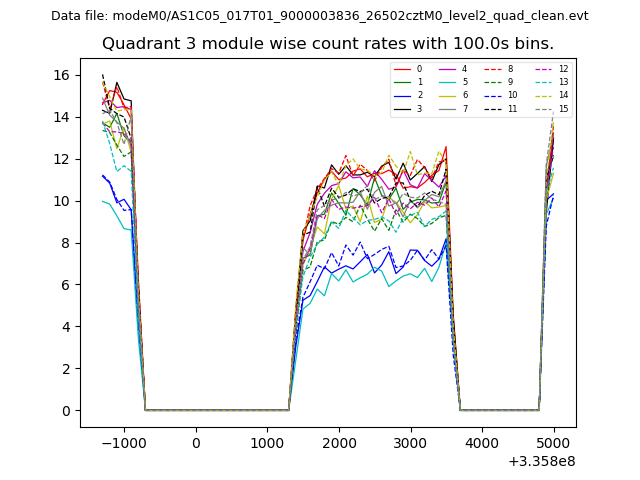
| Module-wise count rates for Quadrant A Data is divided into 100 sec bins |
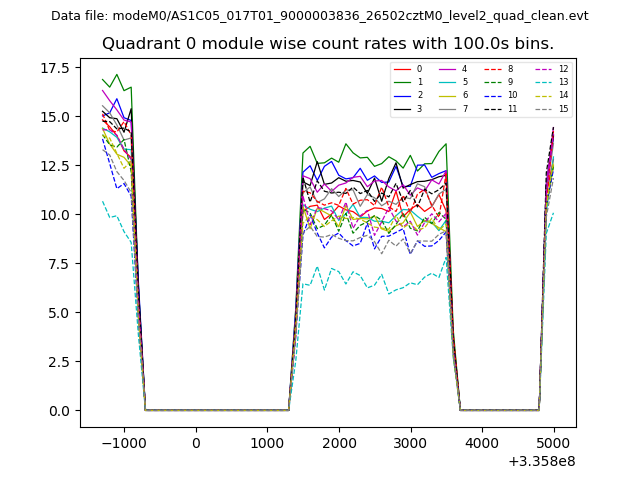 |
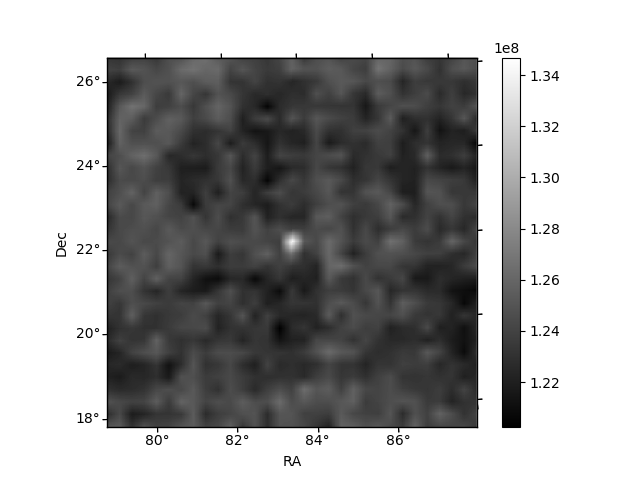 |
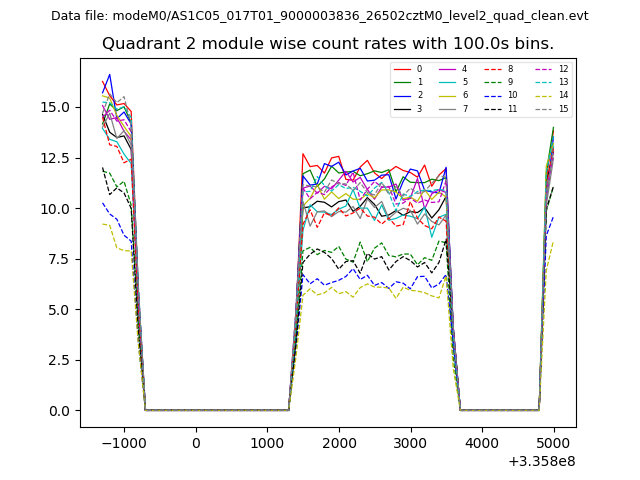
| Module-wise count rates for Quadrant B Data is divided into 100 sec bins |
 |
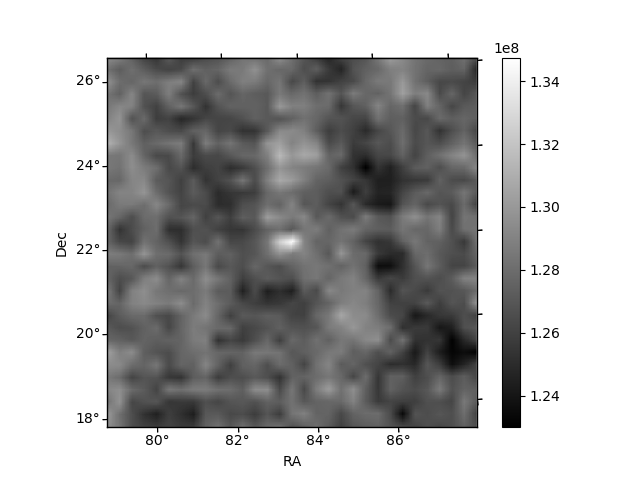 |
| Module-wise count rates for Quadrant C Data is divided into 100 sec bins |
 |
 |
| Module-wise count rates for Quadrant D Data is divided into 100 sec bins |
 |
 |
| Parameter | Plot |
|---|---|
| CZT HV Monitor | 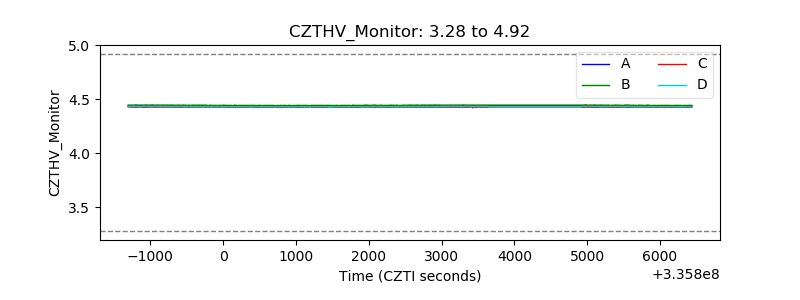 |
| D_VDD | 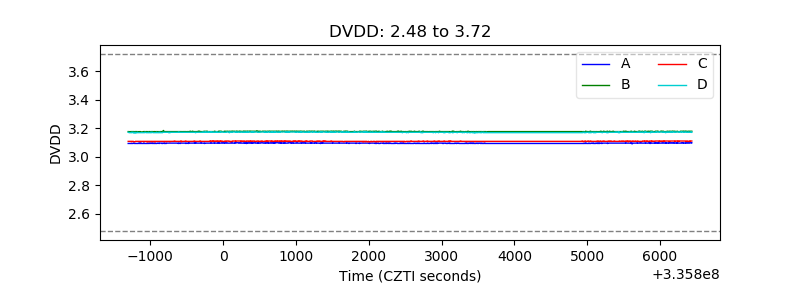 |
| Temperature 1 | 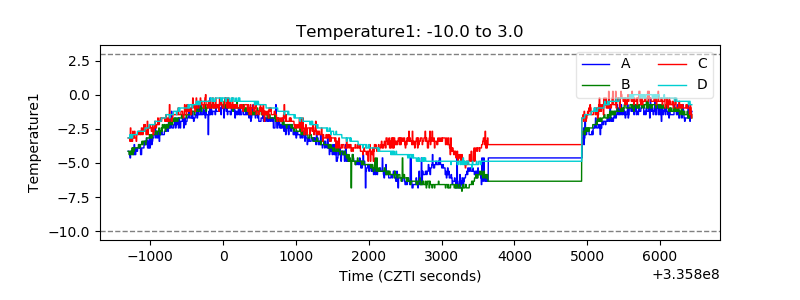 |
| Veto HV Monitor | 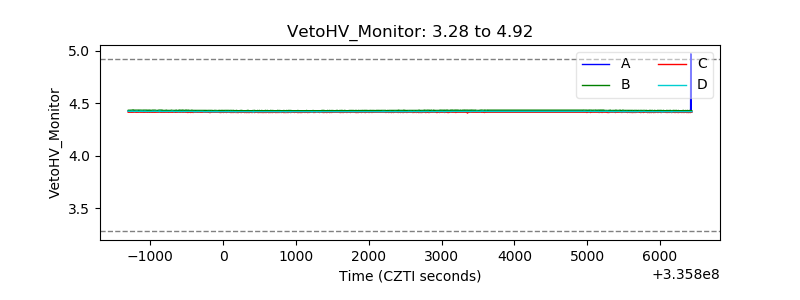 |
| Veto LLD | 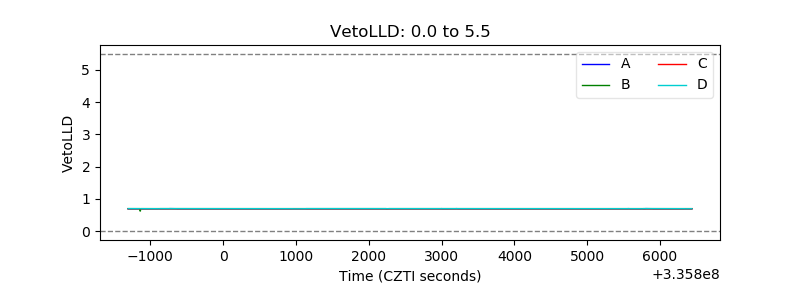 |
| Alpha Counter | 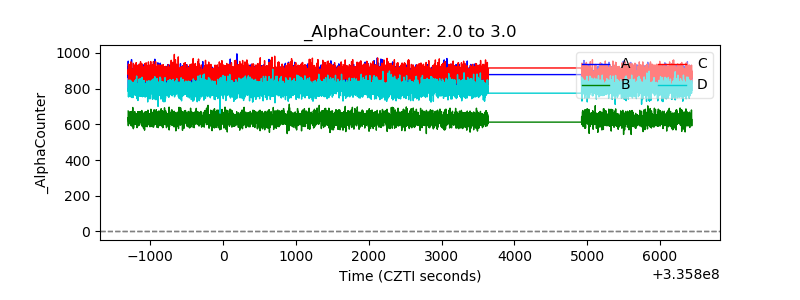 |
| _CPM_Rate | 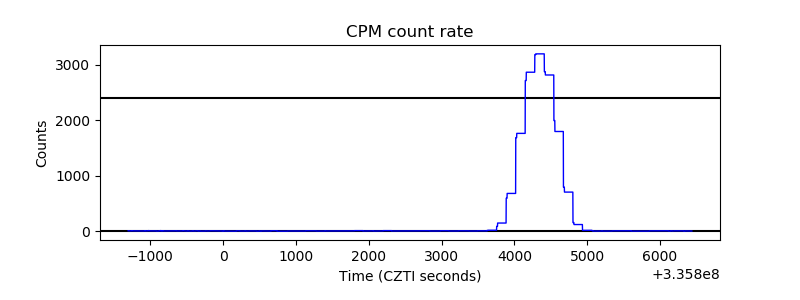 |
| CZT Counter | 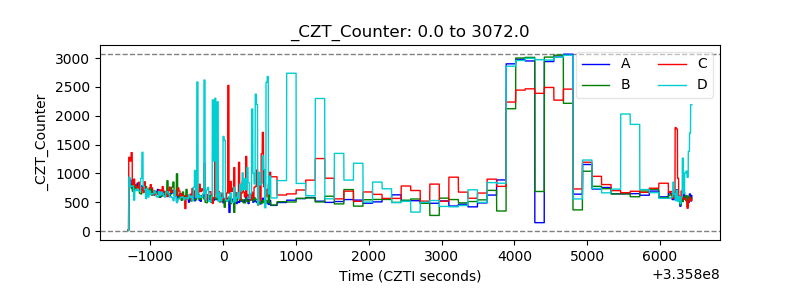 |
| +2.5 Volts monitor |  |
| +5 Volts monitor | 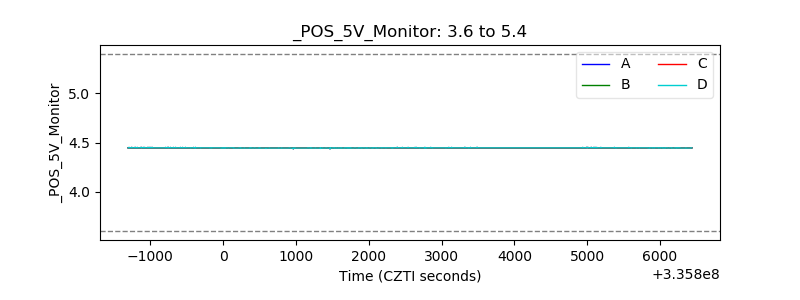 |
| _ROLL_ROT | 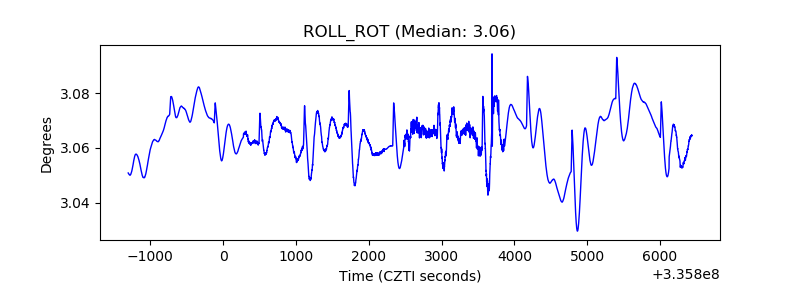 |
| _Roll_DEC | 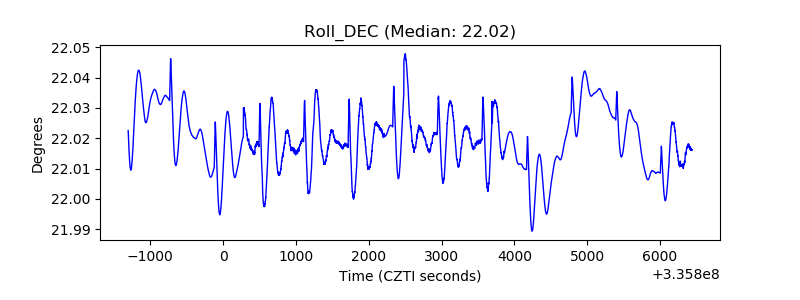 |
| _Roll_RA | 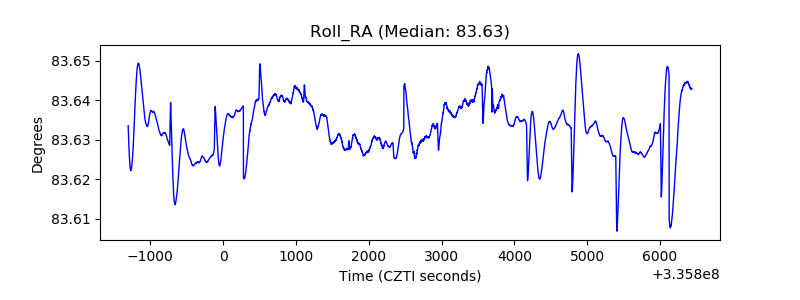 |
| Veto Counter | 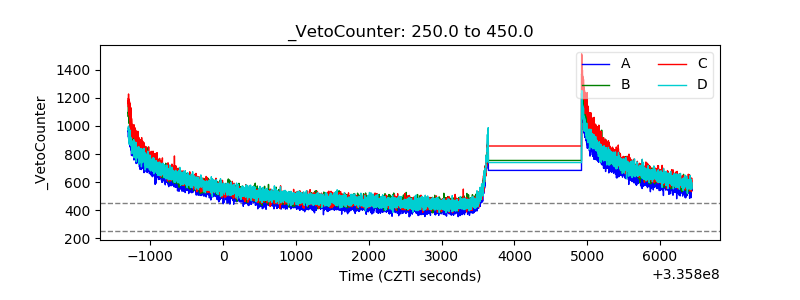 |