| Param | Original file | Final file |
|---|---|---|
| Filename | modeM0/AS1C05_017T01_9000003836_26504cztM0_level2.evt | modeM0/AS1C05_017T01_9000003836_26504cztM0_level2_quad_clean.evt |
| Size (bytes) | 534,456,000 | 79,133,760 |
| Size | 509.7 MB | 75.5 MB |
| Events in quadrant A | 3,650,561 | 498,619 |
| Events in quadrant B | 3,816,728 | 501,237 |
| Events in quadrant C | 4,048,417 | 482,285 |
| Events in quadrant D | 4,247,598 | 478,498 |
| Mode M9 | |||
|---|---|---|---|
| Quadrant | BADHDUFLAG | Total packets | Discarded packets |
| A | 0 | 18 | 0 |
| B | 0 | 19 | 0 |
| C | 0 | 19 | 0 |
| D | 0 | 19 | 0 |
| Mode M0 | |||
|---|---|---|---|
| Quadrant | BADHDUFLAG | Total packets | Discarded packets |
| A | 0 | 14829 | 0 |
| B | 0 | 15399 | 0 |
| C | 0 | 16297 | 0 |
| D | 0 | 16818 | 0 |
| Quadrant | Total seconds | Saturated seconds | Saturation percentage |
|---|---|---|---|
| A | 6244 | 99 | 1.585522% |
| B | 6244 | 117 | 1.873799% |
| C | 6243 | 193 | 3.091462% |
| D | 6243 | 159 | 2.546852% |
Noise dominated data is calculated using 1-second bins in cleaned event files. If a bin has >2000 counts, and if more than 50% of those come from <1% of pixels, then it is considered to be noise-dominated and hence unusable.
| Quadrant | # 1 sec bins | Bins with >0 counts | Bins with >2000 counts | High rate bins dominated by noise | Noise dominated (total time) | Noise dominated (detector-on time) | Marked lightcurve |
|---|---|---|---|---|---|---|---|
| A | 7629 | 6244 | 1 | 1 | 0.01% | 0.02% | 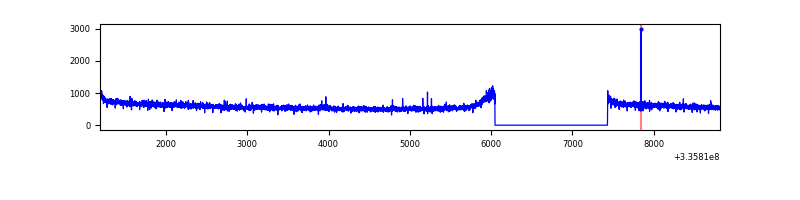 |
| B | 7629 | 6244 | 12 | 12 | 0.16% | 0.19% | 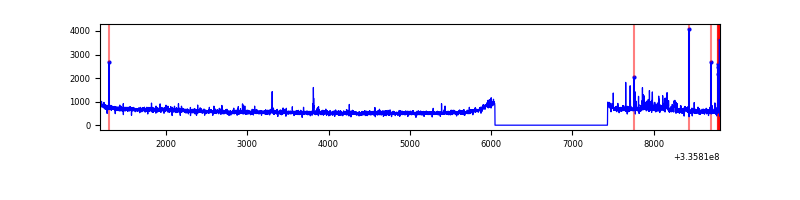 |
| C | 7628 | 6243 | 8 | 8 | 0.10% | 0.13% | 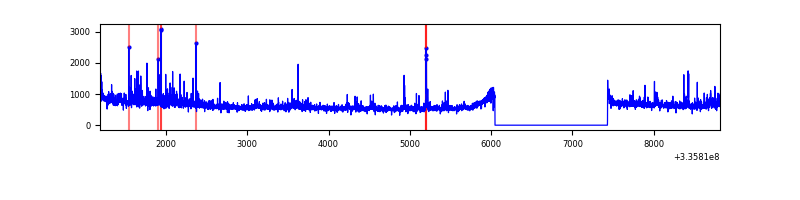 |
| D | 7628 | 6243 | 55 | 55 | 0.72% | 0.88% | 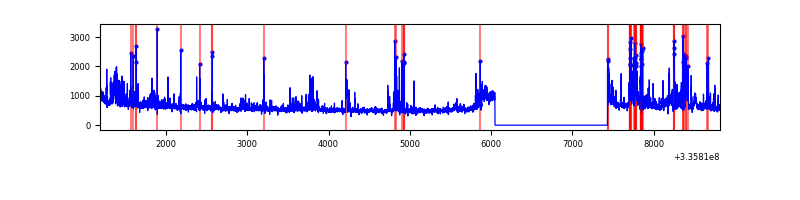 |
Top three noisy pixels from each quadrant. If the there are fewer than three noisy pixels in the level2.evt file, extra rows are filled as -1
| Pixel properties | Quadrant properties | ||||||
|---|---|---|---|---|---|---|---|
| Quadrant | DetID | PixID | Counts | Sigma | Mean | Median | Sigma |
| A | 6 | 16 | 33780 | 177.72 | 938 | 926 | 184.9 |
| A | 13 | 254 | 10737 | 53.07 | 938 | 926 | 184.9 |
| A | 0 | 226 | 8220 | 39.46 | 938 | 926 | 184.9 |
| B | 0 | 190 | 94297 | 547.09 | 926 | 909 | 170.7 |
| B | 5 | 172 | 55551 | 320.11 | 926 | 909 | 170.7 |
| B | 3 | 112 | 20423 | 114.32 | 926 | 909 | 170.7 |
| C | 3 | 233 | 344268 | 1661.53 | 902 | 914 | 206.6 |
| C | 14 | 238 | 147293 | 708.35 | 902 | 914 | 206.6 |
| C | 2 | 16 | 33884 | 159.55 | 902 | 914 | 206.6 |
| D | 1 | 52 | 523183 | 2411.15 | 916 | 899 | 216.6 |
| D | 12 | 233 | 181170 | 832.23 | 916 | 899 | 216.6 |
| D | 2 | 234 | 25789 | 114.91 | 916 | 899 | 216.6 |
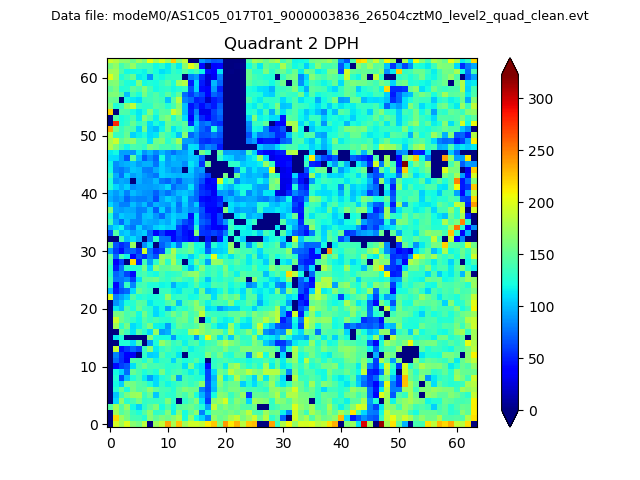
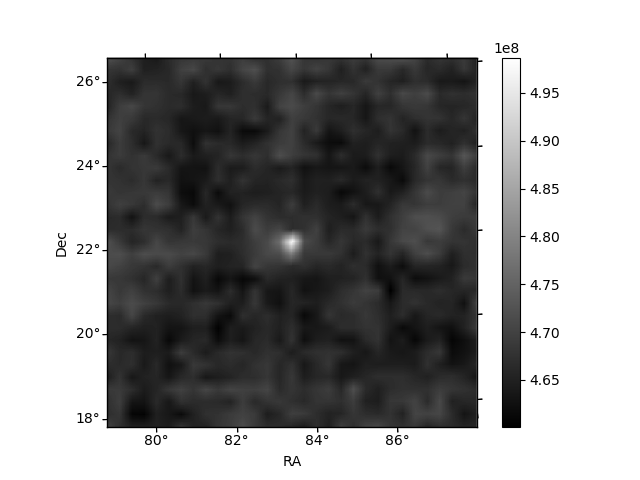
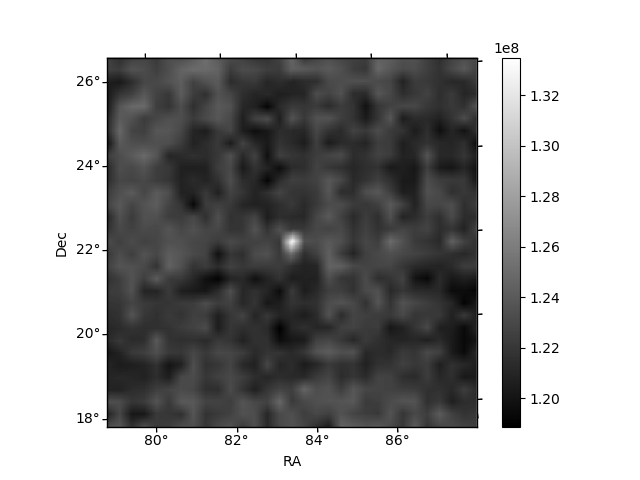
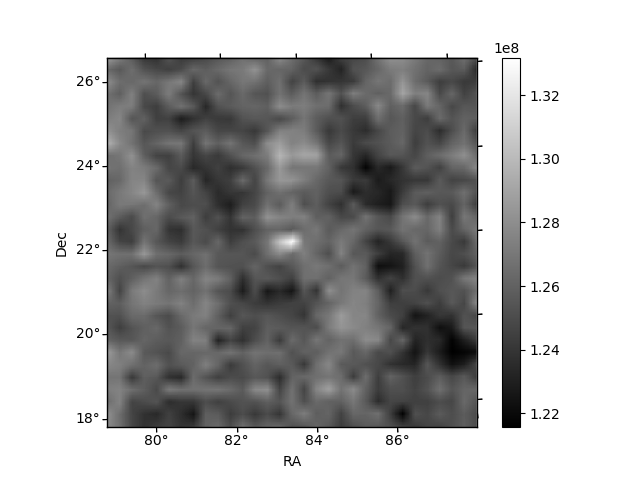
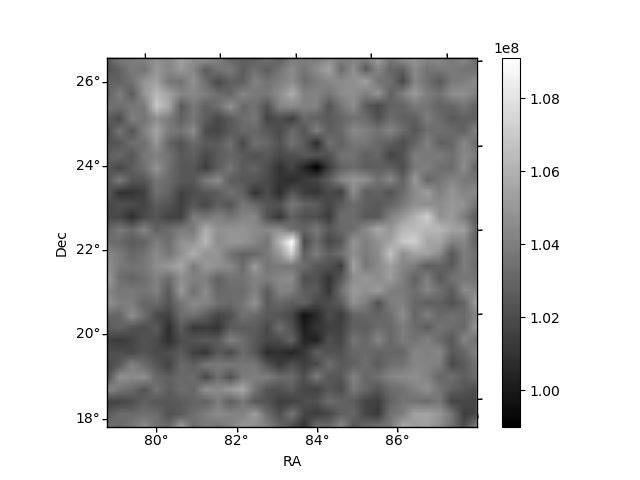
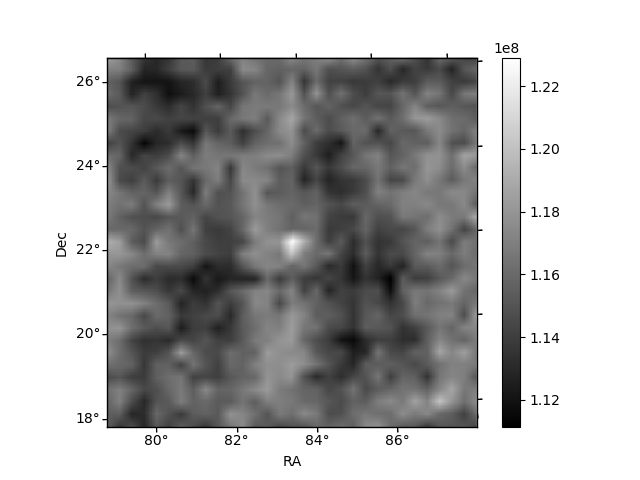
Histogram calculated using DETX and DETY for each event in the final _common_clean file
| Quadrant A | 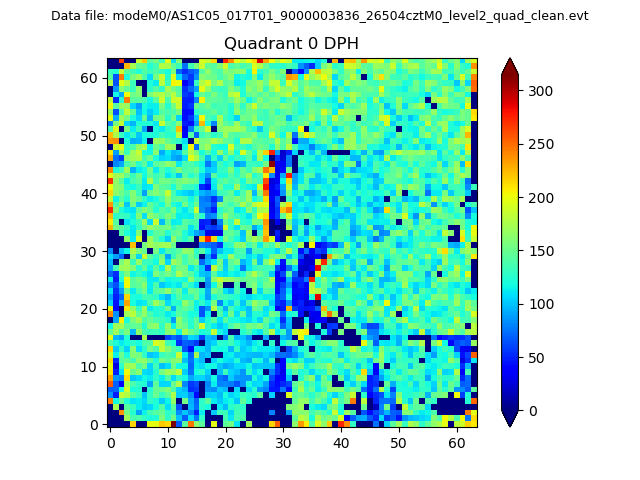 |
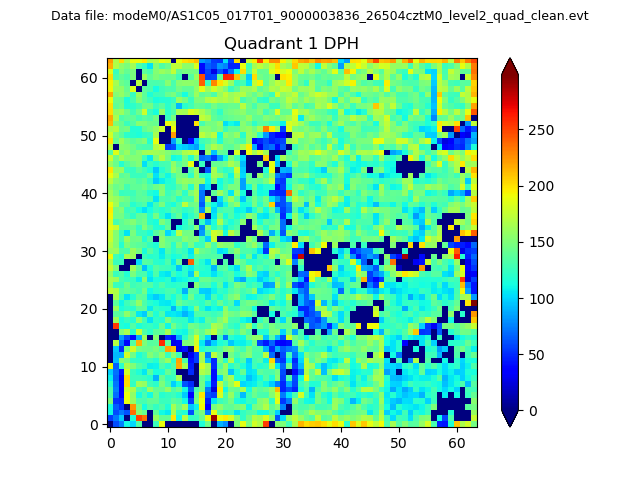 |
Quadrant B |
|---|---|---|---|
| Quadrant D | 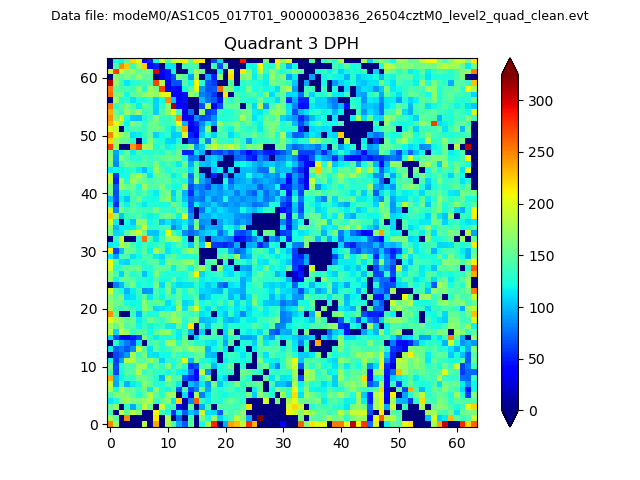 |
 |
Quadrant C |
| Plot type | Count rate plots | Images |
|---|---|---|
| Comparison with Poisson distribution Blue bars denote a histogram of data divided into 1 sec bins. Red curve is a Poisson curve with rate = median count rate of data. |
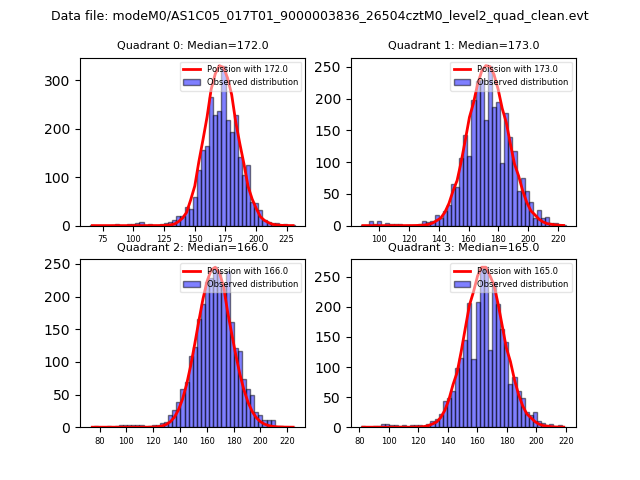 |
 |
| Quadrant-wise count rates Data is divided into 100 sec bins |
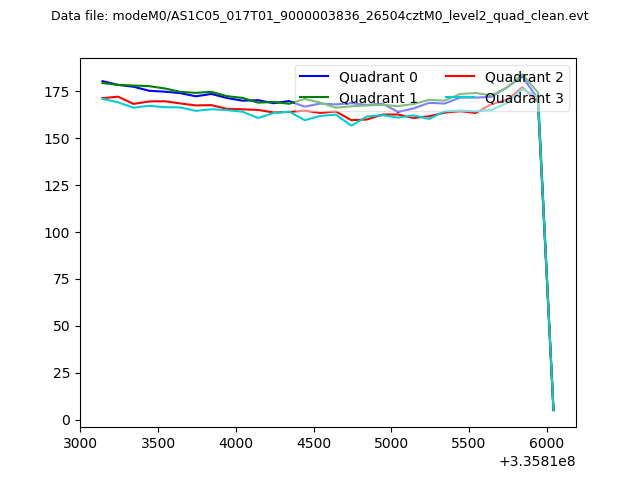 |
|
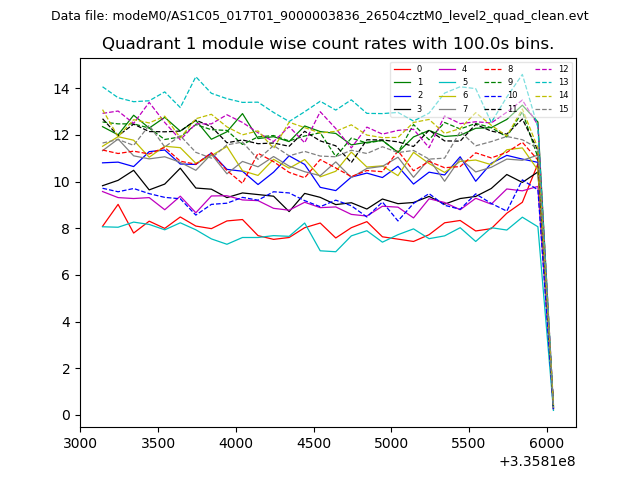
| Module-wise count rates for Quadrant A Data is divided into 100 sec bins |
 |
 |
| Module-wise count rates for Quadrant B Data is divided into 100 sec bins |
 |
 |
| Module-wise count rates for Quadrant C Data is divided into 100 sec bins |
 |
 |
| Module-wise count rates for Quadrant D Data is divided into 100 sec bins |
 |
 |
| Parameter | Plot |
|---|---|
| CZT HV Monitor | 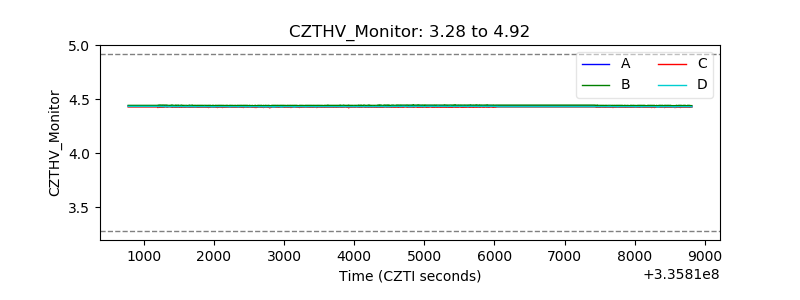 |
| D_VDD | 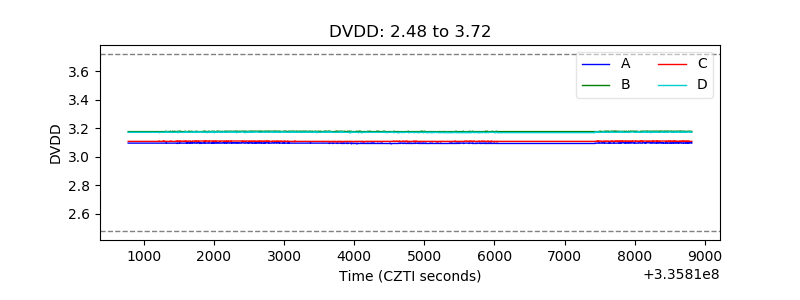 |
| Temperature 1 | 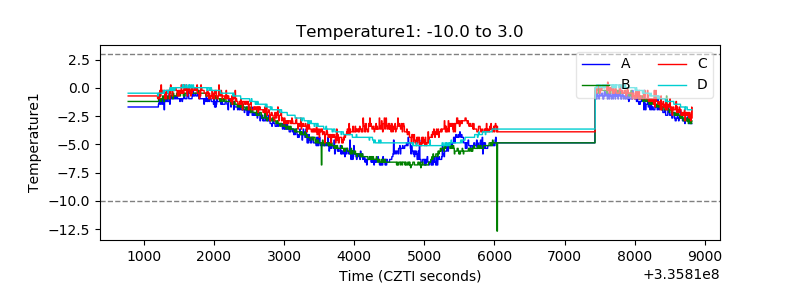 |
| Veto HV Monitor | 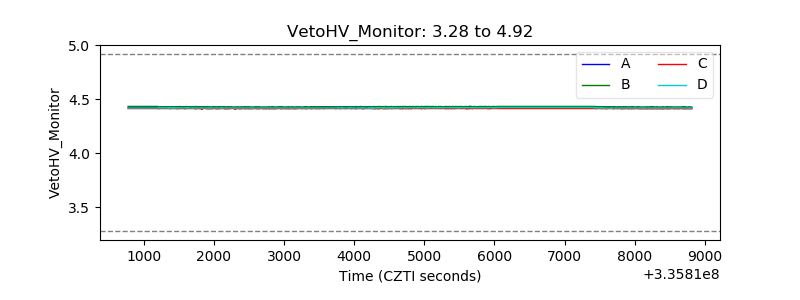 |
| Veto LLD | 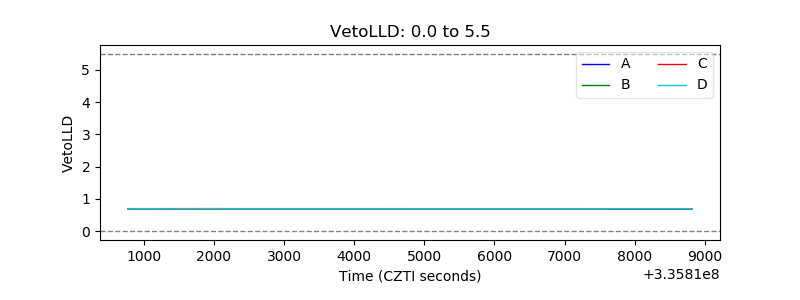 |
| Alpha Counter | 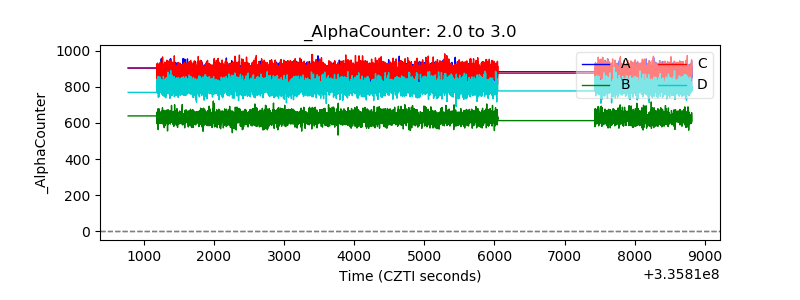 |
| _CPM_Rate | 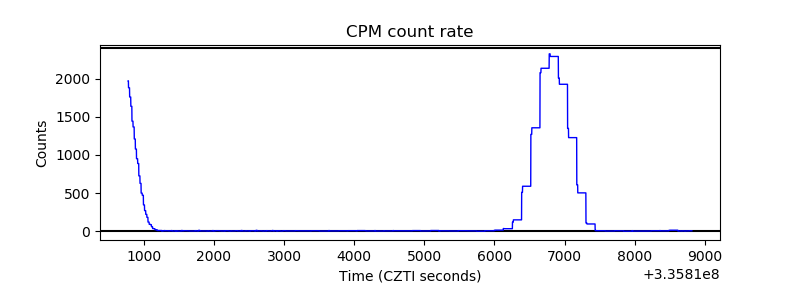 |
| CZT Counter | 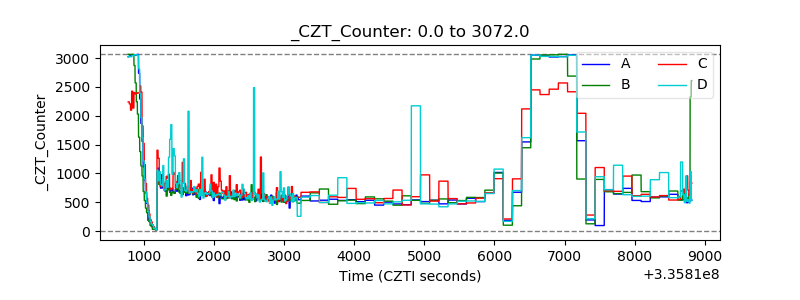 |
| +2.5 Volts monitor |  |
| +5 Volts monitor |  |
| _ROLL_ROT | 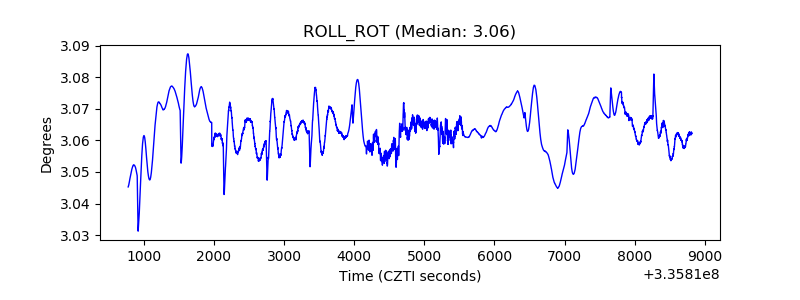 |
| _Roll_DEC | 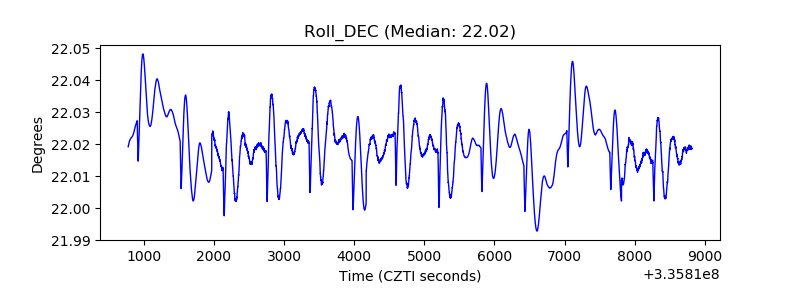 |
| _Roll_RA | 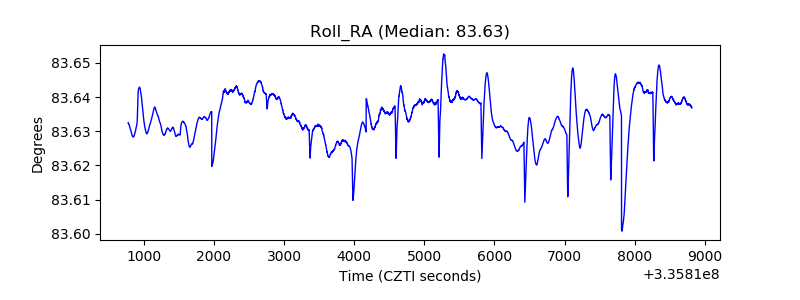 |
| Veto Counter | 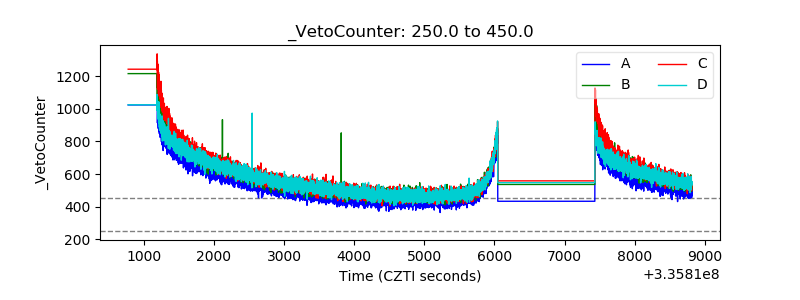 |