| Param | Original file | Final file |
|---|---|---|
| Filename | modeM0/AS1C05_017T01_9000003836_26505cztM0_level2.evt | modeM0/AS1C05_017T01_9000003836_26505cztM0_level2_quad_clean.evt |
| Size (bytes) | 551,208,960 | 91,609,920 |
| Size | 525.7 MB | 87.4 MB |
| Events in quadrant A | 3,294,882 | 601,497 |
| Events in quadrant B | 3,723,441 | 606,357 |
| Events in quadrant C | 3,694,352 | 586,350 |
| Events in quadrant D | 5,571,679 | 558,066 |
| Mode M9 | |||
|---|---|---|---|
| Quadrant | BADHDUFLAG | Total packets | Discarded packets |
| A | 0 | 13 | 0 |
| B | 0 | 13 | 0 |
| C | 0 | 13 | 0 |
| D | 0 | 13 | 0 |
| Mode M0 | |||
|---|---|---|---|
| Quadrant | BADHDUFLAG | Total packets | Discarded packets |
| A | 0 | 13394 | 0 |
| B | 0 | 14946 | 0 |
| C | 0 | 14990 | 0 |
| D | 0 | 20839 | 0 |
| Quadrant | Total seconds | Saturated seconds | Saturation percentage |
|---|---|---|---|
| A | 6045 | 98 | 1.621175% |
| B | 6046 | 133 | 2.199802% |
| C | 6046 | 164 | 2.712537% |
| D | 6045 | 372 | 6.153846% |
Noise dominated data is calculated using 1-second bins in cleaned event files. If a bin has >2000 counts, and if more than 50% of those come from <1% of pixels, then it is considered to be noise-dominated and hence unusable.
| Quadrant | # 1 sec bins | Bins with >0 counts | Bins with >2000 counts | High rate bins dominated by noise | Noise dominated (total time) | Noise dominated (detector-on time) | Marked lightcurve |
|---|---|---|---|---|---|---|---|
| A | 7300 | 6046 | 1 | 1 | 0.01% | 0.02% | 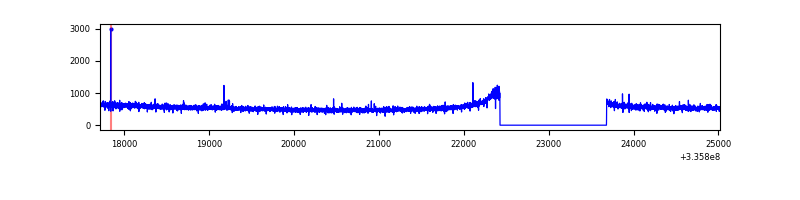 |
| B | 7301 | 6046 | 20 | 20 | 0.27% | 0.33% | 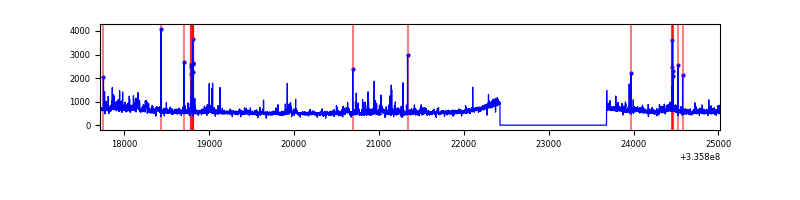 |
| C | 7301 | 6046 | 0 | 0 | 0.00% | 0.00% | 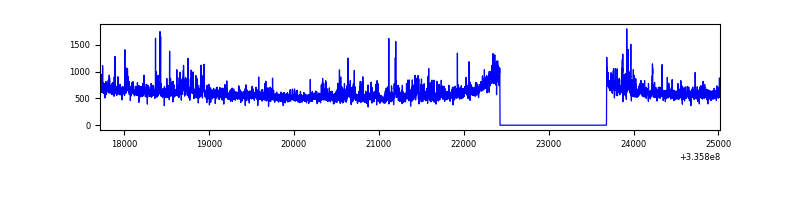 |
| D | 7300 | 6045 | 308 | 308 | 4.22% | 5.10% | 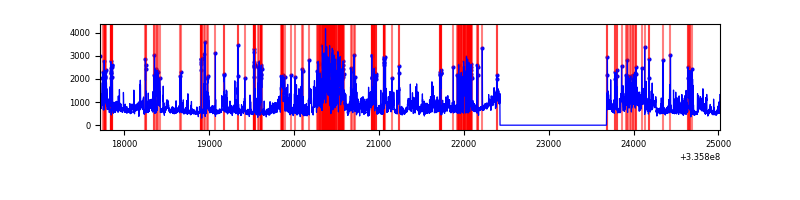 |
Top three noisy pixels from each quadrant. If the there are fewer than three noisy pixels in the level2.evt file, extra rows are filled as -1
| Pixel properties | Quadrant properties | ||||||
|---|---|---|---|---|---|---|---|
| Quadrant | DetID | PixID | Counts | Sigma | Mean | Median | Sigma |
| A | 13 | 254 | 10345 | 56.39 | 852 | 841 | 168.5 |
| A | 6 | 16 | 8485 | 45.36 | 852 | 841 | 168.5 |
| A | 0 | 226 | 7306 | 38.36 | 852 | 841 | 168.5 |
| B | 0 | 189 | 173762 | 1088.19 | 848 | 833 | 158.9 |
| B | 5 | 172 | 92729 | 578.27 | 848 | 833 | 158.9 |
| B | 0 | 190 | 87998 | 548.5 | 848 | 833 | 158.9 |
| C | 3 | 233 | 300399 | 1567.14 | 826 | 836 | 191.2 |
| C | 14 | 238 | 135089 | 702.33 | 826 | 836 | 191.2 |
| C | 4 | 254 | 20494 | 102.84 | 826 | 836 | 191.2 |
| D | 1 | 52 | 1338294 | 6788.19 | 824 | 808 | 197.0 |
| D | 12 | 233 | 713144 | 3615.34 | 824 | 808 | 197.0 |
| D | 14 | 35 | 332677 | 1684.35 | 824 | 808 | 197.0 |
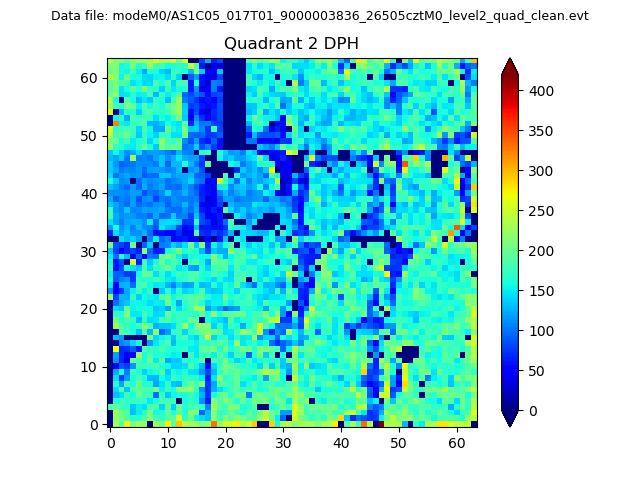
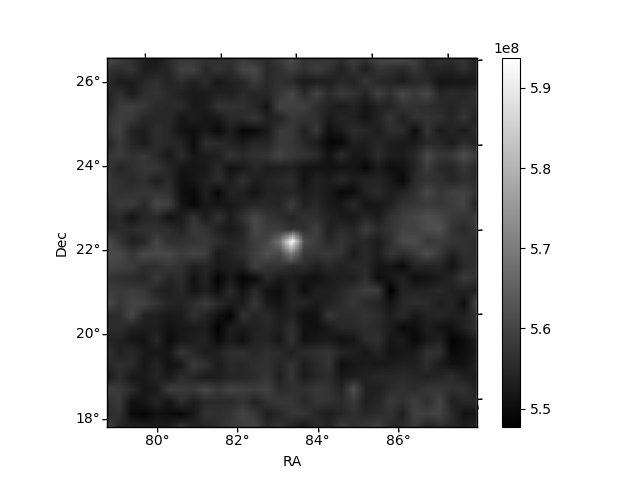
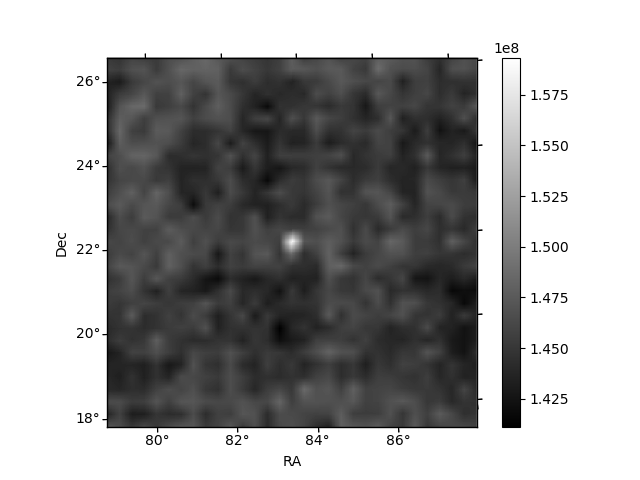
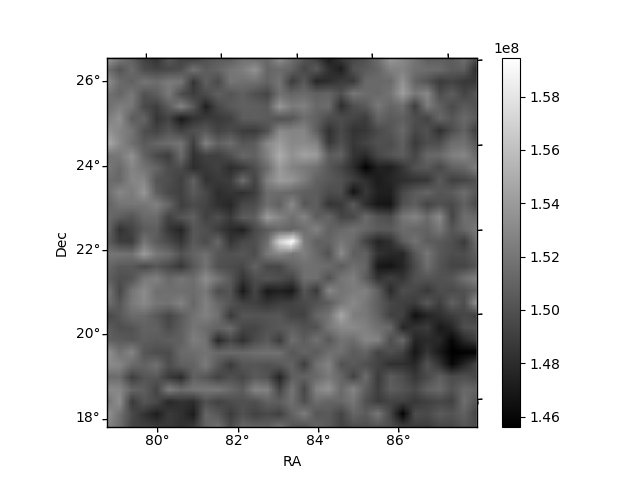
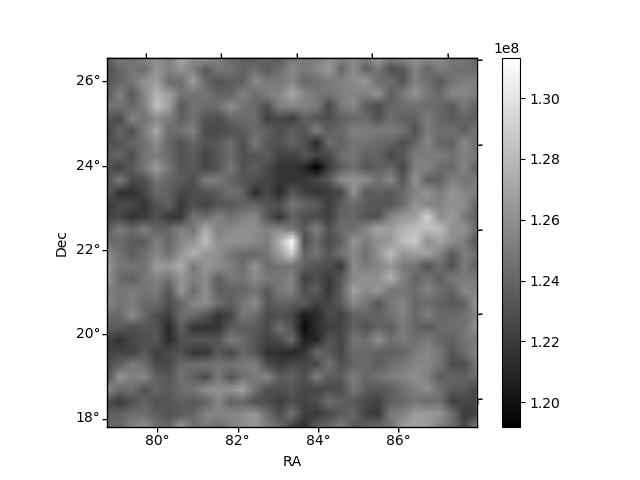
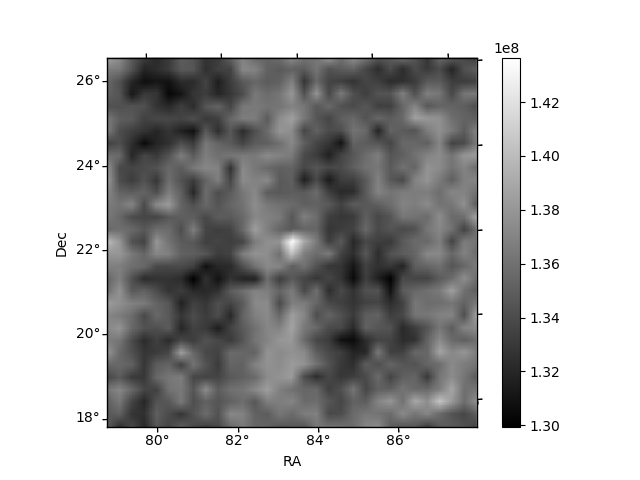
Histogram calculated using DETX and DETY for each event in the final _common_clean file
| Quadrant A | 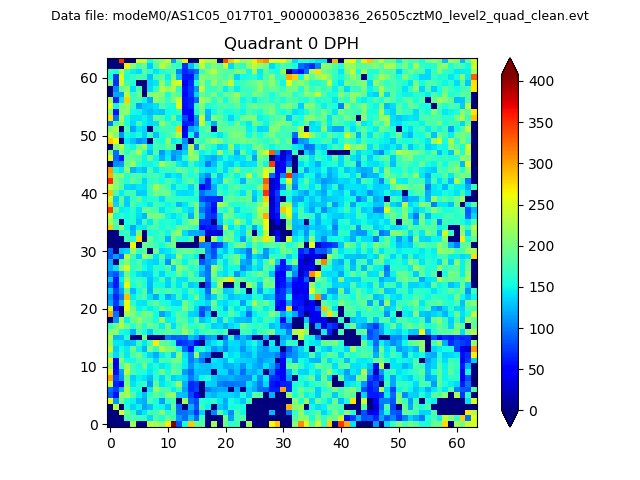 |
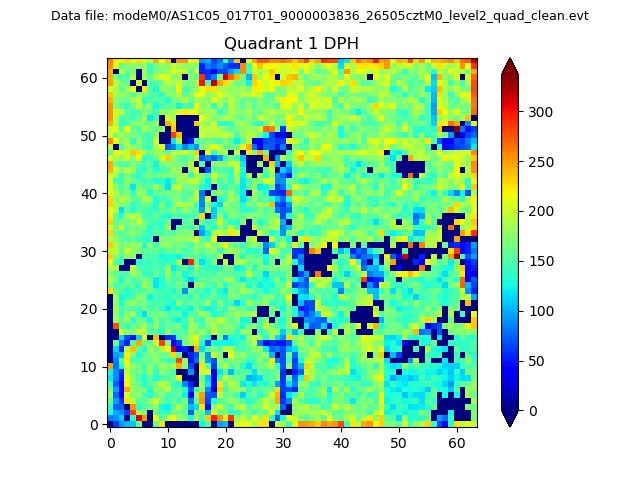 |
Quadrant B |
|---|---|---|---|
| Quadrant D | 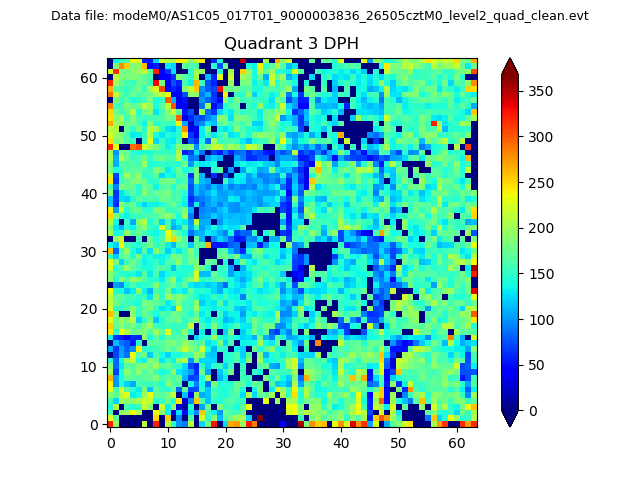 |
 |
Quadrant C |
| Plot type | Count rate plots | Images |
|---|---|---|
| Comparison with Poisson distribution Blue bars denote a histogram of data divided into 1 sec bins. Red curve is a Poisson curve with rate = median count rate of data. |
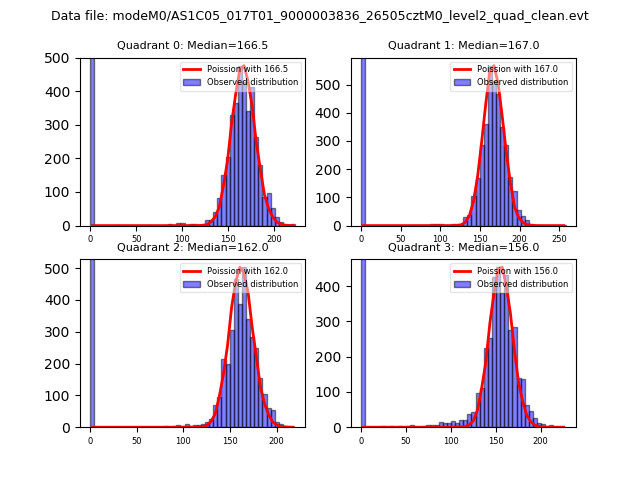 |
 |
| Quadrant-wise count rates Data is divided into 100 sec bins |
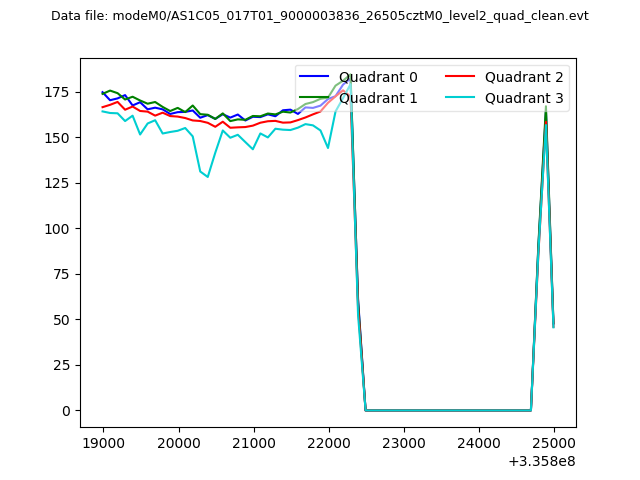 |
|
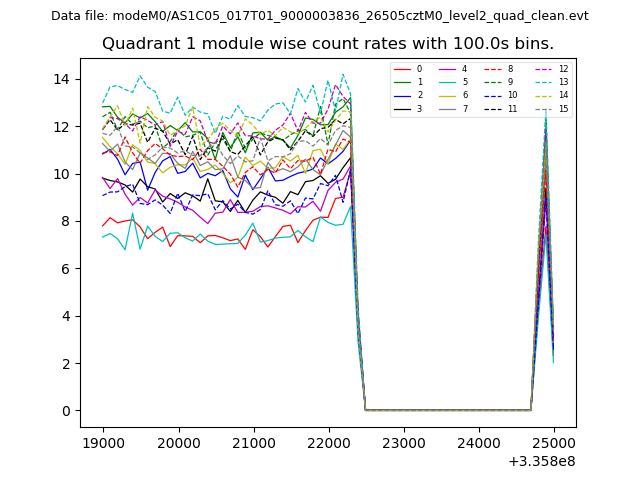
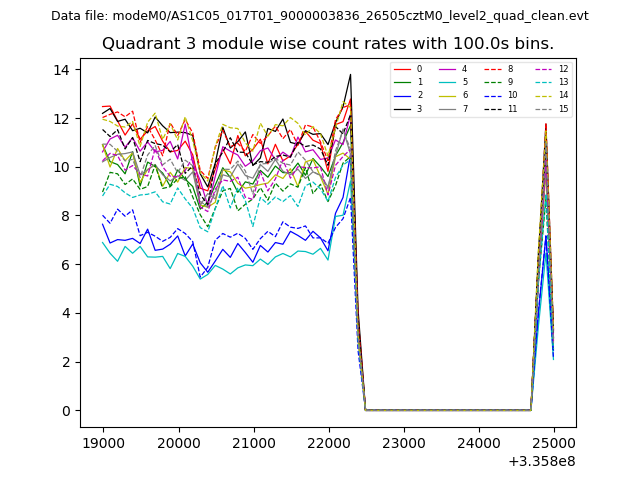
| Module-wise count rates for Quadrant A Data is divided into 100 sec bins |
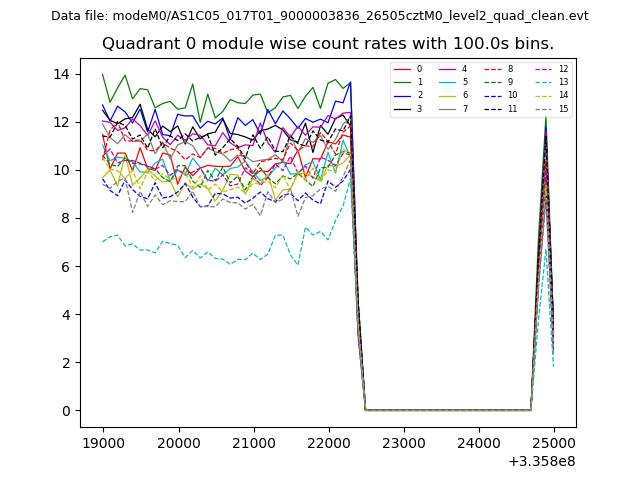 |
 |
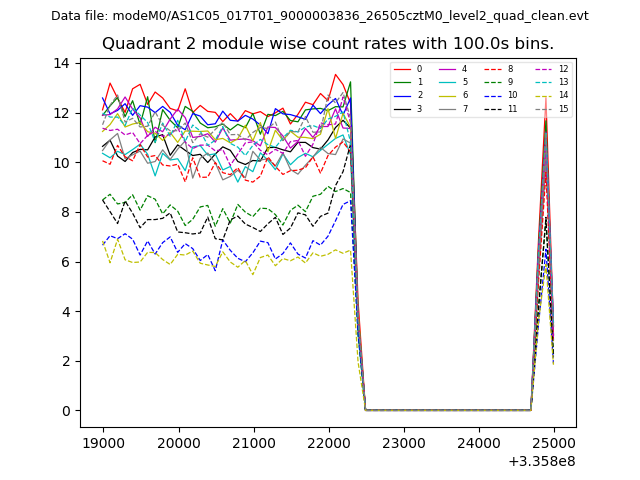
| Module-wise count rates for Quadrant B Data is divided into 100 sec bins |
 |
 |
| Module-wise count rates for Quadrant C Data is divided into 100 sec bins |
 |
 |
| Module-wise count rates for Quadrant D Data is divided into 100 sec bins |
 |
 |
| Parameter | Plot |
|---|---|
| CZT HV Monitor | 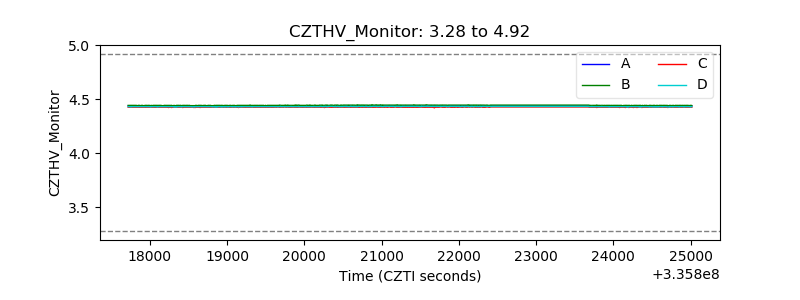 |
| D_VDD | 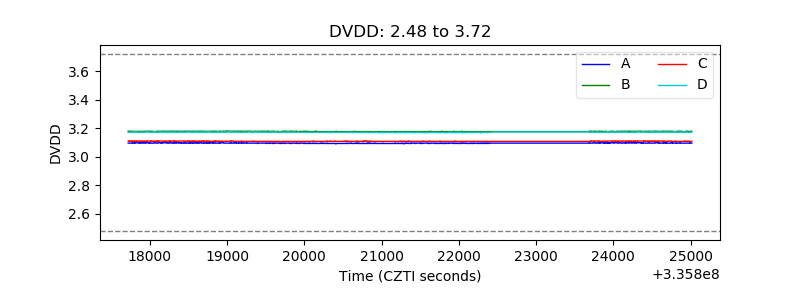 |
| Temperature 1 | 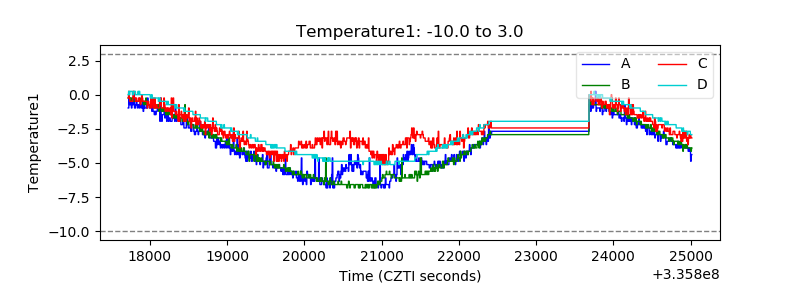 |
| Veto HV Monitor | 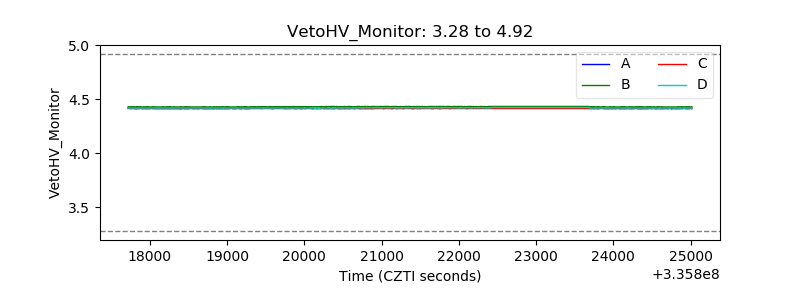 |
| Veto LLD | 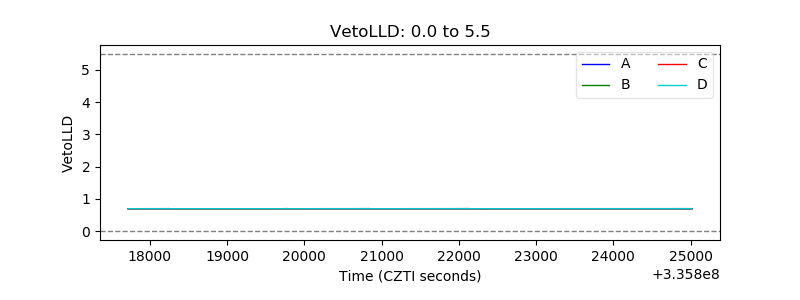 |
| Alpha Counter |  |
| _CPM_Rate |  |
| CZT Counter | 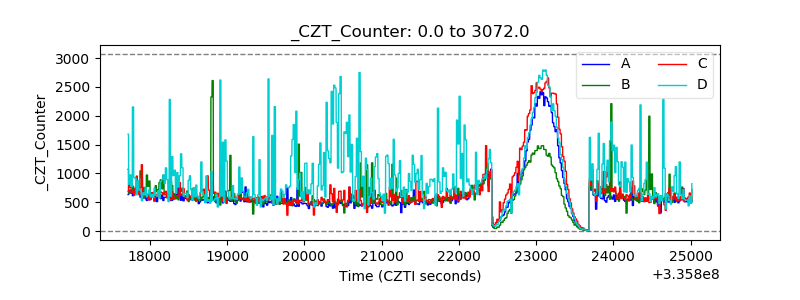 |
| +2.5 Volts monitor |  |
| +5 Volts monitor |  |
| _ROLL_ROT | 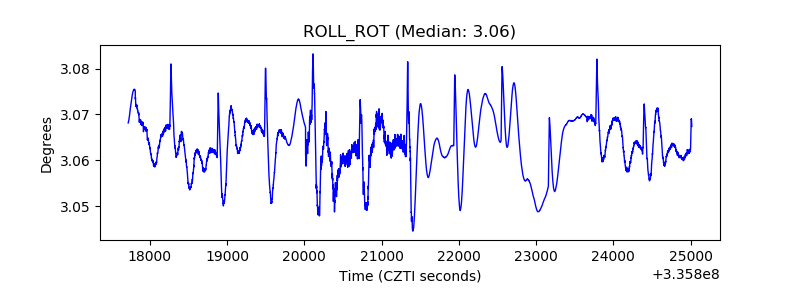 |
| _Roll_DEC | 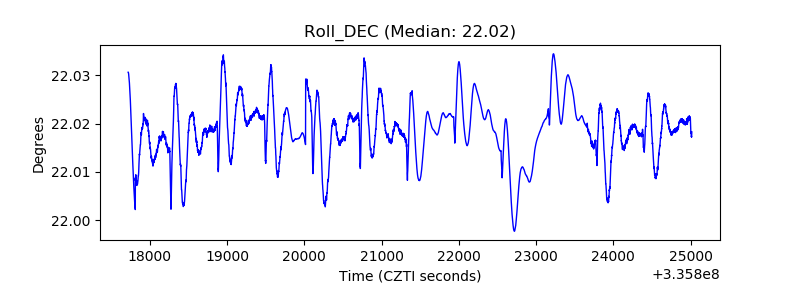 |
| _Roll_RA | 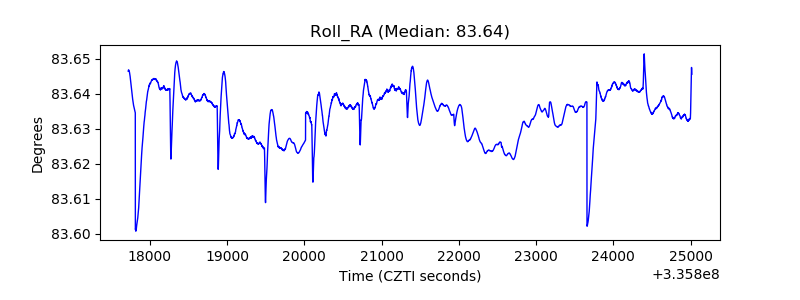 |
| Veto Counter | 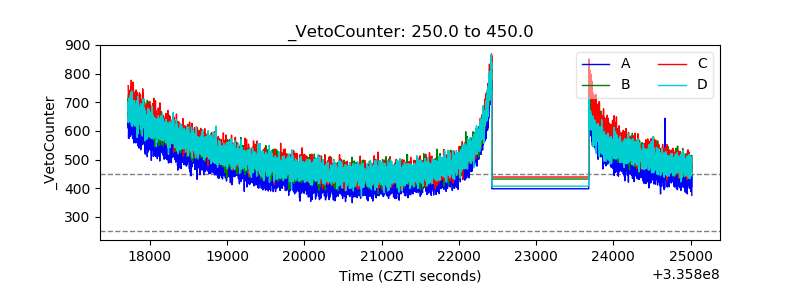 |