| Param | Original file | Final file |
|---|---|---|
| Filename | modeM0/AS1C05_017T01_9000003836_26506cztM0_level2.evt | modeM0/AS1C05_017T01_9000003836_26506cztM0_level2_quad_clean.evt |
| Size (bytes) | 573,517,440 | 101,301,120 |
| Size | 546.9 MB | 96.6 MB |
| Events in quadrant A | 3,488,664 | 661,524 |
| Events in quadrant B | 3,961,962 | 668,198 |
| Events in quadrant C | 3,814,257 | 645,457 |
| Events in quadrant D | 5,649,227 | 624,750 |
| Mode M9 | |||
|---|---|---|---|
| Quadrant | BADHDUFLAG | Total packets | Discarded packets |
| A | 0 | 22 | 0 |
| B | 0 | 22 | 0 |
| C | 0 | 22 | 0 |
| D | 0 | 22 | 0 |
| Mode M0 | |||
|---|---|---|---|
| Quadrant | BADHDUFLAG | Total packets | Discarded packets |
| A | 0 | 14283 | 0 |
| B | 0 | 15987 | 0 |
| C | 0 | 15404 | 0 |
| D | 0 | 21279 | 0 |
| Quadrant | Total seconds | Saturated seconds | Saturation percentage |
|---|---|---|---|
| A | 6722 | 114 | 1.695924% |
| B | 6722 | 221 | 3.287712% |
| C | 6722 | 175 | 2.603392% |
| D | 6722 | 646 | 9.610235% |
Noise dominated data is calculated using 1-second bins in cleaned event files. If a bin has >2000 counts, and if more than 50% of those come from <1% of pixels, then it is considered to be noise-dominated and hence unusable.
| Quadrant | # 1 sec bins | Bins with >0 counts | Bins with >2000 counts | High rate bins dominated by noise | Noise dominated (total time) | Noise dominated (detector-on time) | Marked lightcurve |
|---|---|---|---|---|---|---|---|
| A | 8872 | 6724 | 0 | 0 | 0.00% | 0.00% | 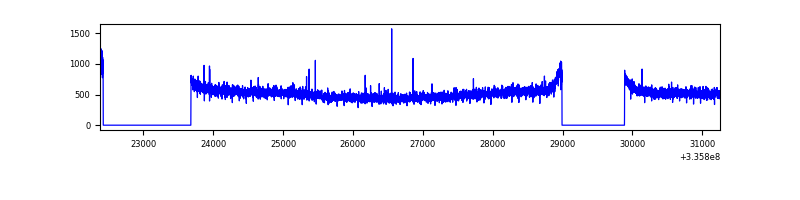 |
| B | 8872 | 6722 | 51 | 51 | 0.57% | 0.76% | 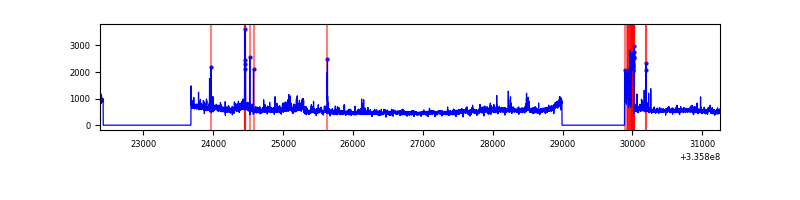 |
| C | 8872 | 6722 | 7 | 7 | 0.08% | 0.10% | 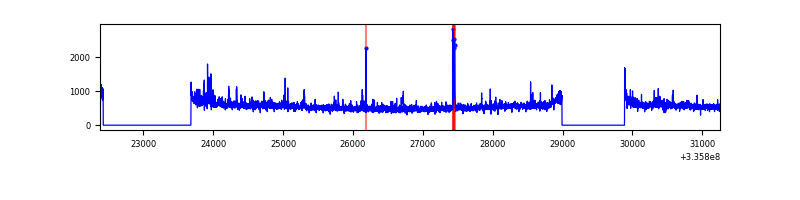 |
| D | 8872 | 6722 | 440 | 440 | 4.96% | 6.55% | 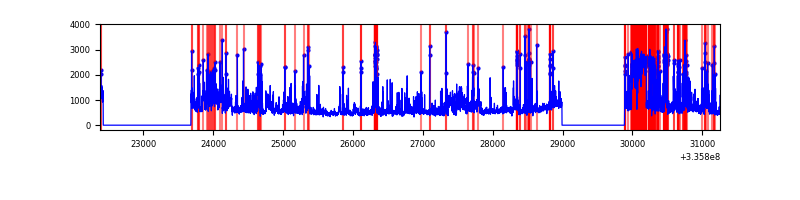 |
Top three noisy pixels from each quadrant. If the there are fewer than three noisy pixels in the level2.evt file, extra rows are filled as -1
| Pixel properties | Quadrant properties | ||||||
|---|---|---|---|---|---|---|---|
| Quadrant | DetID | PixID | Counts | Sigma | Mean | Median | Sigma |
| A | 13 | 254 | 11908 | 60.59 | 904 | 888 | 181.9 |
| A | 3 | 137 | 7857 | 38.32 | 904 | 888 | 181.9 |
| A | 0 | 226 | 7594 | 36.87 | 904 | 888 | 181.9 |
| B | 5 | 172 | 204917 | 1209.51 | 894 | 874 | 168.7 |
| B | 0 | 189 | 199993 | 1180.32 | 894 | 874 | 168.7 |
| B | 0 | 190 | 20989 | 119.24 | 894 | 874 | 168.7 |
| C | 3 | 233 | 208147 | 1016.98 | 873 | 881 | 203.8 |
| C | 14 | 238 | 139867 | 681.95 | 873 | 881 | 203.8 |
| C | 2 | 16 | 40412 | 193.96 | 873 | 881 | 203.8 |
| D | 1 | 52 | 2199309 | 10782.66 | 850 | 834 | 203.9 |
| D | 12 | 233 | 159922 | 780.26 | 850 | 834 | 203.9 |
| D | 14 | 35 | 39607 | 190.17 | 850 | 834 | 203.9 |
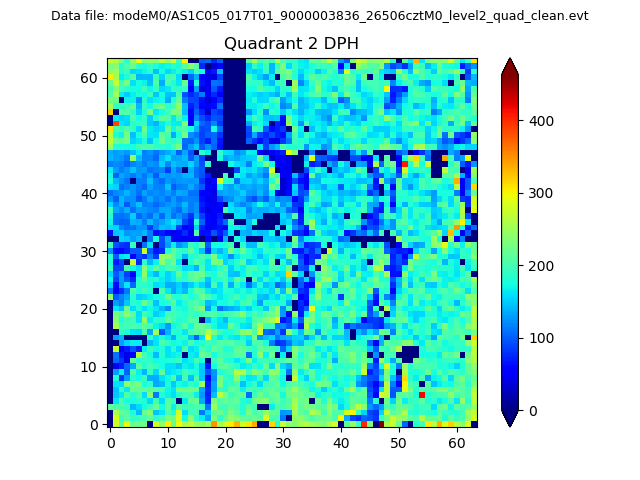
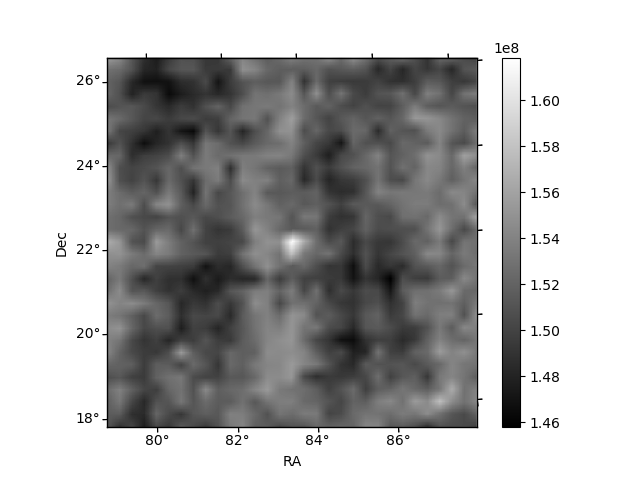
Histogram calculated using DETX and DETY for each event in the final _common_clean file
| Quadrant A | 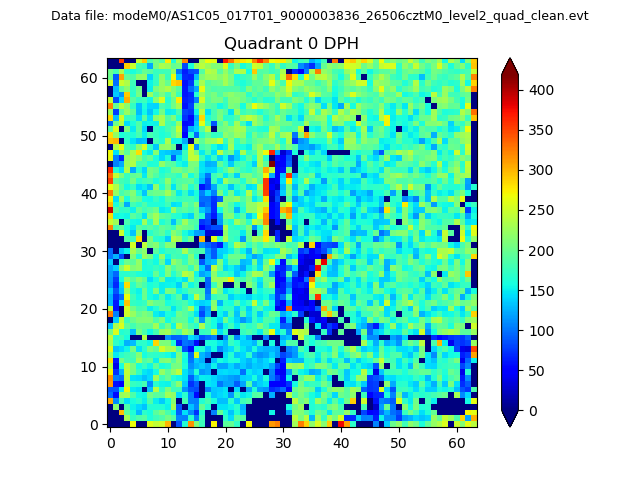 |
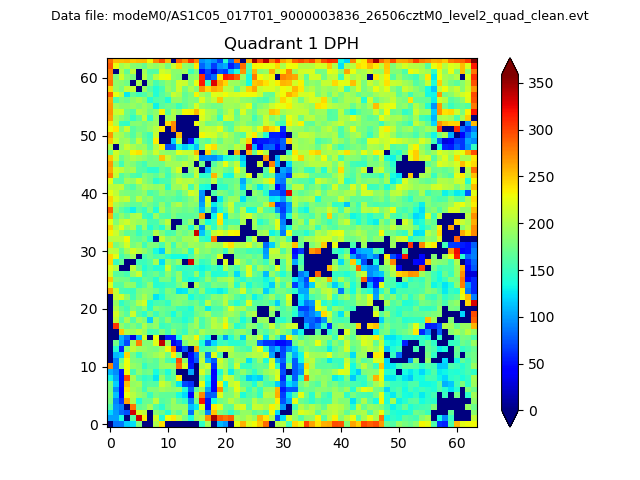 |
Quadrant B |
|---|---|---|---|
| Quadrant D | 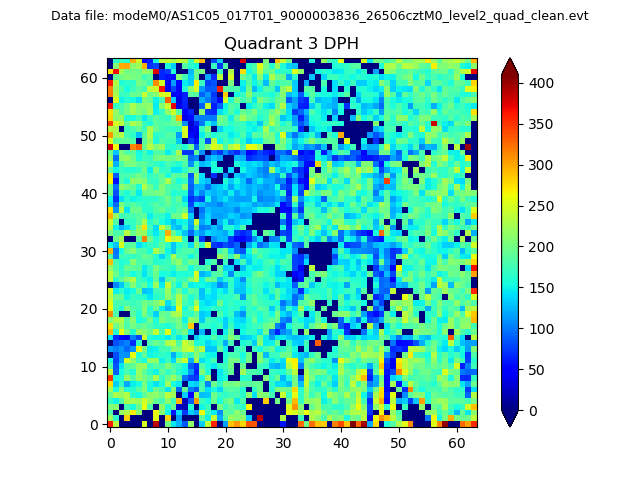 |
 |
Quadrant C |
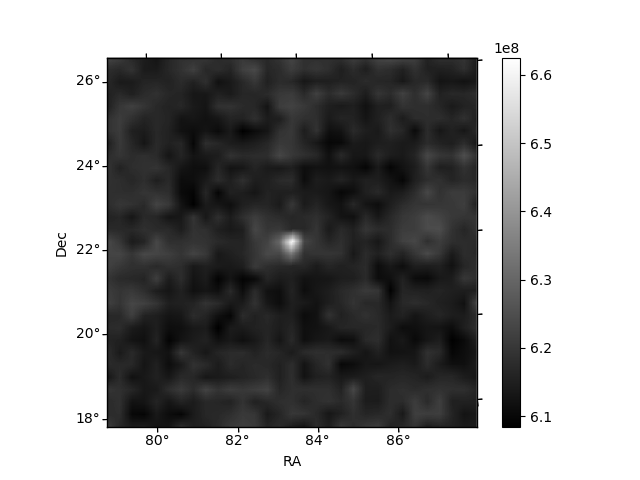
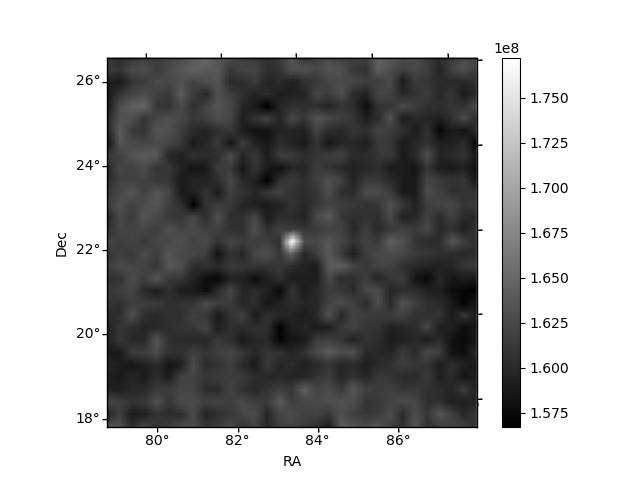
| Plot type | Count rate plots | Images |
|---|---|---|
| Comparison with Poisson distribution Blue bars denote a histogram of data divided into 1 sec bins. Red curve is a Poisson curve with rate = median count rate of data. |
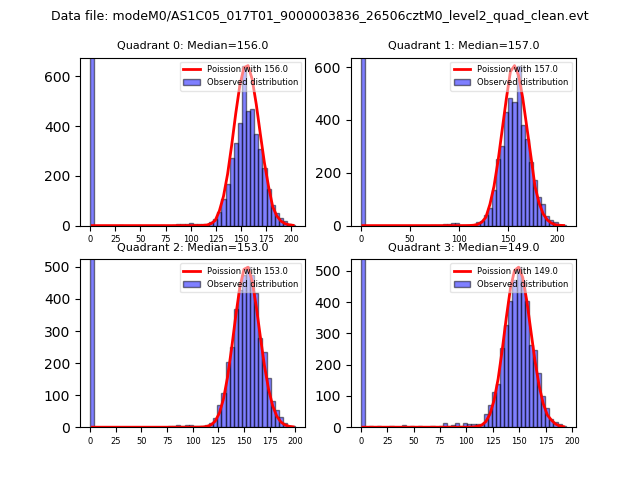 |
 |
| Quadrant-wise count rates Data is divided into 100 sec bins |
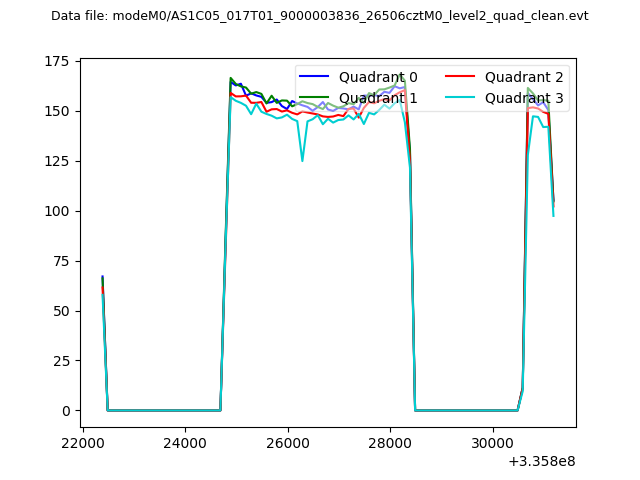 |
|
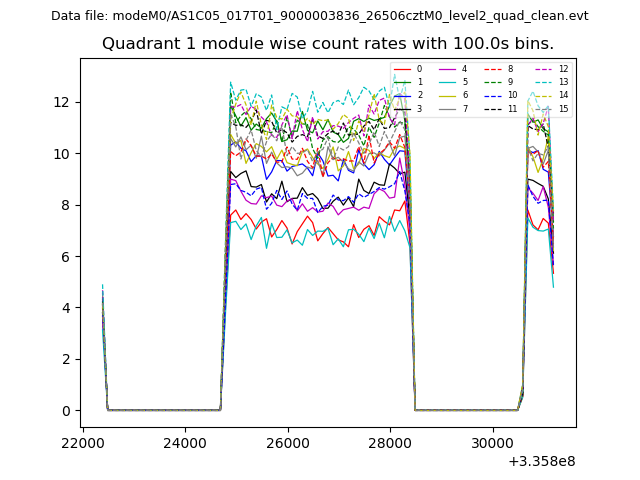
| Module-wise count rates for Quadrant A Data is divided into 100 sec bins |
 |
 |
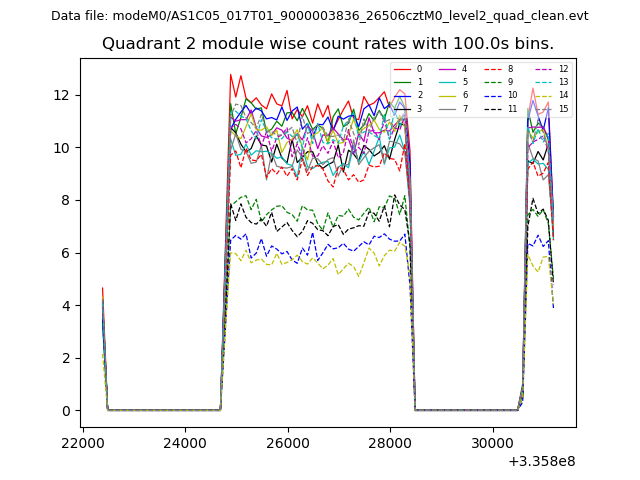
| Module-wise count rates for Quadrant B Data is divided into 100 sec bins |
 |
 |
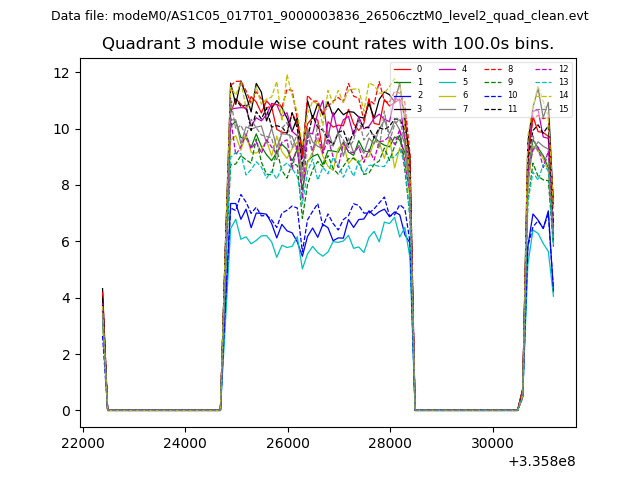
| Module-wise count rates for Quadrant C Data is divided into 100 sec bins |
 |
 |
| Module-wise count rates for Quadrant D Data is divided into 100 sec bins |
 |
 |
| Parameter | Plot |
|---|---|
| CZT HV Monitor | 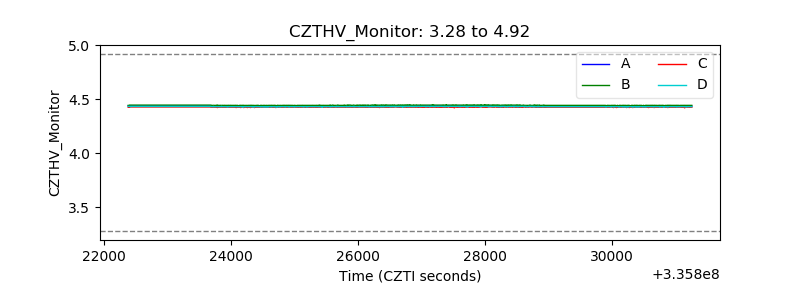 |
| D_VDD | 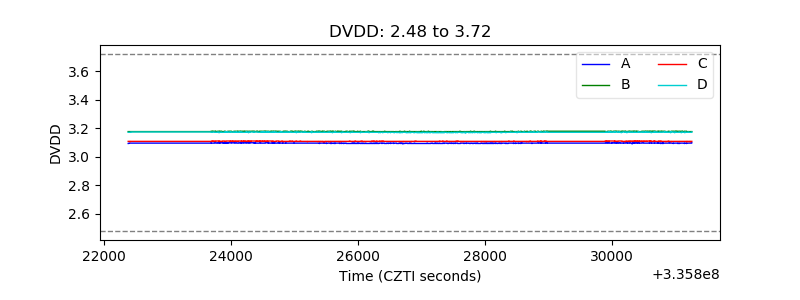 |
| Temperature 1 | 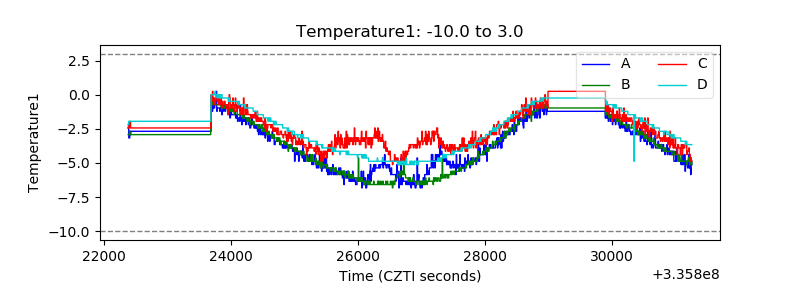 |
| Veto HV Monitor | 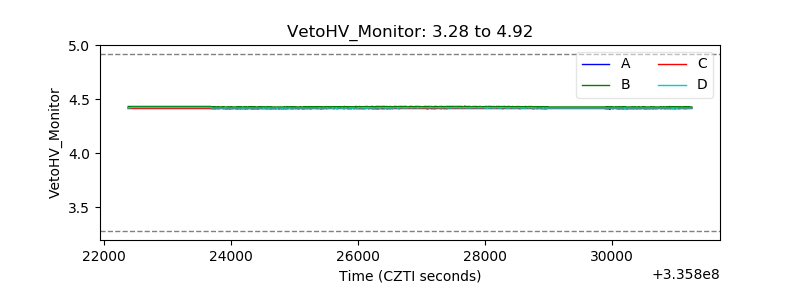 |
| Veto LLD | 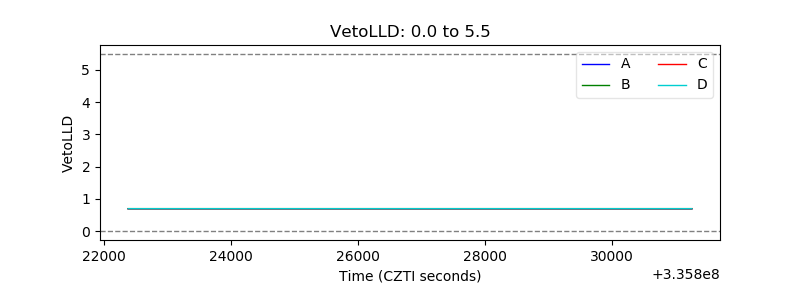 |
| Alpha Counter | 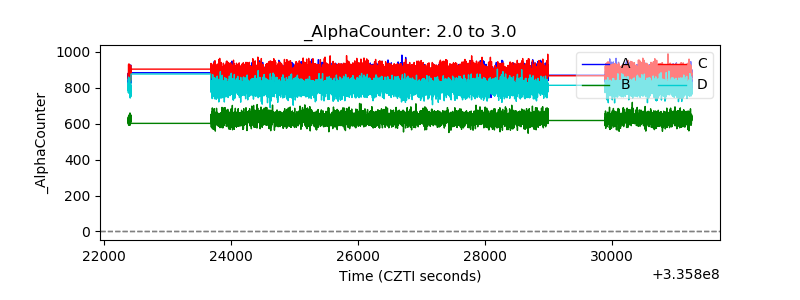 |
| _CPM_Rate | 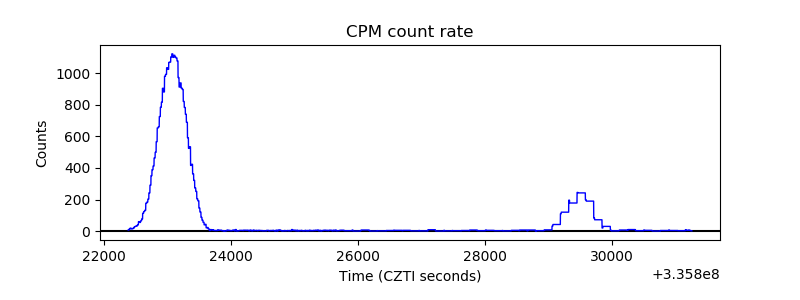 |
| CZT Counter | 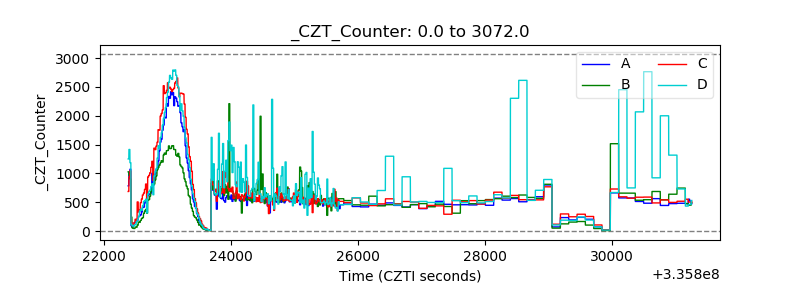 |
| +2.5 Volts monitor |  |
| +5 Volts monitor | 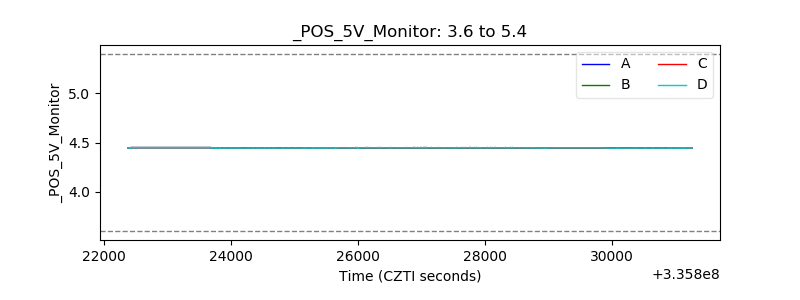 |
| _ROLL_ROT |  |
| _Roll_DEC | 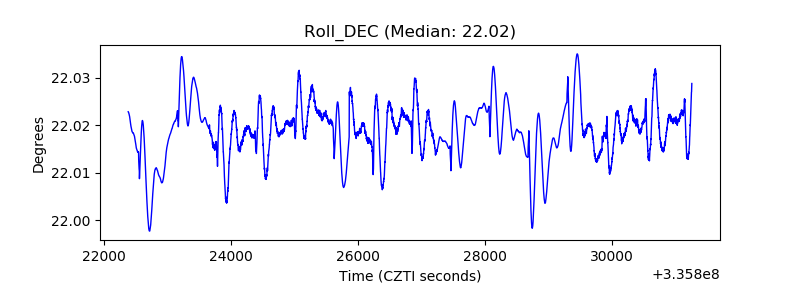 |
| _Roll_RA | 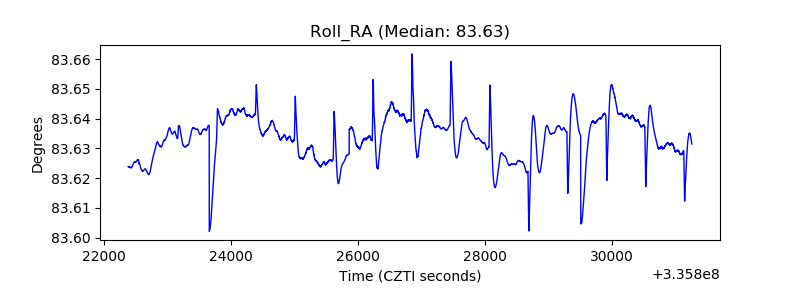 |
| Veto Counter | 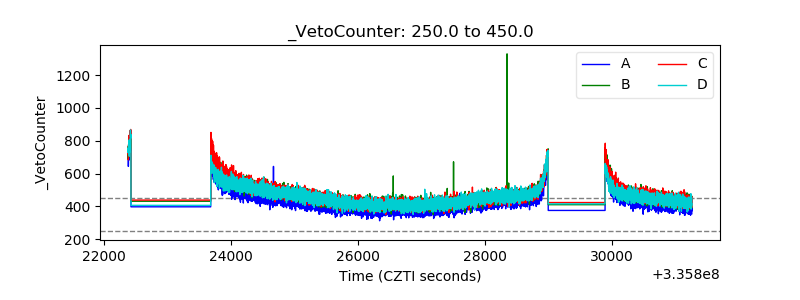 |