| Param | Original file | Final file |
|---|---|---|
| Filename | modeM0/AS1C05_017T01_9000003836_26507cztM0_level2.evt | modeM0/AS1C05_017T01_9000003836_26507cztM0_level2_quad_clean.evt |
| Size (bytes) | 651,055,680 | 108,204,480 |
| Size | 620.9 MB | 103.2 MB |
| Events in quadrant A | 3,775,437 | 706,371 |
| Events in quadrant B | 4,171,477 | 713,198 |
| Events in quadrant C | 4,015,113 | 687,927 |
| Events in quadrant D | 7,249,195 | 649,410 |
| Mode M9 | |||
|---|---|---|---|
| Quadrant | BADHDUFLAG | Total packets | Discarded packets |
| A | 0 | 14 | 0 |
| B | 0 | 14 | 0 |
| C | 0 | 14 | 0 |
| D | 0 | 14 | 0 |
| Mode M0 | |||
|---|---|---|---|
| Quadrant | BADHDUFLAG | Total packets | Discarded packets |
| A | 0 | 15697 | 0 |
| B | 0 | 17034 | 0 |
| C | 0 | 16405 | 0 |
| D | 0 | 26634 | 0 |
| Quadrant | Total seconds | Saturated seconds | Saturation percentage |
|---|---|---|---|
| A | 7476 | 90 | 1.203852% |
| B | 7477 | 218 | 2.915608% |
| C | 7477 | 181 | 2.420757% |
| D | 7477 | 1149 | 15.367126% |
Noise dominated data is calculated using 1-second bins in cleaned event files. If a bin has >2000 counts, and if more than 50% of those come from <1% of pixels, then it is considered to be noise-dominated and hence unusable.
| Quadrant | # 1 sec bins | Bins with >0 counts | Bins with >2000 counts | High rate bins dominated by noise | Noise dominated (total time) | Noise dominated (detector-on time) | Marked lightcurve |
|---|---|---|---|---|---|---|---|
| A | 8851 | 7478 | 0 | 0 | 0.00% | 0.00% | 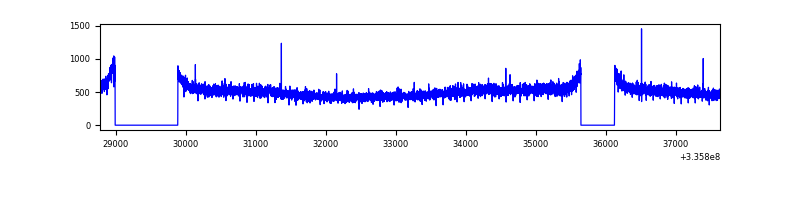 |
| B | 8852 | 7478 | 47 | 47 | 0.53% | 0.63% | 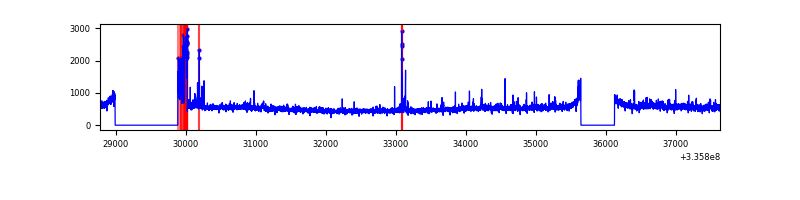 |
| C | 8852 | 7478 | 0 | 0 | 0.00% | 0.00% | 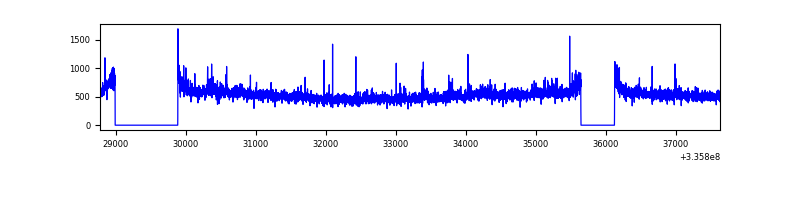 |
| D | 8852 | 7478 | 828 | 828 | 9.35% | 11.07% | 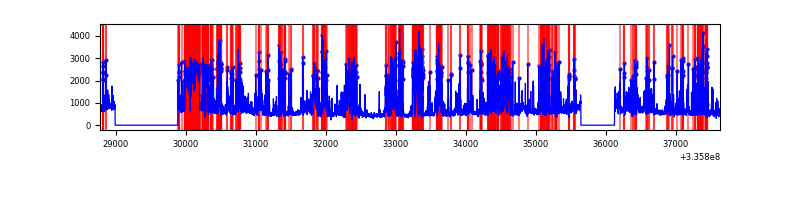 |
Top three noisy pixels from each quadrant. If the there are fewer than three noisy pixels in the level2.evt file, extra rows are filled as -1
| Pixel properties | Quadrant properties | ||||||
|---|---|---|---|---|---|---|---|
| Quadrant | DetID | PixID | Counts | Sigma | Mean | Median | Sigma |
| A | 13 | 254 | 13735 | 64.52 | 979 | 960 | 198.0 |
| A | 3 | 137 | 8642 | 38.8 | 979 | 960 | 198.0 |
| A | 0 | 226 | 8421 | 37.68 | 979 | 960 | 198.0 |
| B | 5 | 172 | 173819 | 931.23 | 970 | 948 | 185.6 |
| B | 0 | 189 | 109486 | 584.67 | 970 | 948 | 185.6 |
| B | 0 | 230 | 36587 | 191.98 | 970 | 948 | 185.6 |
| C | 3 | 233 | 154464 | 698.49 | 942 | 950 | 219.8 |
| C | 14 | 238 | 150183 | 679.01 | 942 | 950 | 219.8 |
| C | 4 | 254 | 17139 | 73.66 | 942 | 950 | 219.8 |
| D | 1 | 52 | 3370154 | 15411.27 | 895 | 877 | 218.6 |
| D | 7 | 80 | 227065 | 1034.6 | 895 | 877 | 218.6 |
| D | 12 | 233 | 189971 | 864.93 | 895 | 877 | 218.6 |
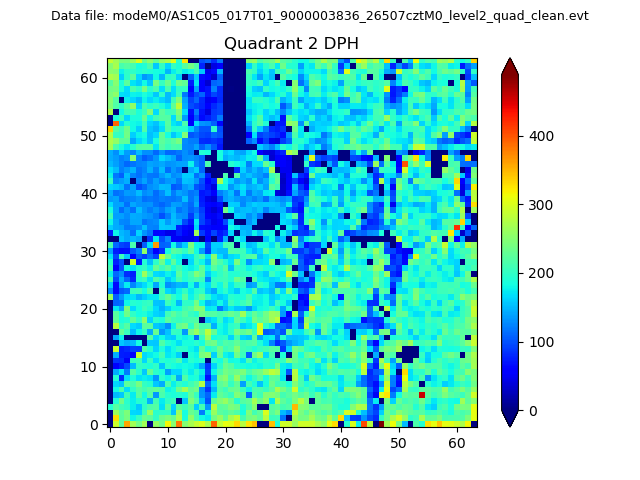
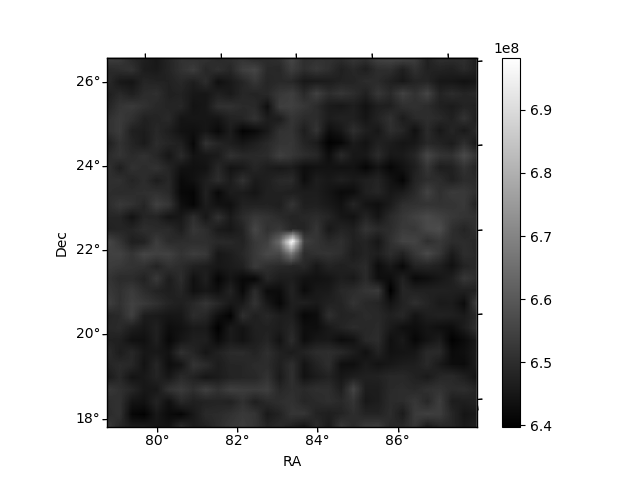
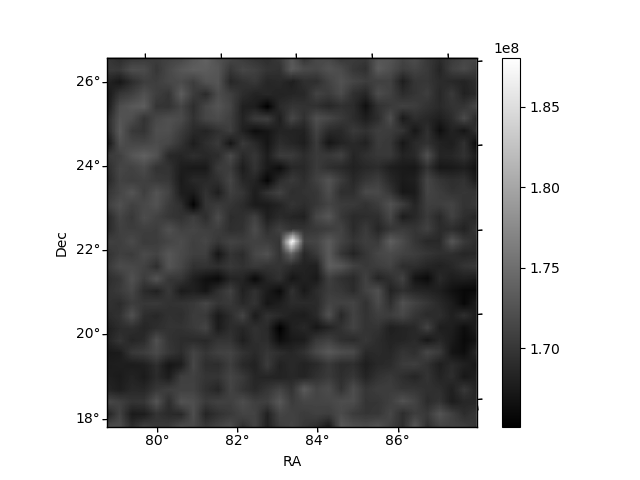
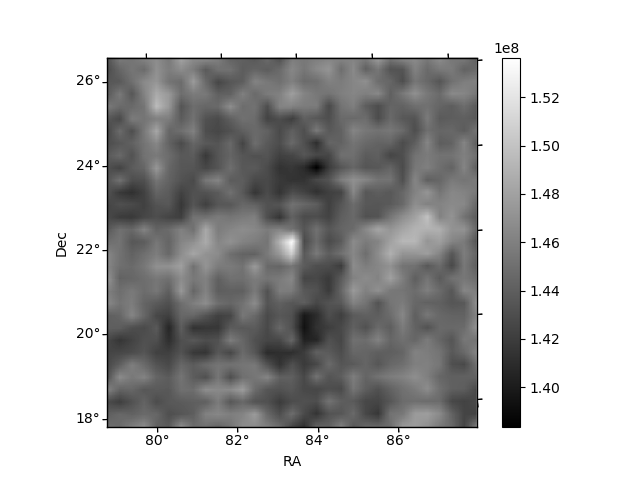
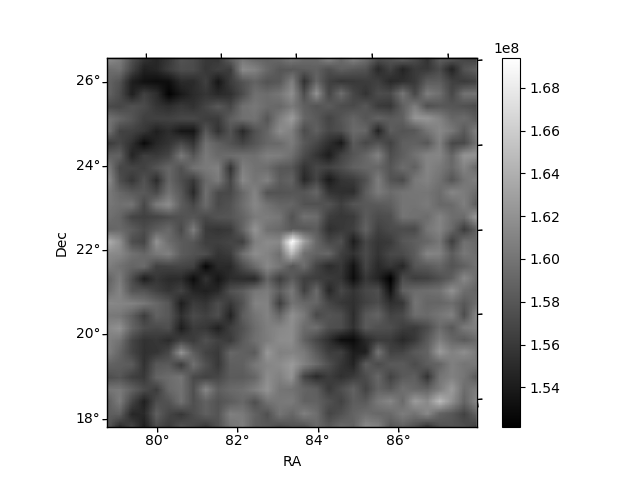
Histogram calculated using DETX and DETY for each event in the final _common_clean file
| Quadrant A | 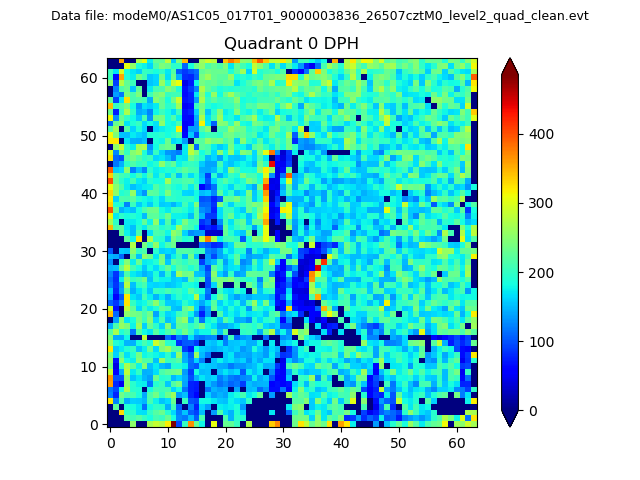 |
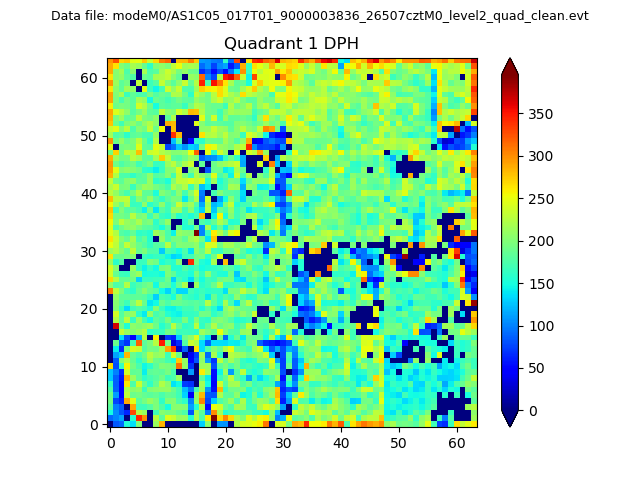 |
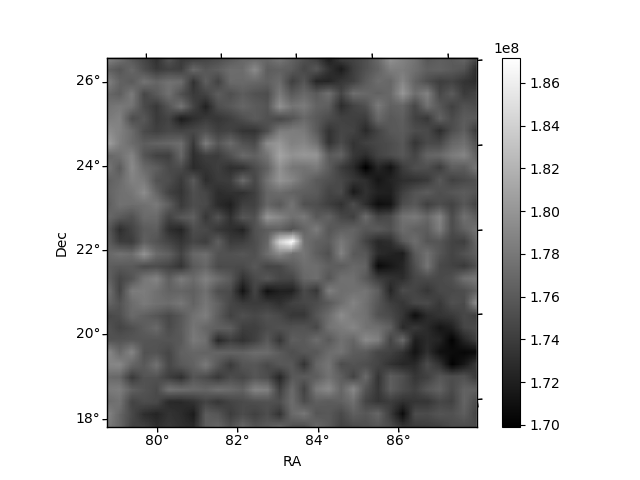
Quadrant B |
|---|---|---|---|
| Quadrant D | 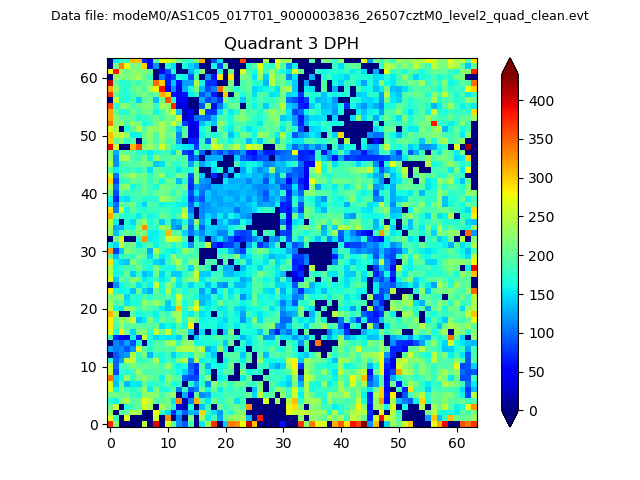 |
 |
Quadrant C |
| Plot type | Count rate plots | Images |
|---|---|---|
| Comparison with Poisson distribution Blue bars denote a histogram of data divided into 1 sec bins. Red curve is a Poisson curve with rate = median count rate of data. |
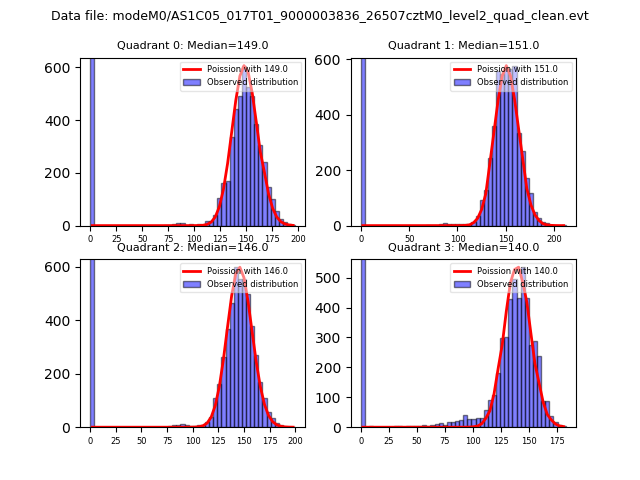 |
 |
| Quadrant-wise count rates Data is divided into 100 sec bins |
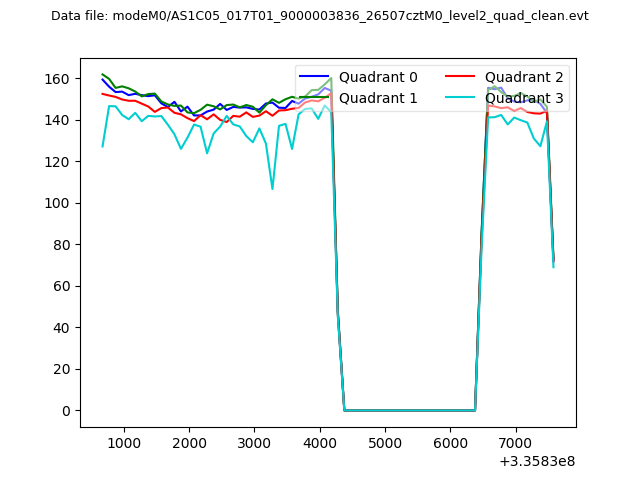 |
|
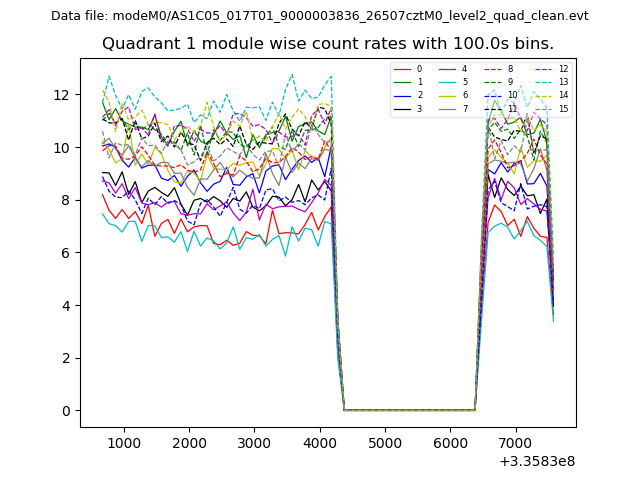
| Module-wise count rates for Quadrant A Data is divided into 100 sec bins |
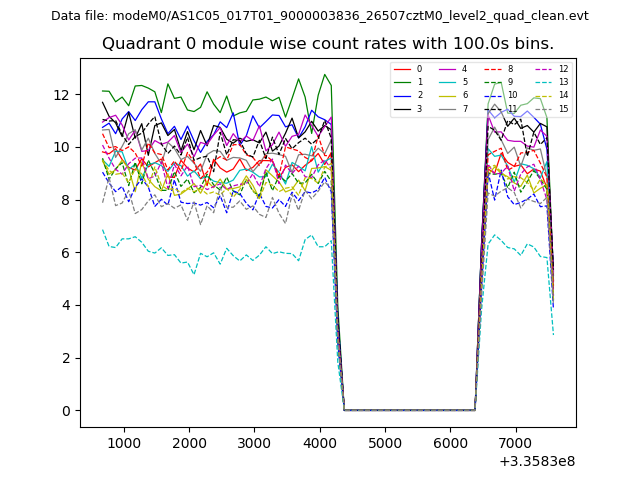 |
 |
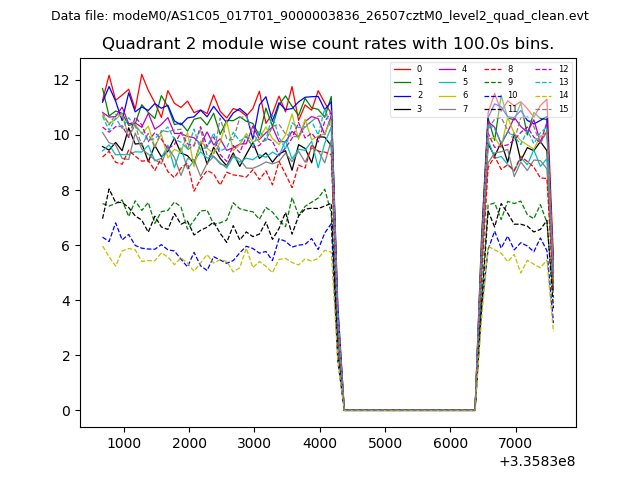
| Module-wise count rates for Quadrant B Data is divided into 100 sec bins |
 |
 |
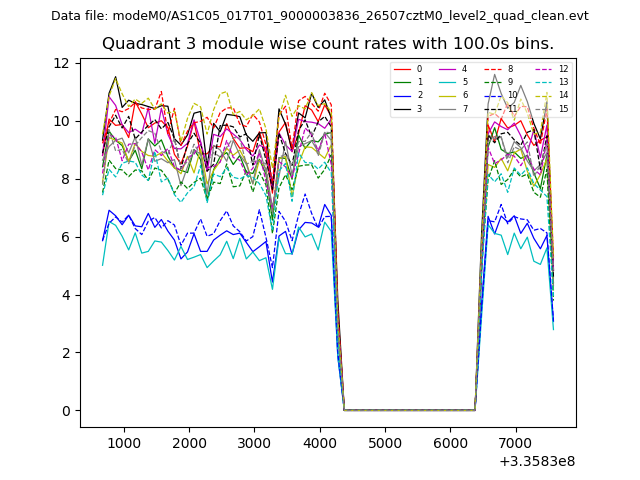
| Module-wise count rates for Quadrant C Data is divided into 100 sec bins |
 |
 |
| Module-wise count rates for Quadrant D Data is divided into 100 sec bins |
 |
 |
| Parameter | Plot |
|---|---|
| CZT HV Monitor | 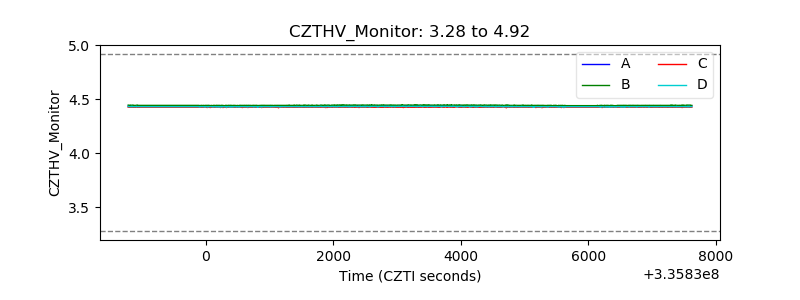 |
| D_VDD | 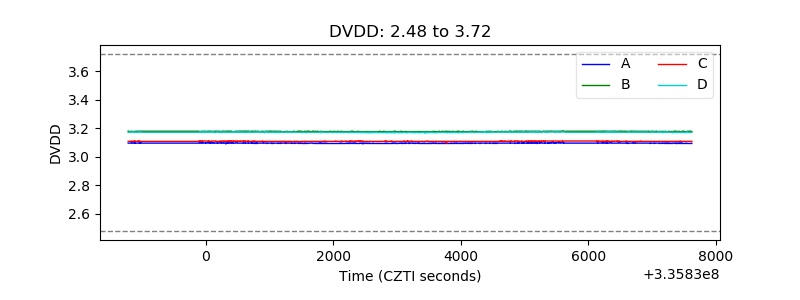 |
| Temperature 1 | 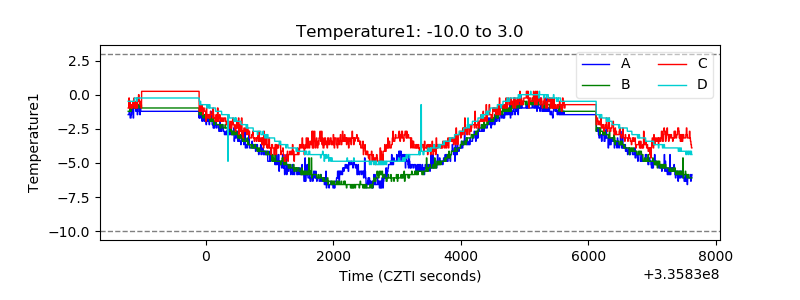 |
| Veto HV Monitor | 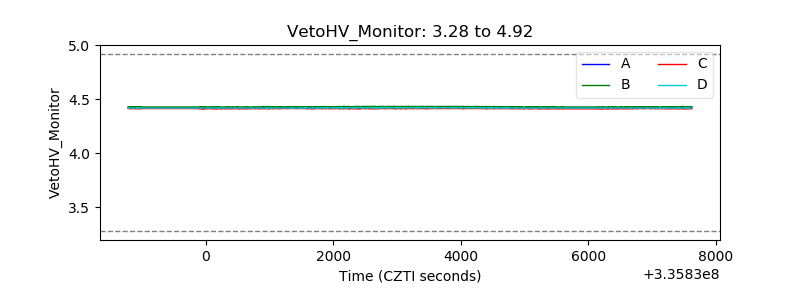 |
| Veto LLD | 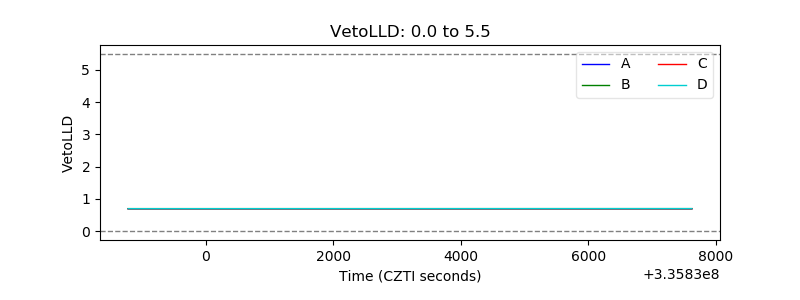 |
| Alpha Counter | 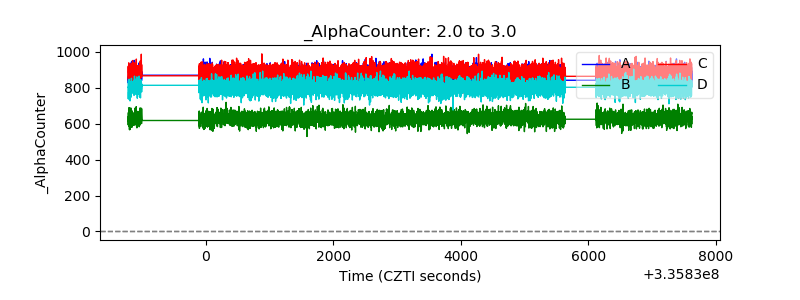 |
| _CPM_Rate | 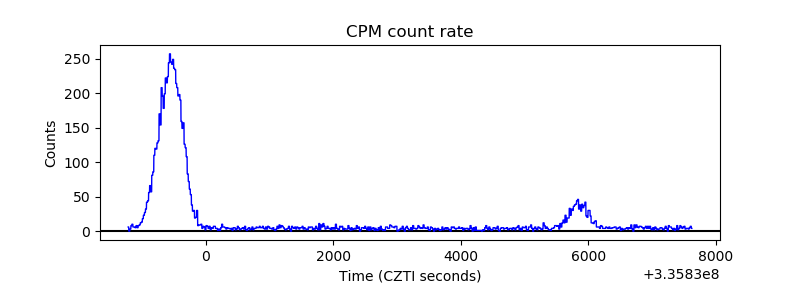 |
| CZT Counter | 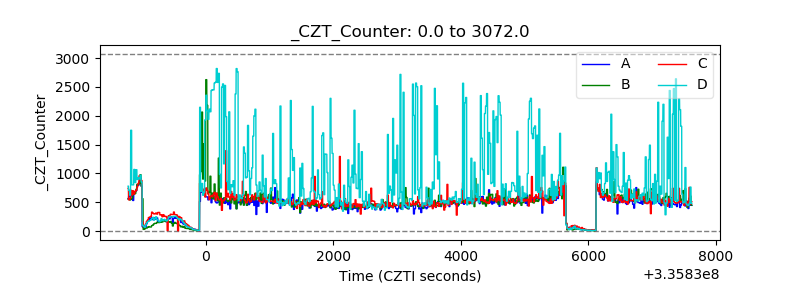 |
| +2.5 Volts monitor |  |
| +5 Volts monitor |  |
| _ROLL_ROT |  |
| _Roll_DEC | 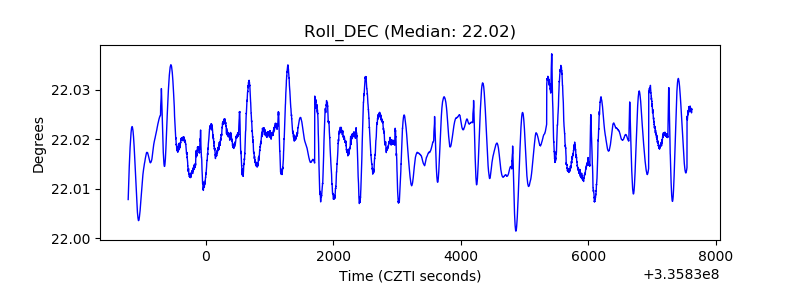 |
| _Roll_RA | 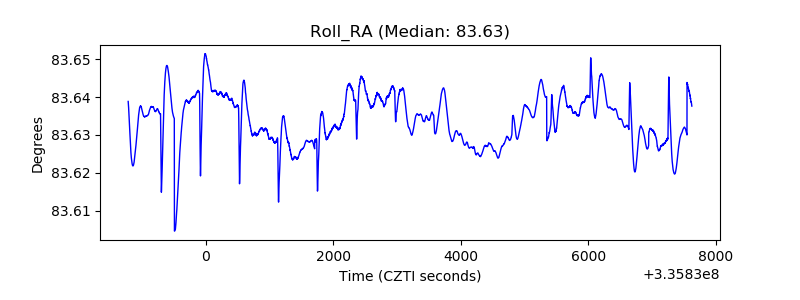 |
| Veto Counter | 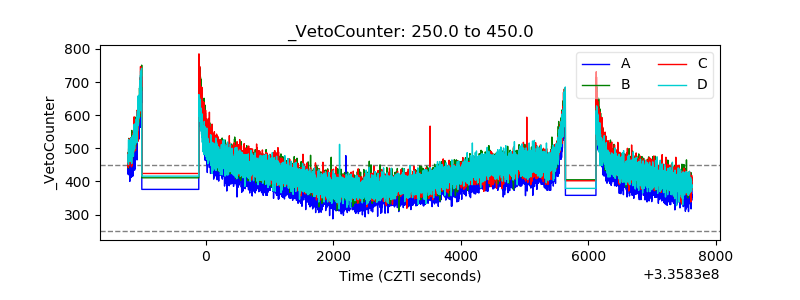 |