| Param | Original file | Final file |
|---|---|---|
| Filename | modeM0/AS1C05_017T01_9000003836_26508cztM0_level2.evt | modeM0/AS1C05_017T01_9000003836_26508cztM0_level2_quad_clean.evt |
| Size (bytes) | 710,856,000 | 114,125,760 |
| Size | 677.9 MB | 108.8 MB |
| Events in quadrant A | 3,774,261 | 754,378 |
| Events in quadrant B | 4,799,529 | 755,634 |
| Events in quadrant C | 4,132,478 | 730,311 |
| Events in quadrant D | 8,310,462 | 690,180 |
| Mode M9 | |||
|---|---|---|---|
| Quadrant | BADHDUFLAG | Total packets | Discarded packets |
| A | 0 | 3 | 0 |
| B | 0 | 4 | 0 |
| C | 0 | 4 | 0 |
| D | 0 | 4 | 0 |
| Mode M0 | |||
|---|---|---|---|
| Quadrant | BADHDUFLAG | Total packets | Discarded packets |
| A | 0 | 15847 | 0 |
| B | 0 | 18971 | 0 |
| C | 0 | 16932 | 0 |
| D | 0 | 29904 | 0 |
| Quadrant | Total seconds | Saturated seconds | Saturation percentage |
|---|---|---|---|
| A | 7561 | 81 | 1.071287% |
| B | 7561 | 304 | 4.020632% |
| C | 7561 | 185 | 2.446766% |
| D | 7561 | 1811 | 23.951858% |
Noise dominated data is calculated using 1-second bins in cleaned event files. If a bin has >2000 counts, and if more than 50% of those come from <1% of pixels, then it is considered to be noise-dominated and hence unusable.
| Quadrant | # 1 sec bins | Bins with >0 counts | Bins with >2000 counts | High rate bins dominated by noise | Noise dominated (total time) | Noise dominated (detector-on time) | Marked lightcurve |
|---|---|---|---|---|---|---|---|
| A | 7761 | 7564 | 0 | 0 | 0.00% | 0.00% | 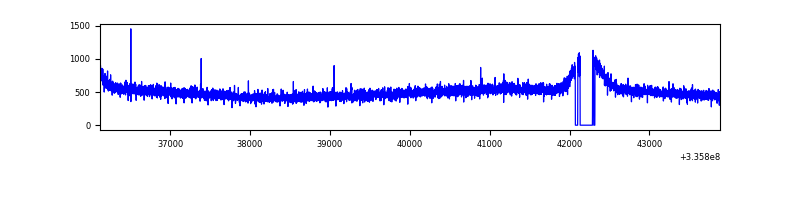 |
| B | 7761 | 7562 | 17 | 17 | 0.22% | 0.22% | 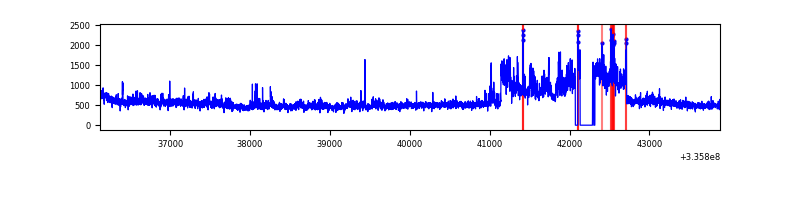 |
| C | 7761 | 7563 | 1 | 1 | 0.01% | 0.01% | 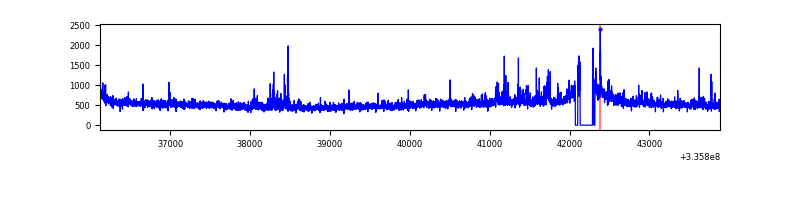 |
| D | 7761 | 7563 | 1488 | 1488 | 19.17% | 19.67% | 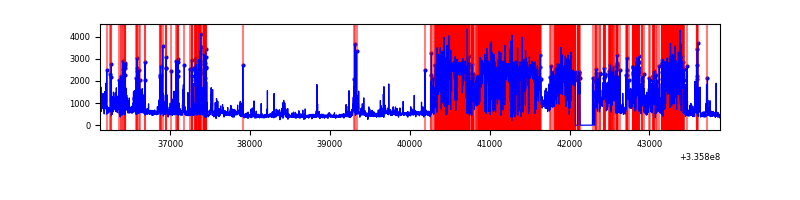 |
Top three noisy pixels from each quadrant. If the there are fewer than three noisy pixels in the level2.evt file, extra rows are filled as -1
| Pixel properties | Quadrant properties | ||||||
|---|---|---|---|---|---|---|---|
| Quadrant | DetID | PixID | Counts | Sigma | Mean | Median | Sigma |
| A | 13 | 254 | 14068 | 65.77 | 976 | 958 | 199.3 |
| A | 6 | 16 | 10895 | 49.85 | 976 | 958 | 199.3 |
| A | 3 | 137 | 8798 | 39.33 | 976 | 958 | 199.3 |
| B | 0 | 189 | 695863 | 3771.63 | 965 | 945 | 184.2 |
| B | 7 | 205 | 265927 | 1438.17 | 965 | 945 | 184.2 |
| B | 12 | 111 | 21786 | 113.11 | 965 | 945 | 184.2 |
| C | 3 | 233 | 282322 | 1268.03 | 936 | 944 | 221.9 |
| C | 14 | 238 | 149789 | 670.77 | 936 | 944 | 221.9 |
| C | 4 | 254 | 23767 | 102.85 | 936 | 944 | 221.9 |
| D | 1 | 52 | 4820609 | 22683.94 | 843 | 825 | 212.5 |
| D | 12 | 233 | 224860 | 1054.4 | 843 | 825 | 212.5 |
| D | 2 | 234 | 30254 | 138.51 | 843 | 825 | 212.5 |
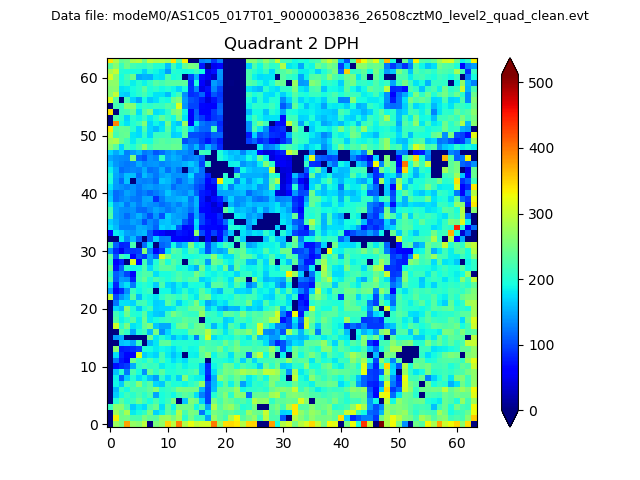
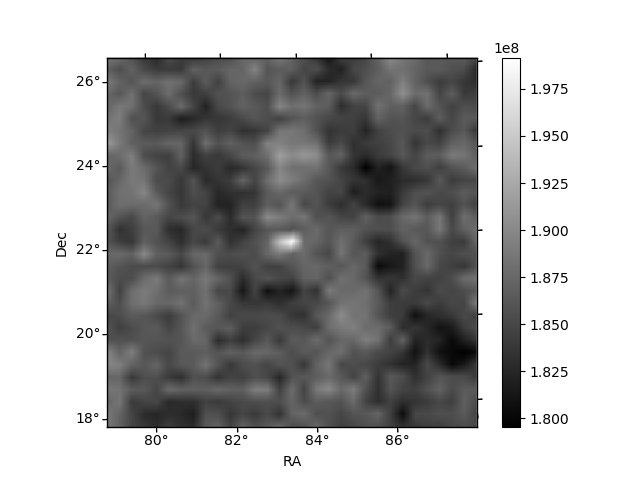
Histogram calculated using DETX and DETY for each event in the final _common_clean file
| Quadrant A | 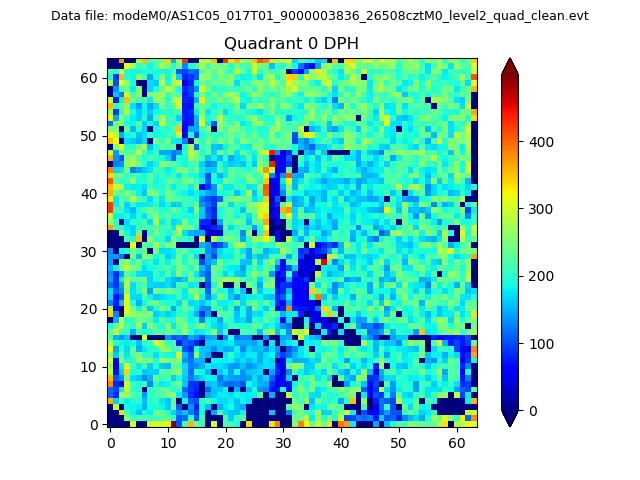 |
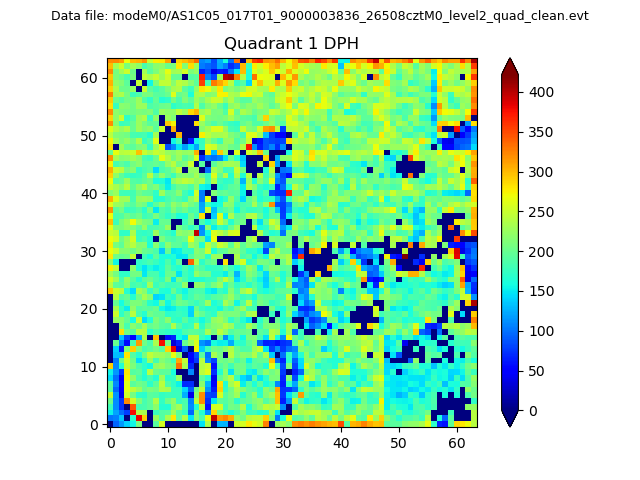 |
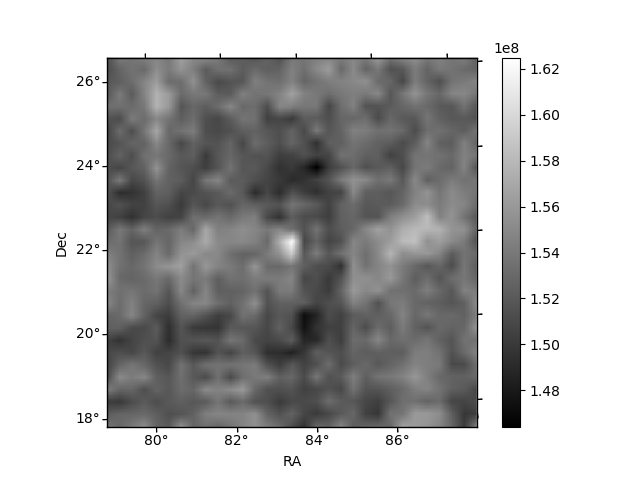
Quadrant B |
|---|---|---|---|
| Quadrant D | 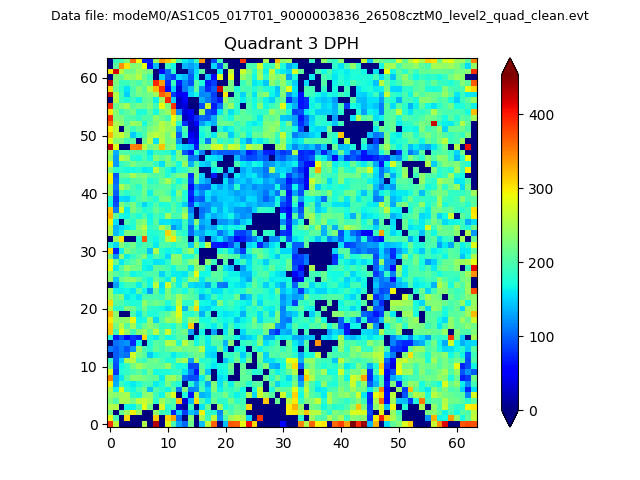 |
 |
Quadrant C |
| Plot type | Count rate plots | Images |
|---|---|---|
| Comparison with Poisson distribution Blue bars denote a histogram of data divided into 1 sec bins. Red curve is a Poisson curve with rate = median count rate of data. |
 |
 |
| Quadrant-wise count rates Data is divided into 100 sec bins |
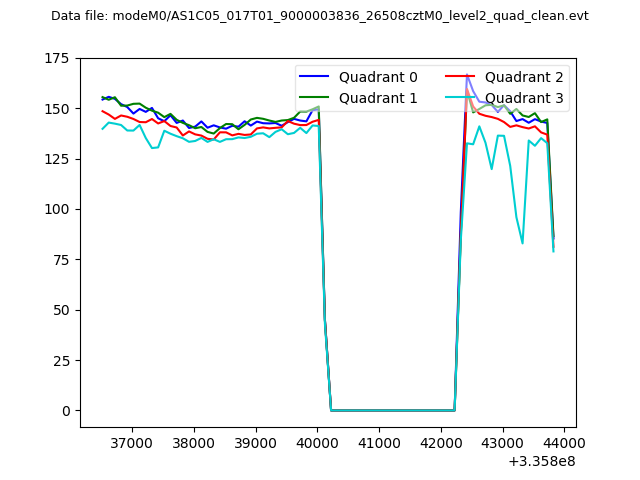 |
|
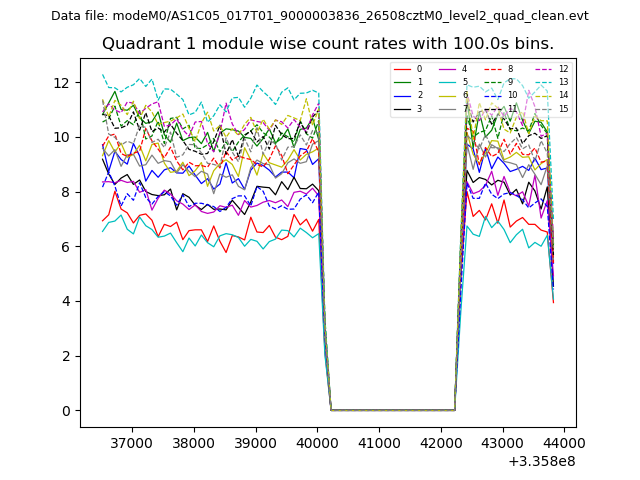
| Module-wise count rates for Quadrant A Data is divided into 100 sec bins |
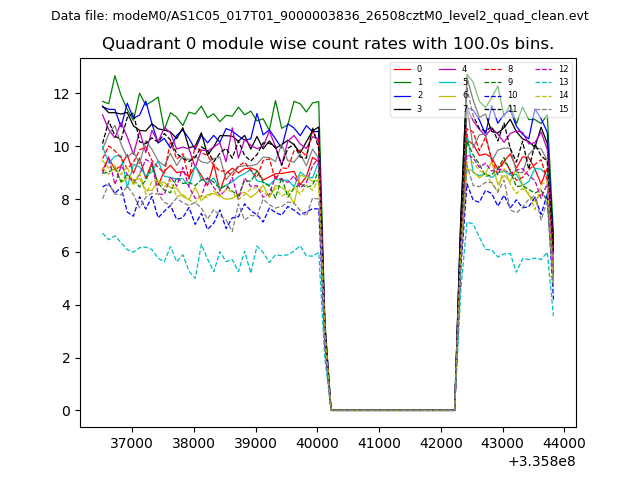 |
 |
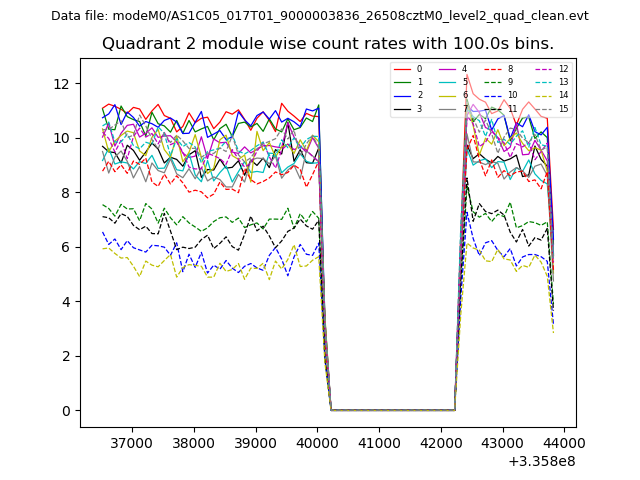
| Module-wise count rates for Quadrant B Data is divided into 100 sec bins |
 |
 |
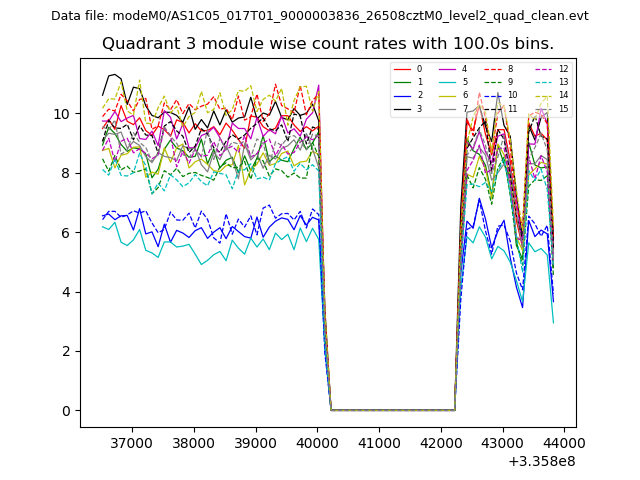
| Module-wise count rates for Quadrant C Data is divided into 100 sec bins |
 |
 |
| Module-wise count rates for Quadrant D Data is divided into 100 sec bins |
 |
 |
| Parameter | Plot |
|---|---|
| CZT HV Monitor | 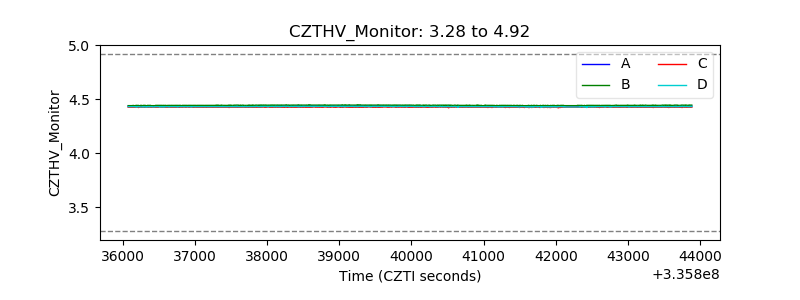 |
| D_VDD | 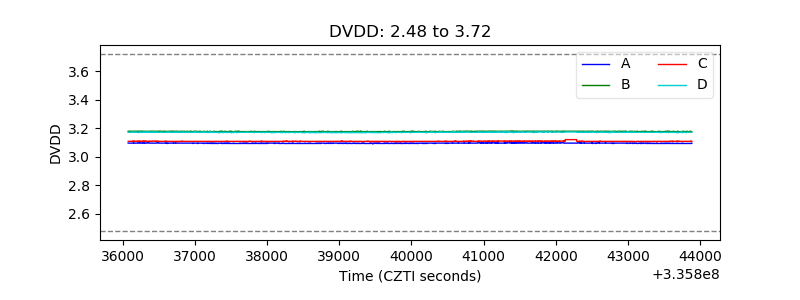 |
| Temperature 1 | 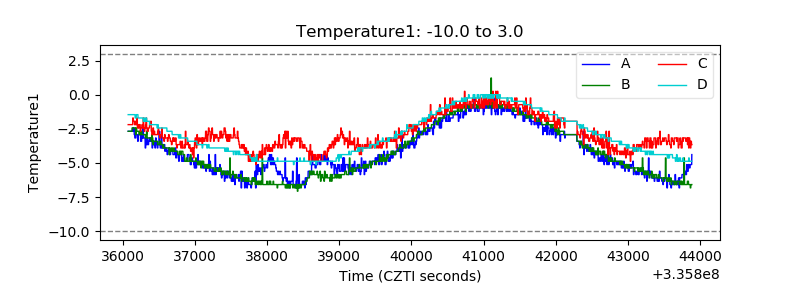 |
| Veto HV Monitor | 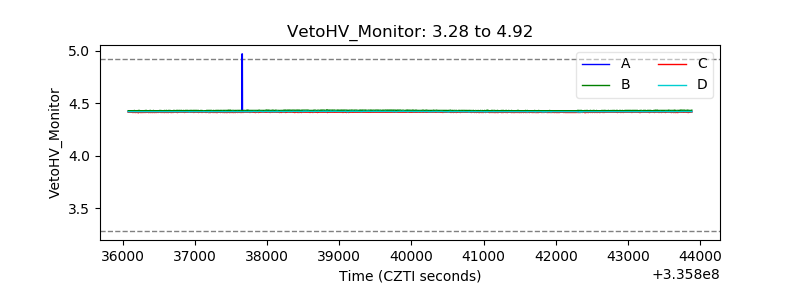 |
| Veto LLD | 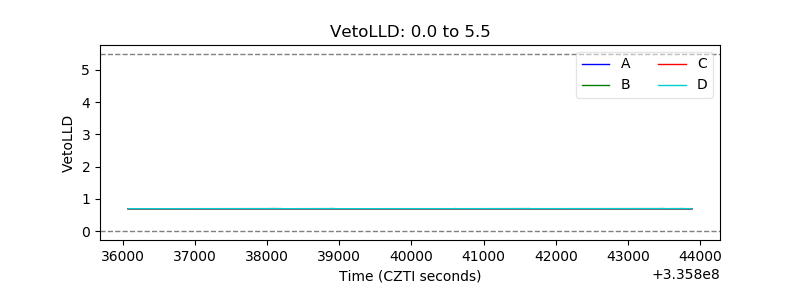 |
| Alpha Counter | 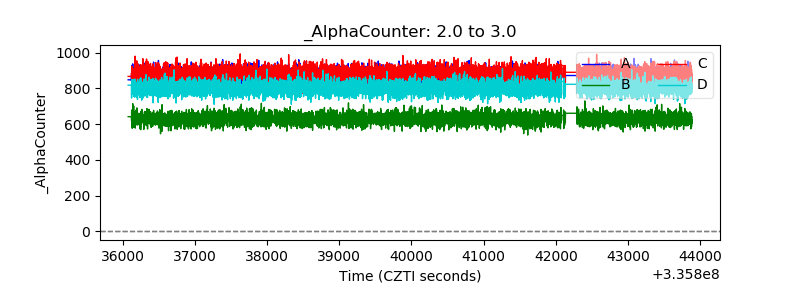 |
| _CPM_Rate | 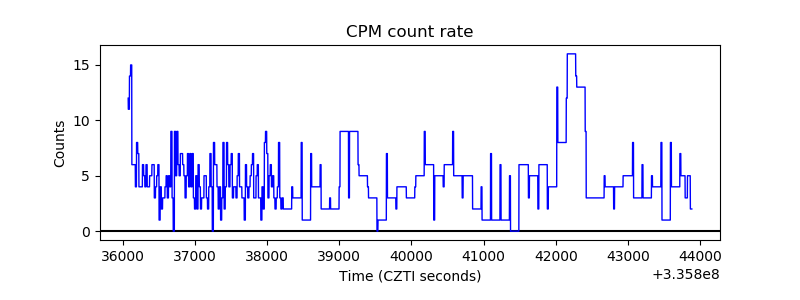 |
| CZT Counter | 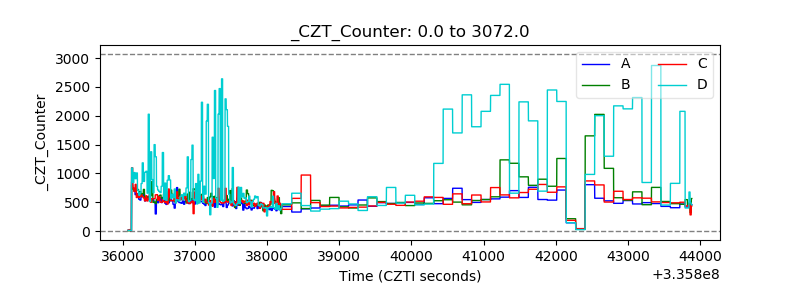 |
| +2.5 Volts monitor |  |
| +5 Volts monitor | 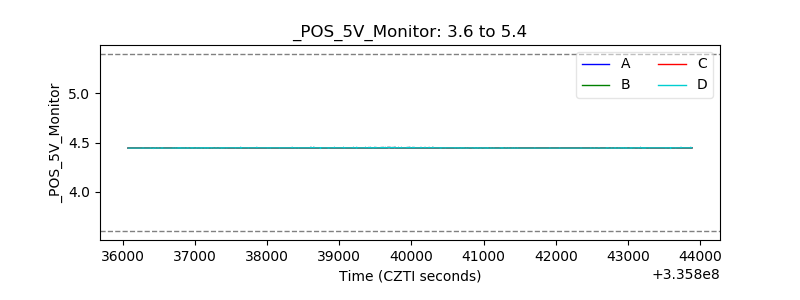 |
| _ROLL_ROT | 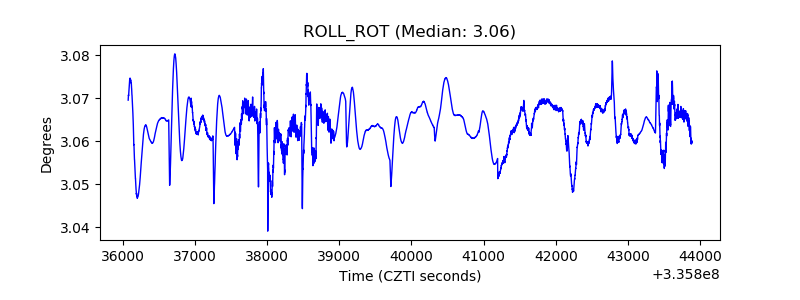 |
| _Roll_DEC | 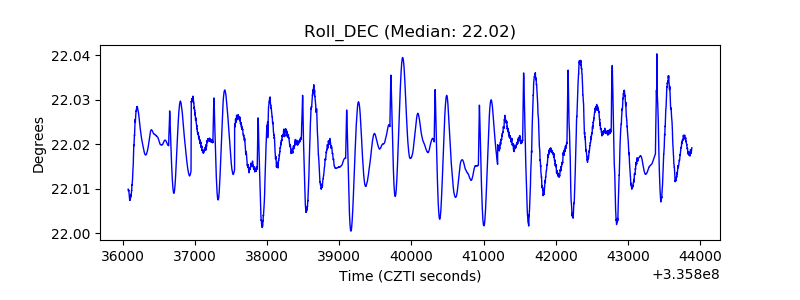 |
| _Roll_RA | 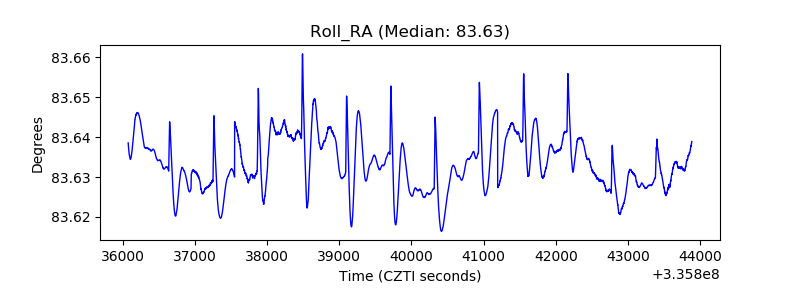 |
| Veto Counter | 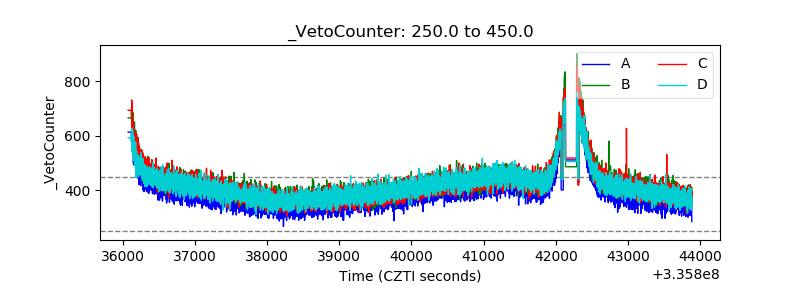 |