| Param | Original file | Final file |
|---|---|---|
| Filename | modeM0/AS1C05_017T01_9000003836_26513cztM0_level2.evt | modeM0/AS1C05_017T01_9000003836_26513cztM0_level2_quad_clean.evt |
| Size (bytes) | 2,258,452,800 | 316,045,440 |
| Size | 2.1 GB | 301.4 MB |
| Events in quadrant A | 11,422,879 | 2,071,118 |
| Events in quadrant B | 22,906,503 | 2,013,978 |
| Events in quadrant C | 12,257,645 | 2,012,564 |
| Events in quadrant D | 20,252,986 | 1,880,371 |
| Mode M9 | |||
|---|---|---|---|
| Quadrant | BADHDUFLAG | Total packets | Discarded packets |
| A | 0 | 22 | 0 |
| B | 0 | 22 | 0 |
| C | 0 | 22 | 0 |
| D | 0 | 22 | 0 |
| Mode M0 | |||
|---|---|---|---|
| Quadrant | BADHDUFLAG | Total packets | Discarded packets |
| A | 0 | 48251 | 0 |
| B | 0 | 84343 | 0 |
| C | 0 | 50878 | 0 |
| D | 0 | 75965 | 0 |
| Quadrant | Total seconds | Saturated seconds | Saturation percentage |
|---|---|---|---|
| A | 23153 | 241 | 1.040902% |
| B | 23154 | 3384 | 14.615185% |
| C | 23154 | 396 | 1.710288% |
| D | 23154 | 2218 | 9.579338% |
Noise dominated data is calculated using 1-second bins in cleaned event files. If a bin has >2000 counts, and if more than 50% of those come from <1% of pixels, then it is considered to be noise-dominated and hence unusable.
| Quadrant | # 1 sec bins | Bins with >0 counts | Bins with >2000 counts | High rate bins dominated by noise | Noise dominated (total time) | Noise dominated (detector-on time) | Marked lightcurve |
|---|---|---|---|---|---|---|---|
| A | 25378 | 23154 | 3 | 3 | 0.01% | 0.01% | 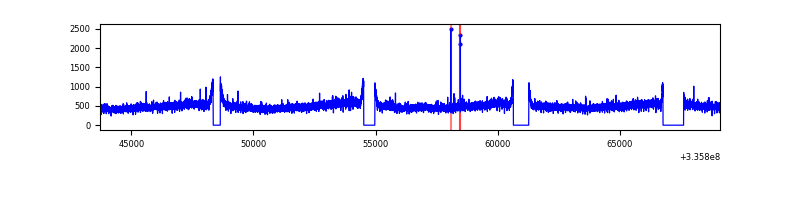 |
| B | 25379 | 23154 | 1474 | 1474 | 5.81% | 6.37% | 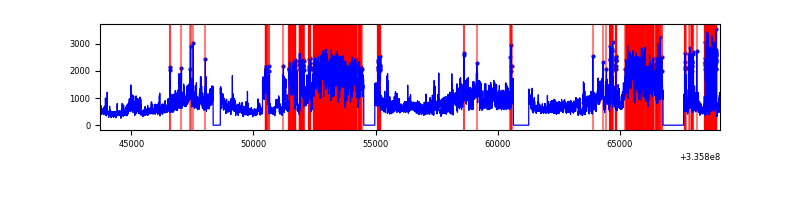 |
| C | 25379 | 23155 | 17 | 17 | 0.07% | 0.07% | 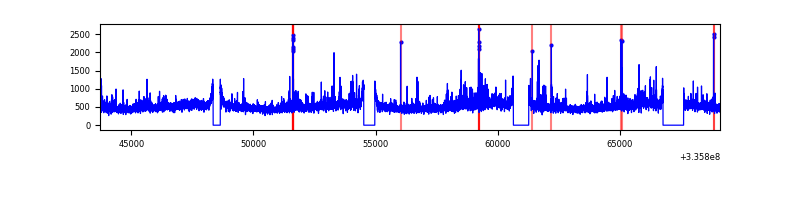 |
| D | 25379 | 23157 | 1798 | 1798 | 7.08% | 7.76% | 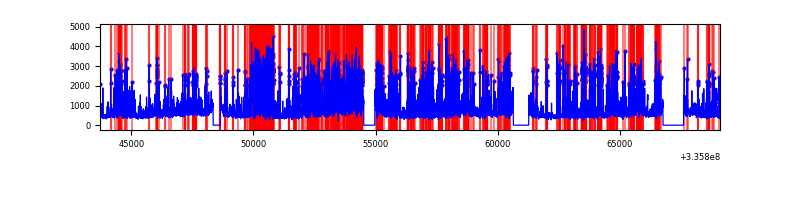 |
Top three noisy pixels from each quadrant. If the there are fewer than three noisy pixels in the level2.evt file, extra rows are filled as -1
| Pixel properties | Quadrant properties | ||||||
|---|---|---|---|---|---|---|---|
| Quadrant | DetID | PixID | Counts | Sigma | Mean | Median | Sigma |
| A | 6 | 16 | 221563 | 375.08 | 2904 | 2846 | 583.1 |
| A | 13 | 254 | 36431 | 57.6 | 2904 | 2846 | 583.1 |
| A | 3 | 137 | 26329 | 40.27 | 2904 | 2846 | 583.1 |
| B | 0 | 189 | 7903054 | 15027.0 | 2790 | 2730 | 525.7 |
| B | 7 | 205 | 3927731 | 7465.64 | 2790 | 2730 | 525.7 |
| B | 5 | 172 | 65006 | 118.45 | 2790 | 2730 | 525.7 |
| C | 3 | 233 | 687410 | 1046.26 | 2775 | 2801 | 654.3 |
| C | 14 | 238 | 442132 | 671.41 | 2775 | 2801 | 654.3 |
| C | 14 | 176 | 178258 | 268.14 | 2775 | 2801 | 654.3 |
| D | 1 | 52 | 8410349 | 12391.91 | 2704 | 2648 | 678.5 |
| D | 12 | 233 | 678739 | 996.47 | 2704 | 2648 | 678.5 |
| D | 7 | 80 | 554755 | 813.74 | 2704 | 2648 | 678.5 |
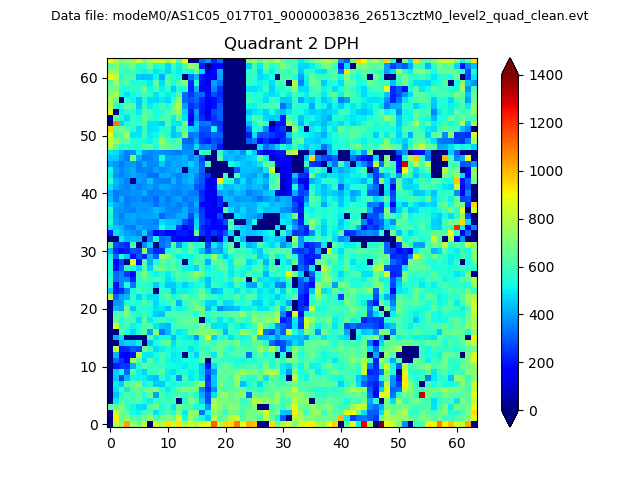
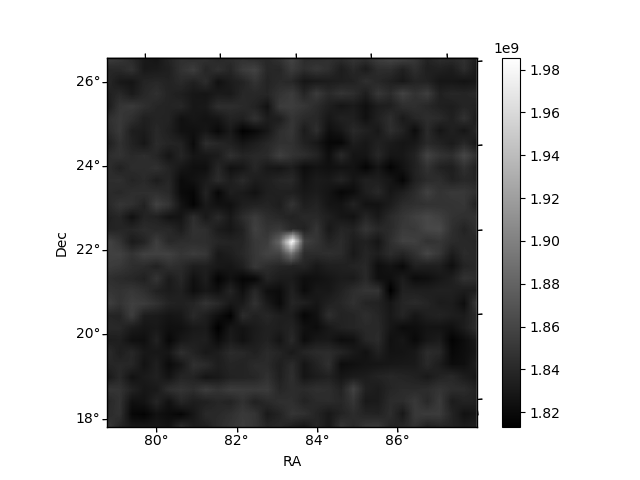
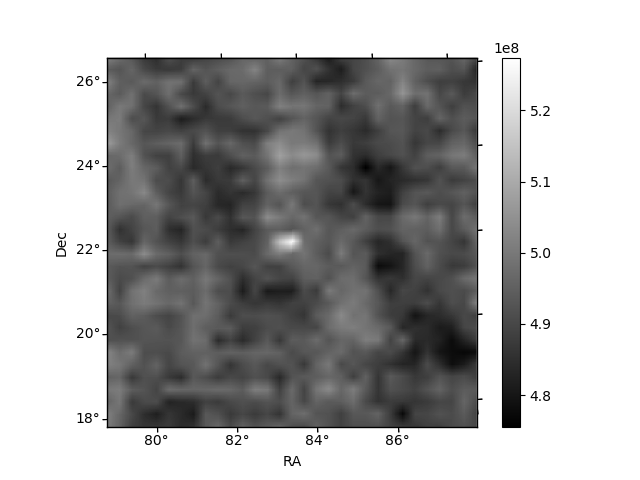
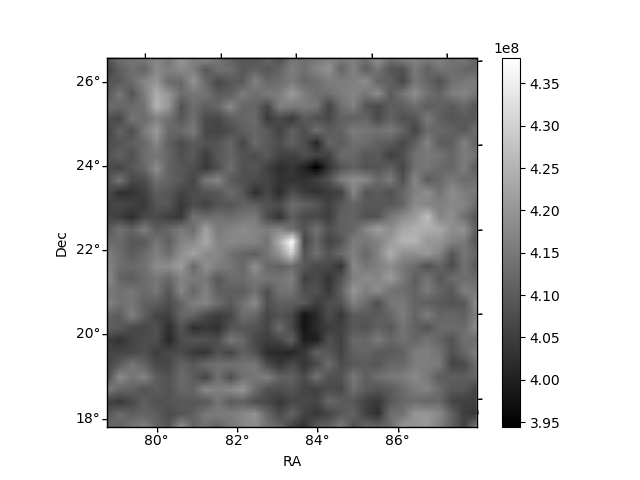
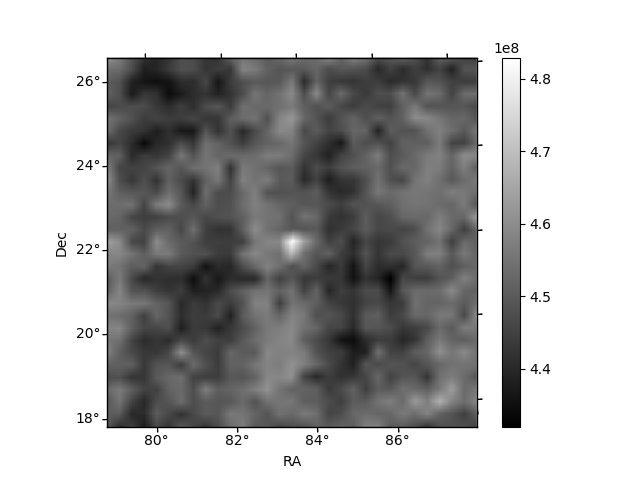
Histogram calculated using DETX and DETY for each event in the final _common_clean file
| Quadrant A | 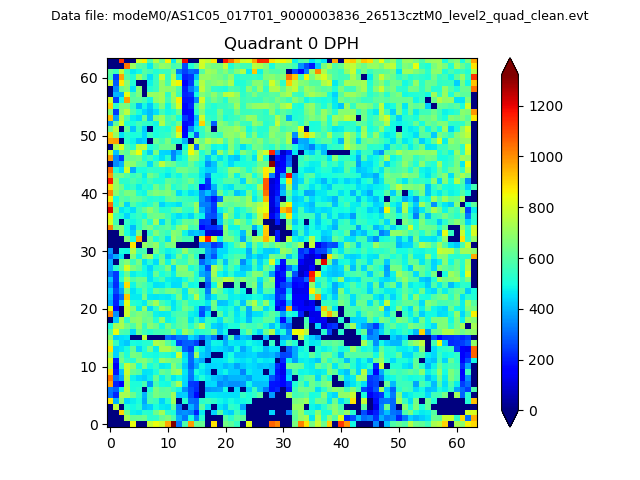 |
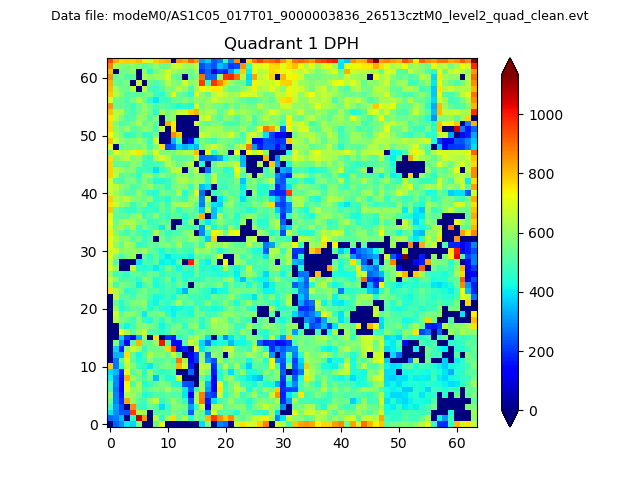 |
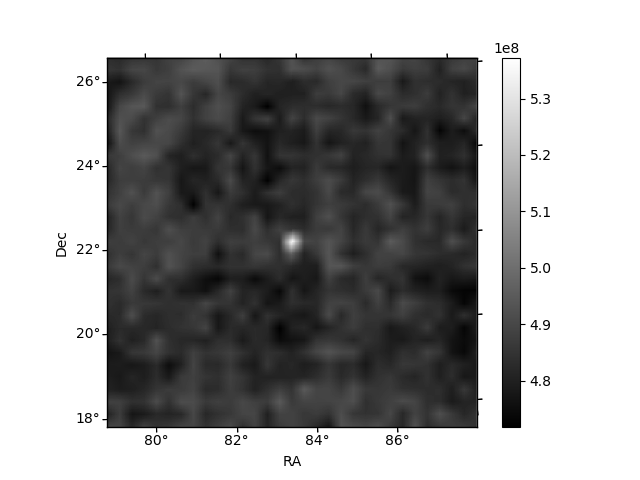
Quadrant B |
|---|---|---|---|
| Quadrant D | 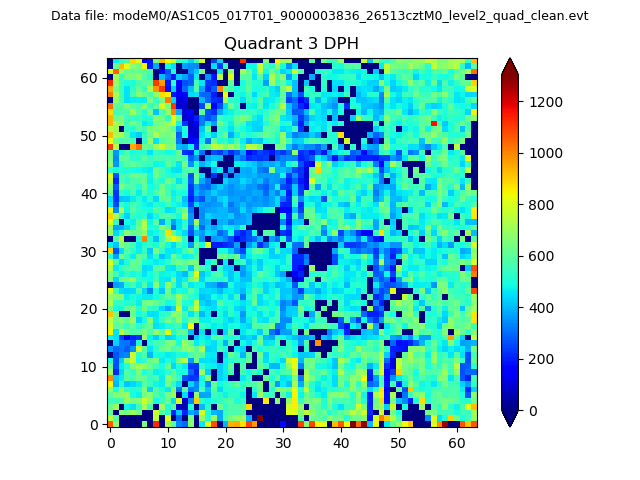 |
 |
Quadrant C |
| Plot type | Count rate plots | Images |
|---|---|---|
| Comparison with Poisson distribution Blue bars denote a histogram of data divided into 1 sec bins. Red curve is a Poisson curve with rate = median count rate of data. |
 |
 |
| Quadrant-wise count rates Data is divided into 100 sec bins |
 |
|
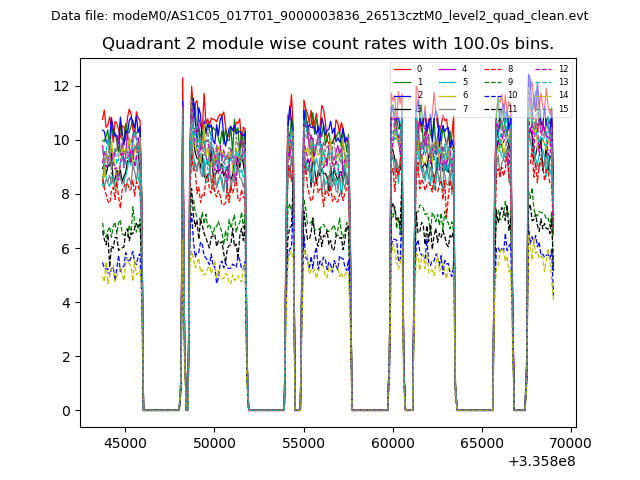
| Module-wise count rates for Quadrant A Data is divided into 100 sec bins |
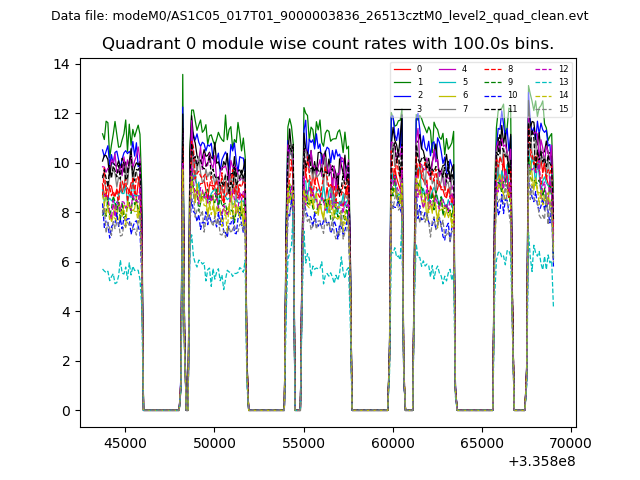 |
 |
| Module-wise count rates for Quadrant B Data is divided into 100 sec bins |
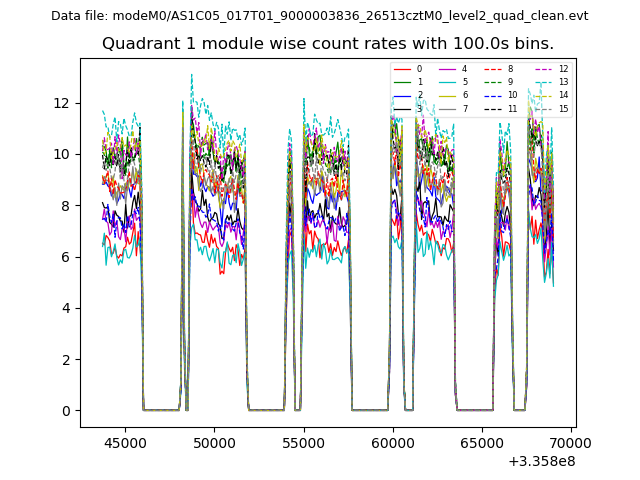 |
 |
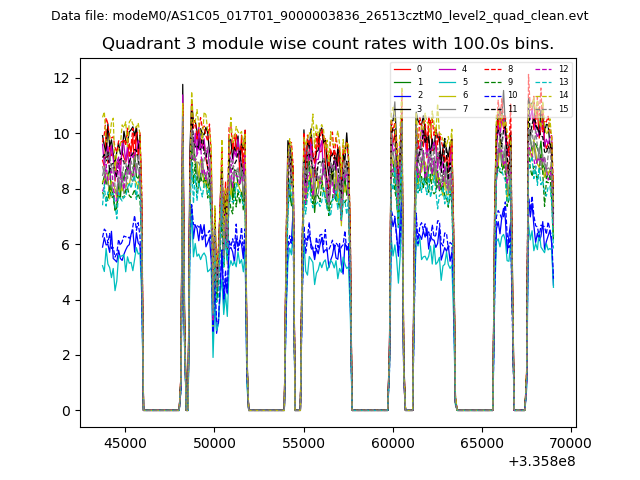
| Module-wise count rates for Quadrant C Data is divided into 100 sec bins |
 |
 |
| Module-wise count rates for Quadrant D Data is divided into 100 sec bins |
 |
 |
| Parameter | Plot |
|---|---|
| CZT HV Monitor | 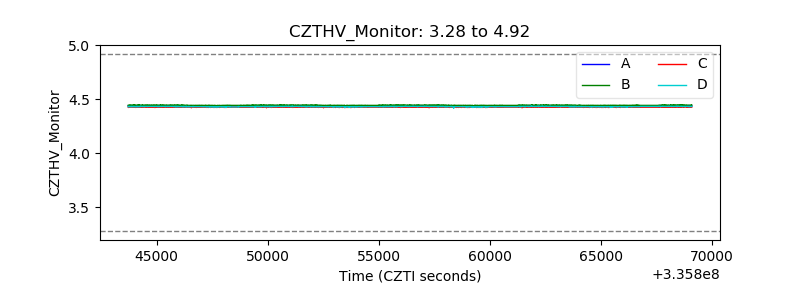 |
| D_VDD | 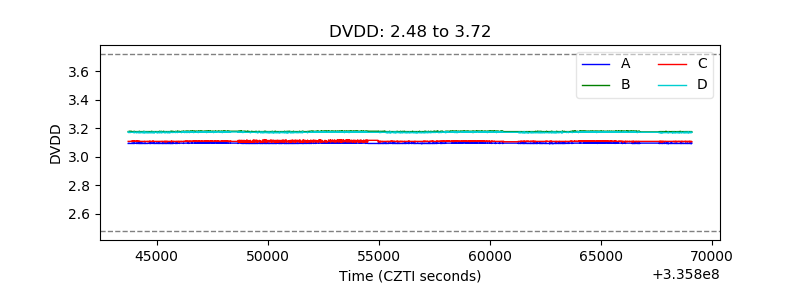 |
| Temperature 1 | 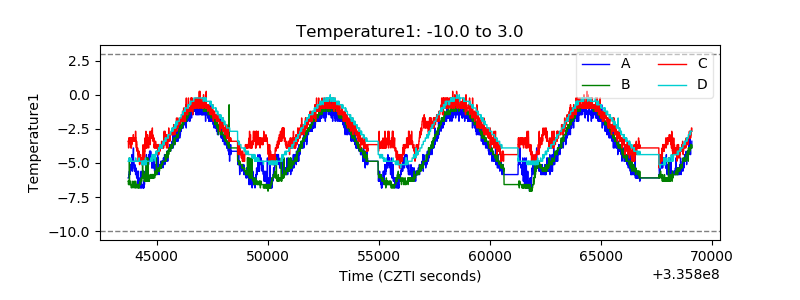 |
| Veto HV Monitor | 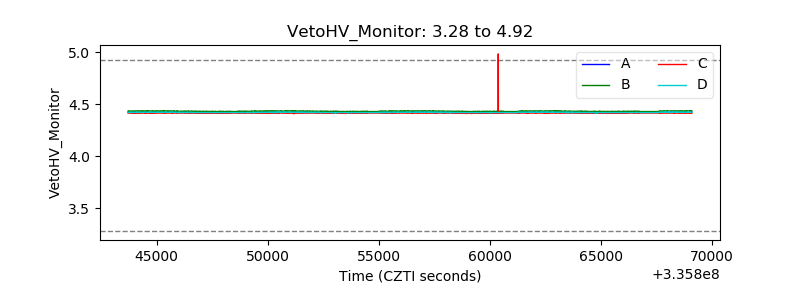 |
| Veto LLD | 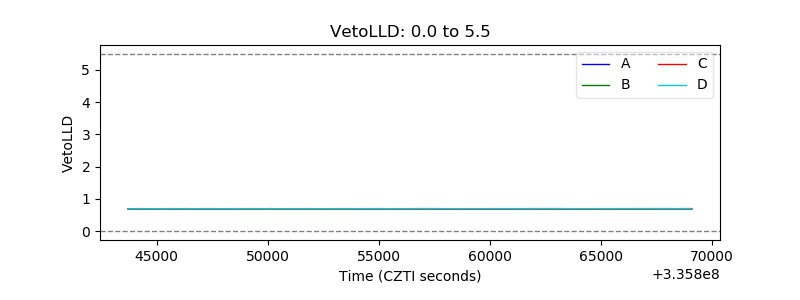 |
| Alpha Counter | 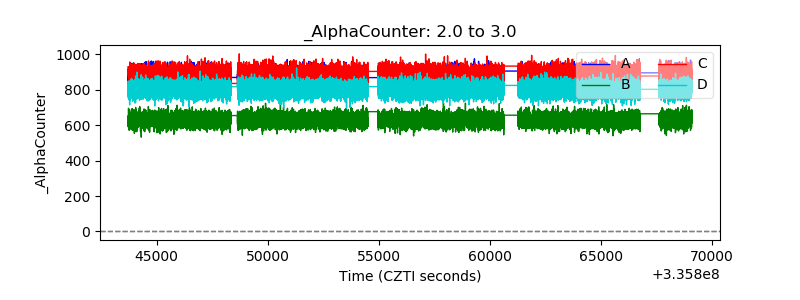 |
| _CPM_Rate |  |
| CZT Counter | 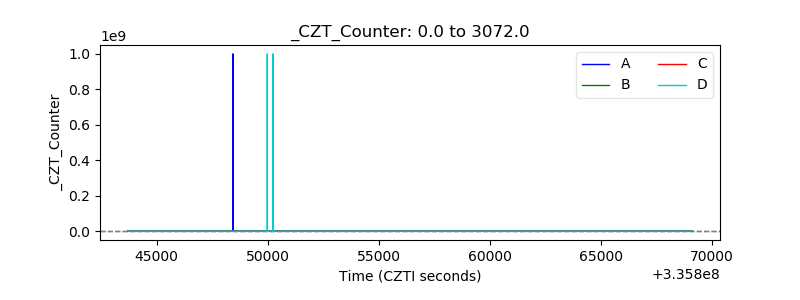 |
| +2.5 Volts monitor | 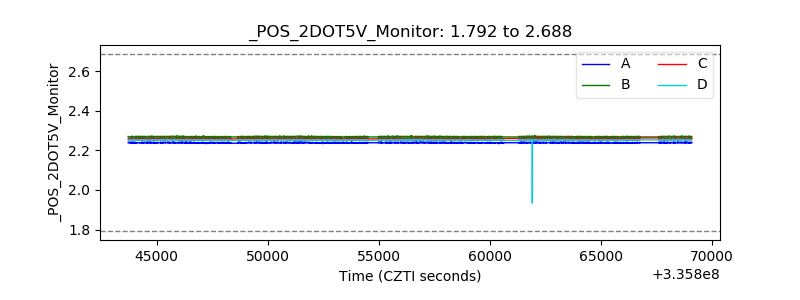 |
| +5 Volts monitor | 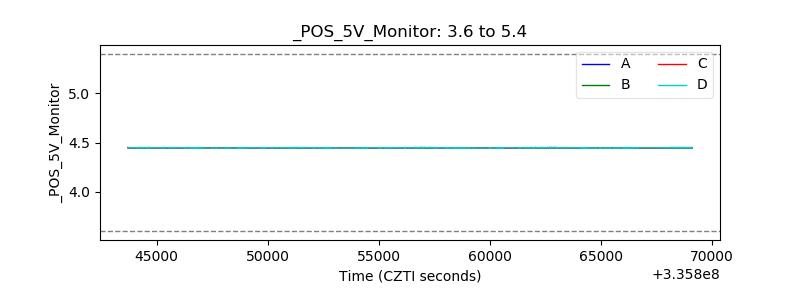 |
| _ROLL_ROT | 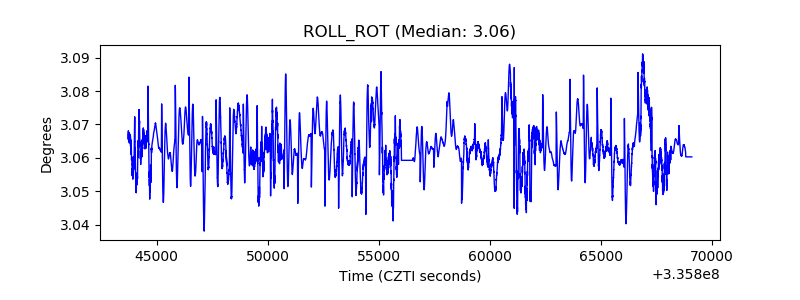 |
| _Roll_DEC |  |
| _Roll_RA | 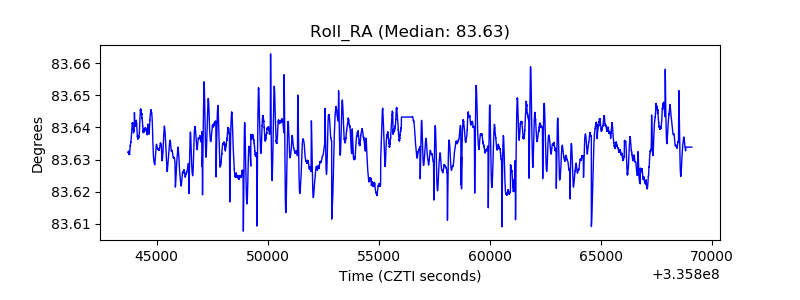 |
| Veto Counter | 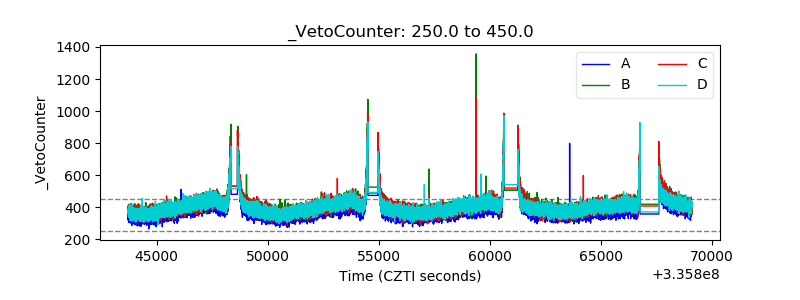 |