| Param | Original file | Final file |
|---|---|---|
| Filename | modeM0/AS1C05_019T04_9000003838cztM0_level2.fits | modeM0/AS1C05_019T04_9000003838cztM0_level2_quad_clean.evt |
| Size (bytes) | 257,428,800 | 249,681,600 |
| Size | 245.5 MB | 238.1 MB |
| Events in quadrant A | 1,640,654 | 1,604,430 |
| Events in quadrant B | 1,465,234 | 1,395,051 |
| Events in quadrant C | 1,553,870 | 1,440,521 |
| Events in quadrant D | 1,332,824 | 1,318,804 |
| Mode SS | |||
|---|---|---|---|
| Quadrant | BADHDUFLAG | Total packets | Discarded packets |
| A | 0 | 538 | 0 |
| B | 0 | 538 | 0 |
| C | 0 | 536 | 0 |
| D | 0 | 540 | 0 |
| Mode M9 | |||
|---|---|---|---|
| Quadrant | BADHDUFLAG | Total packets | Discarded packets |
| A | 0 | 42 | 0 |
| B | 0 | 43 | 0 |
| C | 0 | 43 | 0 |
| D | 0 | 43 | 0 |
| Mode M0 | |||
|---|---|---|---|
| Quadrant | BADHDUFLAG | Total packets | Discarded packets |
| A | 0 | 56165 | 0 |
| B | 0 | 71255 | 0 |
| C | 0 | 62071 | 0 |
| D | 0 | 82818 | 0 |
| Quadrant | Total seconds | Saturated seconds | Saturation percentage |
|---|---|---|---|
| A | 26355 | 221 | 0.838551% |
| B | 25963 | 1918 | 7.387436% |
| C | 26209 | 905 | 3.453012% |
| D | 26182 | 2181 | 8.330150% |
Noise dominated data is calculated using 1-second bins in cleaned event files. If a bin has >2000 counts, and if more than 50% of those come from <1% of pixels, then it is considered to be noise-dominated and hence unusable.
| Quadrant | # 1 sec bins | Bins with >0 counts | Bins with >2000 counts | High rate bins dominated by noise | Noise dominated (total time) | Noise dominated (detector-on time) | Marked lightcurve |
|---|---|---|---|---|---|---|---|
| A | 85062 | 26748 | 0 | 0 | 0.00% | 0.00% |  |
| B | 85062 | 25992 | 0 | 0 | 0.00% | 0.00% |  |
| C | 85061 | 26643 | 0 | 0 | 0.00% | 0.00% |  |
| D | 85061 | 26560 | 0 | 0 | 0.00% | 0.00% |  |
Top three noisy pixels from each quadrant. If the there are fewer than three noisy pixels in the level2.evt file, extra rows are filled as -1
| Pixel properties | Quadrant properties | ||||||
|---|---|---|---|---|---|---|---|
| Quadrant | DetID | PixID | Counts | Sigma | Mean | Median | Sigma |
| A | 0 | 29 | 1394 | 9.29 | 428 | 403 | 106.6 |
| A | 7 | 110 | 1284 | 8.26 | 428 | 403 | 106.6 |
| A | 9 | 19 | 1262 | 8.05 | 428 | 403 | 106.6 |
| B | 2 | 9 | 1200 | 10.67 | 388 | 370 | 77.8 |
| B | 2 | 8 | 1057 | 8.83 | 388 | 370 | 77.8 |
| B | 5 | 128 | 979 | 7.83 | 388 | 370 | 77.8 |
| C | 12 | 241 | 1136 | 7.17 | 411 | 386 | 104.5 |
| C | 9 | 233 | 1069 | 6.53 | 411 | 386 | 104.5 |
| C | 9 | 209 | 1065 | 6.5 | 411 | 386 | 104.5 |
| D | 6 | 67 | 966 | 6.04 | 381 | 348 | 102.3 |
| D | 15 | 46 | 964 | 6.02 | 381 | 348 | 102.3 |
| D | 7 | 3 | 957 | 5.95 | 381 | 348 | 102.3 |
Histogram calculated using DETX and DETY for each event in the final _common_clean file
| Quadrant A | 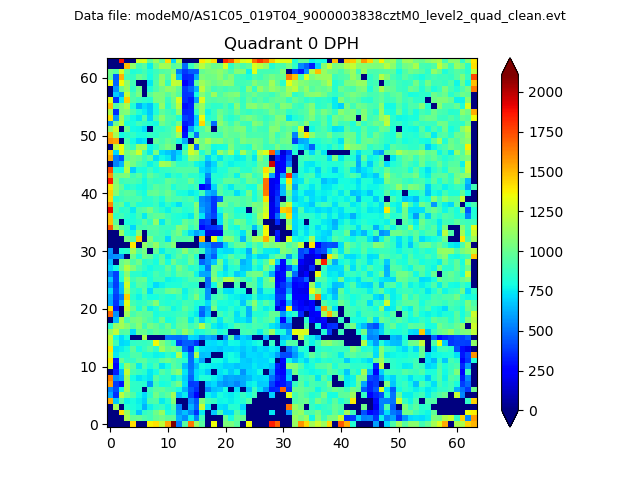 |
 |
Quadrant B |
|---|---|---|---|
| Quadrant D | 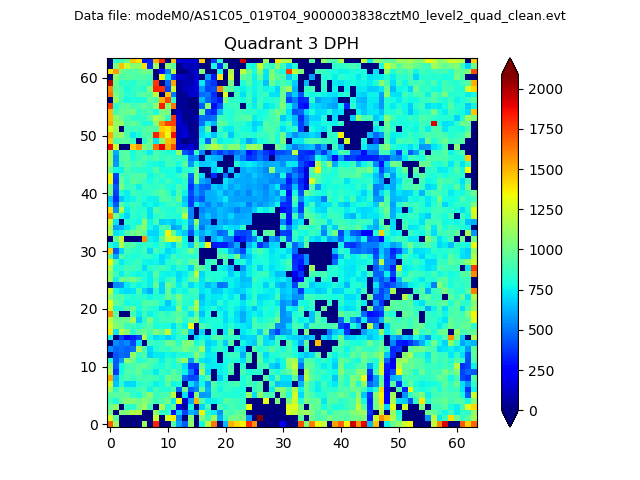 |
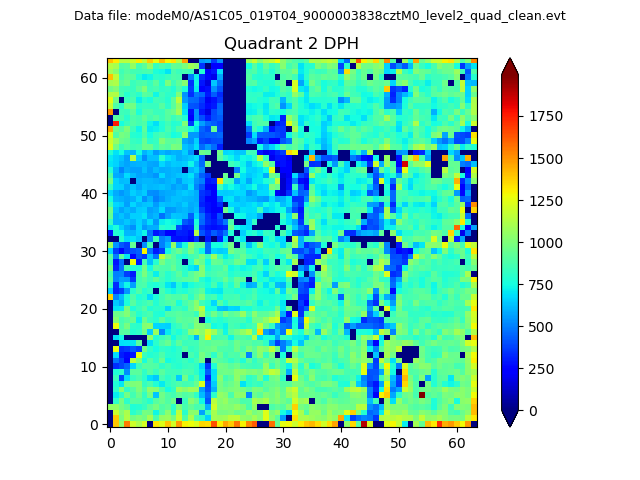 |
Quadrant C |
| Plot type | Count rate plots | Images |
|---|---|---|
| Comparison with Poisson distribution Blue bars denote a histogram of data divided into 1 sec bins. Red curve is a Poisson curve with rate = median count rate of data. |
 |
 |
| Quadrant-wise count rates Data is divided into 100 sec bins |
 |
|
| Module-wise count rates for Quadrant A Data is divided into 100 sec bins |
 |
 |
| Module-wise count rates for Quadrant B Data is divided into 100 sec bins |
 |
 |
| Module-wise count rates for Quadrant C Data is divided into 100 sec bins |
 |
 |
| Module-wise count rates for Quadrant D Data is divided into 100 sec bins |
 |
 |
| Parameter | Plot |
|---|---|
| CZT HV Monitor |  |
| D_VDD |  |
| Temperature 1 |  |
| Veto HV Monitor |  |
| Veto LLD |  |
| Alpha Counter |  |
| _CPM_Rate |  |
| CZT Counter |  |
| +2.5 Volts monitor |  |
| +5 Volts monitor |  |
| _ROLL_ROT |  |
| _Roll_DEC |  |
| _Roll_RA |  |
| Veto Counter |  |