| Param | Original file | Final file |
|---|---|---|
| Filename | modeM0/AS1C05_019T04_9000003838_26513cztM0_level2.evt | modeM0/AS1C05_019T04_9000003838_26513cztM0_level2_quad_clean.evt |
| Size (bytes) | 383,878,080 | 82,370,880 |
| Size | 366.1 MB | 78.6 MB |
| Events in quadrant A | 2,102,492 | 568,602 |
| Events in quadrant B | 3,697,475 | 555,599 |
| Events in quadrant C | 2,291,850 | 544,212 |
| Events in quadrant D | 3,247,936 | 529,401 |
| Mode M9 | |||
|---|---|---|---|
| Quadrant | BADHDUFLAG | Total packets | Discarded packets |
| A | 0 | 10 | 0 |
| B | 0 | 10 | 0 |
| C | 0 | 10 | 0 |
| D | 0 | 10 | 0 |
| Mode M0 | |||
|---|---|---|---|
| Quadrant | BADHDUFLAG | Total packets | Discarded packets |
| A | 0 | 8896 | 0 |
| B | 0 | 13979 | 0 |
| C | 0 | 9349 | 0 |
| D | 0 | 12488 | 0 |
| Quadrant | Total seconds | Saturated seconds | Saturation percentage |
|---|---|---|---|
| A | 4210 | 45 | 1.068884% |
| B | 4210 | 176 | 4.180523% |
| C | 4210 | 75 | 1.781473% |
| D | 4210 | 284 | 6.745843% |
Noise dominated data is calculated using 1-second bins in cleaned event files. If a bin has >2000 counts, and if more than 50% of those come from <1% of pixels, then it is considered to be noise-dominated and hence unusable.
| Quadrant | # 1 sec bins | Bins with >0 counts | Bins with >2000 counts | High rate bins dominated by noise | Noise dominated (total time) | Noise dominated (detector-on time) | Marked lightcurve |
|---|---|---|---|---|---|---|---|
| A | 5205 | 4210 | 0 | 0 | 0.00% | 0.00% | 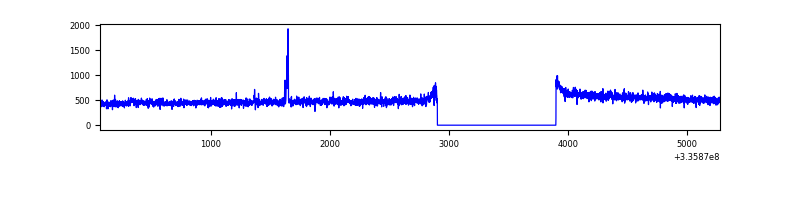 |
| B | 5205 | 4211 | 99 | 99 | 1.90% | 2.35% | 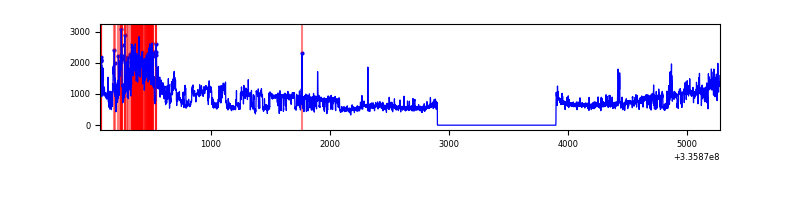 |
| C | 5205 | 4211 | 9 | 9 | 0.17% | 0.21% | 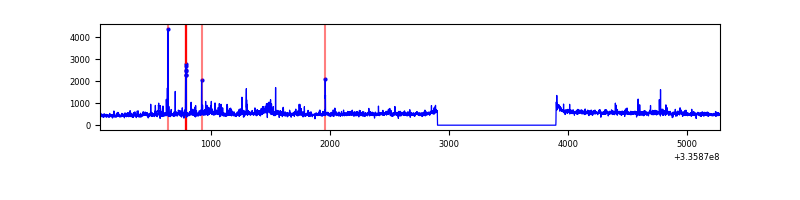 |
| D | 5205 | 4210 | 216 | 216 | 4.15% | 5.13% | 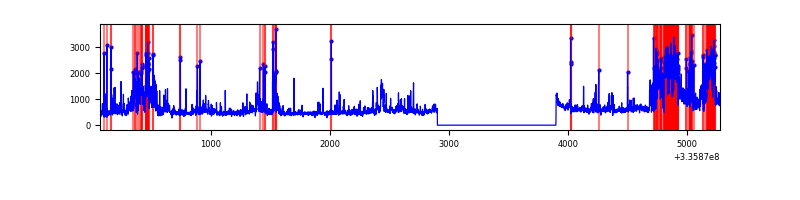 |
Top three noisy pixels from each quadrant. If the there are fewer than three noisy pixels in the level2.evt file, extra rows are filled as -1
| Pixel properties | Quadrant properties | ||||||
|---|---|---|---|---|---|---|---|
| Quadrant | DetID | PixID | Counts | Sigma | Mean | Median | Sigma |
| A | 6 | 16 | 74894 | 708.67 | 522 | 513 | 105.0 |
| A | 13 | 170 | 12754 | 116.63 | 522 | 513 | 105.0 |
| A | 13 | 254 | 6349 | 55.6 | 522 | 513 | 105.0 |
| B | 7 | 205 | 1012714 | 10381.34 | 513 | 501 | 97.5 |
| B | 0 | 189 | 641807 | 6577.29 | 513 | 501 | 97.5 |
| B | 0 | 190 | 14823 | 146.89 | 513 | 501 | 97.5 |
| C | 3 | 233 | 144991 | 1225.29 | 500 | 501 | 117.9 |
| C | 14 | 176 | 88480 | 746.07 | 500 | 501 | 117.9 |
| C | 14 | 238 | 79543 | 670.28 | 500 | 501 | 117.9 |
| D | 7 | 80 | 796984 | 6583.19 | 497 | 485 | 121.0 |
| D | 1 | 52 | 510601 | 4216.19 | 497 | 485 | 121.0 |
| D | 12 | 233 | 25918 | 210.21 | 497 | 485 | 121.0 |
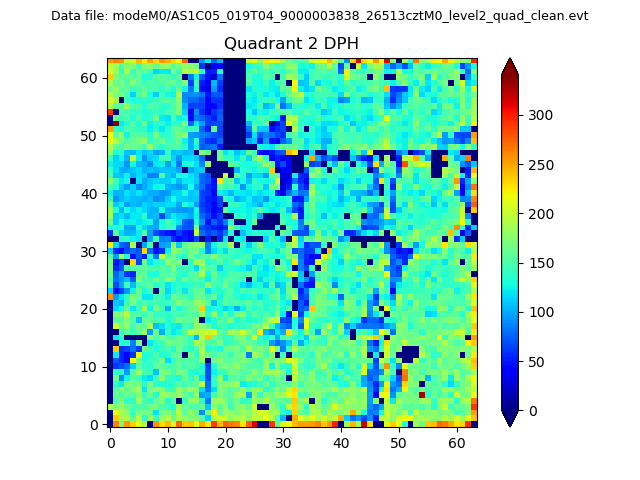
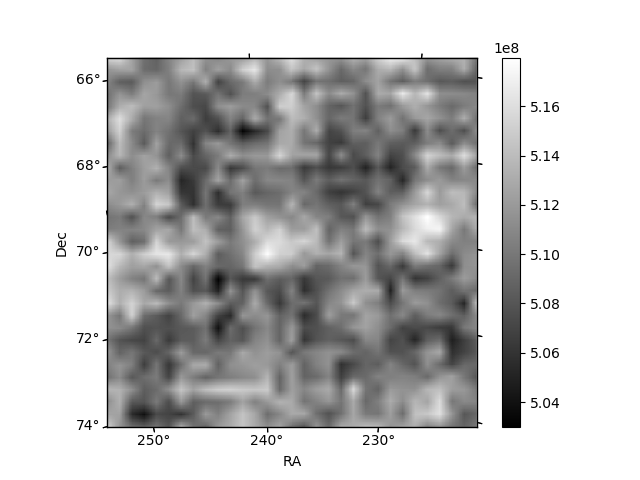
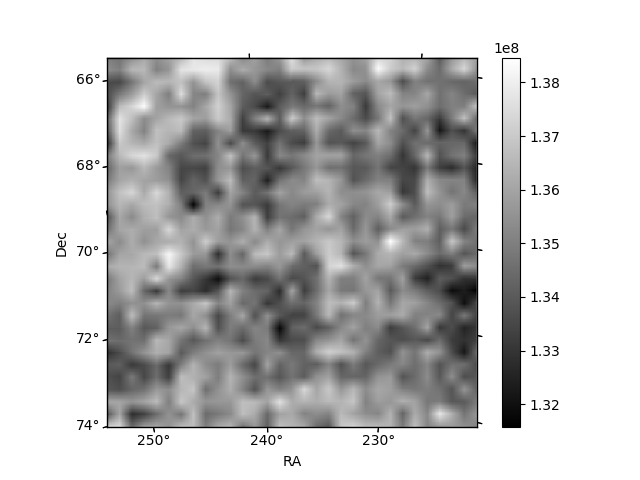
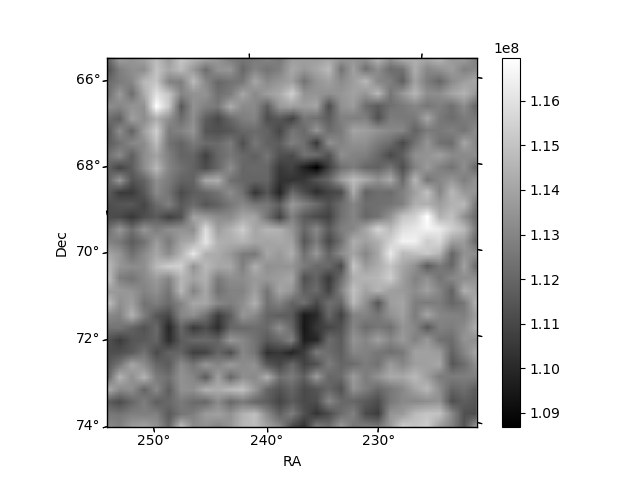
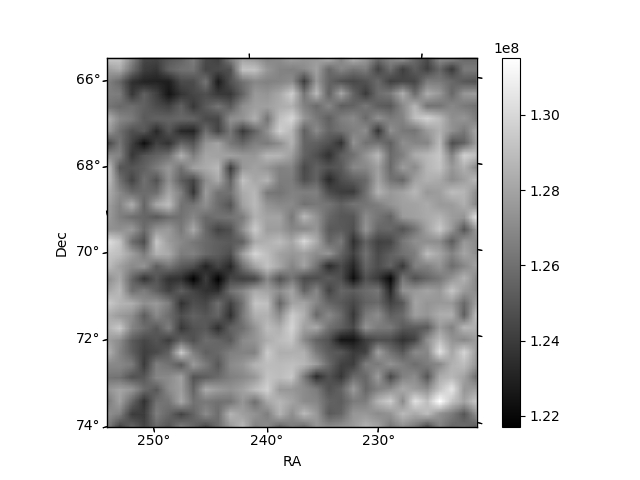
Histogram calculated using DETX and DETY for each event in the final _common_clean file
| Quadrant A | 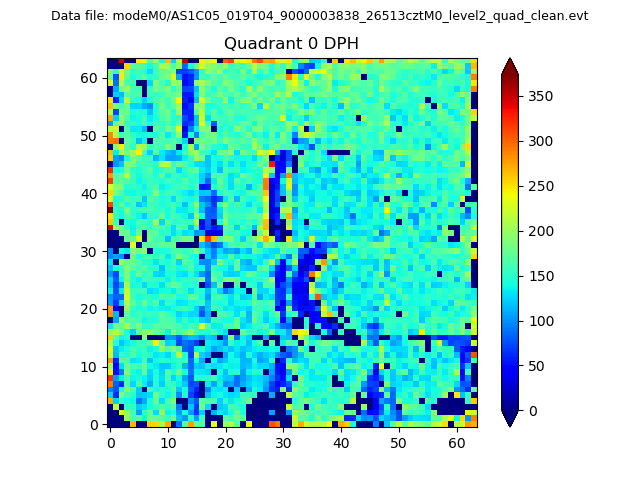 |
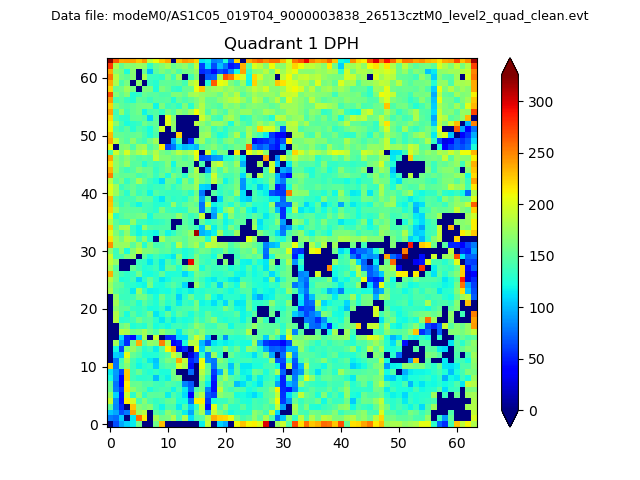 |
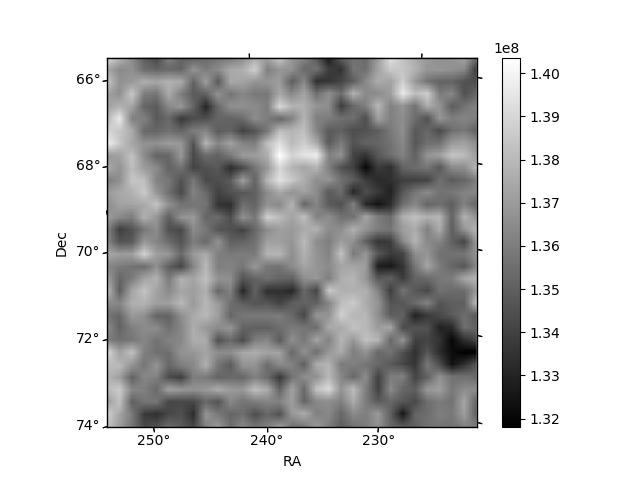
Quadrant B |
|---|---|---|---|
| Quadrant D | 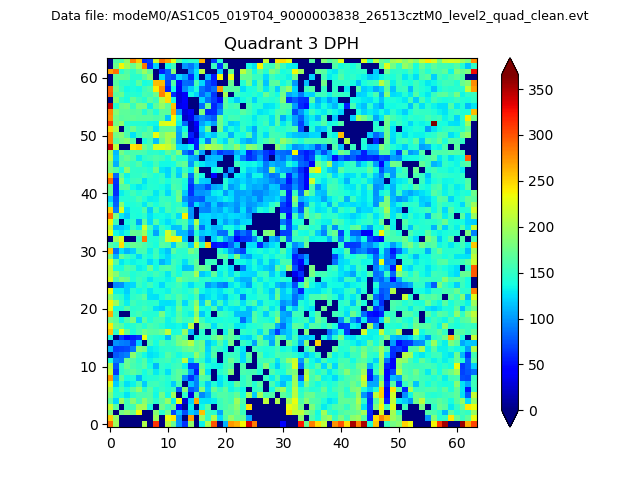 |
 |
Quadrant C |
| Plot type | Count rate plots | Images |
|---|---|---|
| Comparison with Poisson distribution Blue bars denote a histogram of data divided into 1 sec bins. Red curve is a Poisson curve with rate = median count rate of data. |
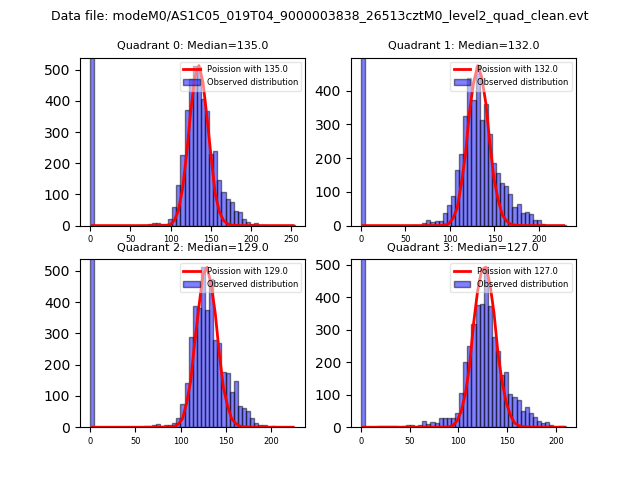 |
 |
| Quadrant-wise count rates Data is divided into 100 sec bins |
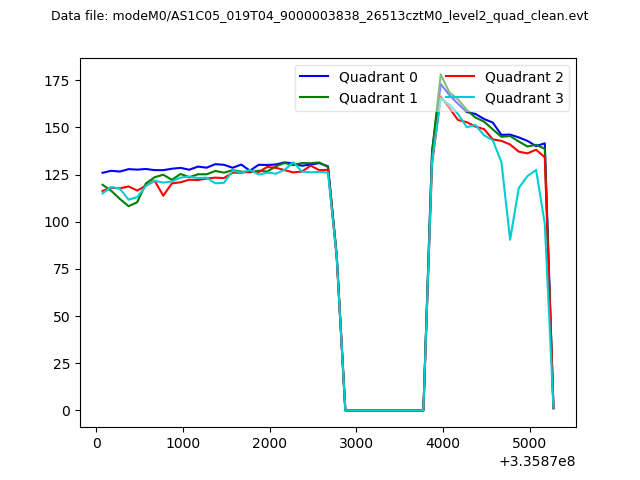 |
|
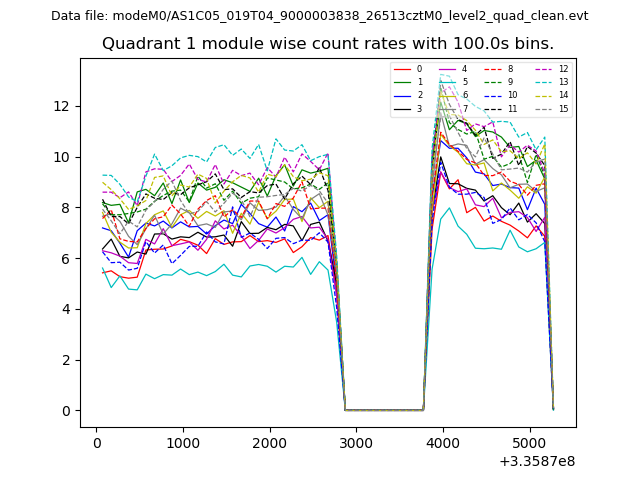
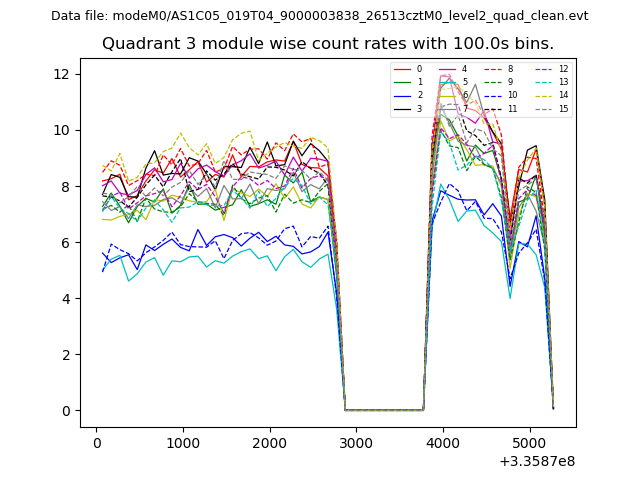
| Module-wise count rates for Quadrant A Data is divided into 100 sec bins |
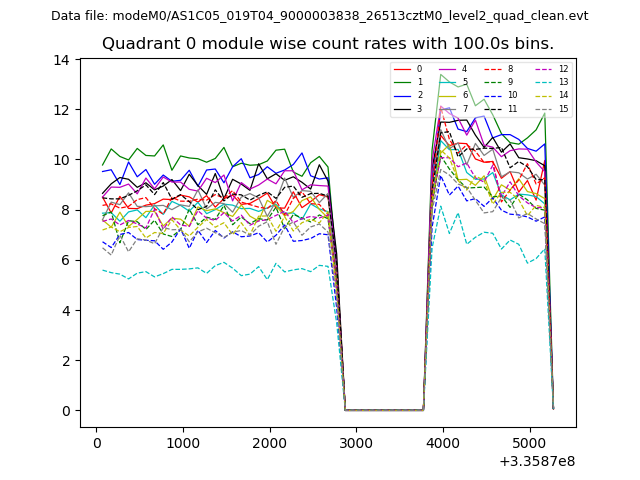 |
 |
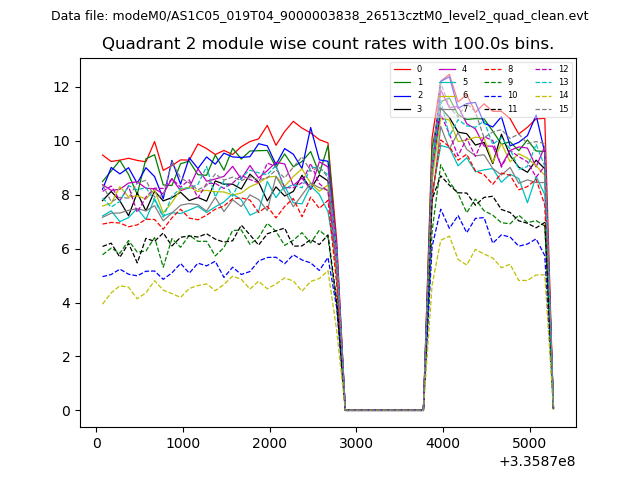
| Module-wise count rates for Quadrant B Data is divided into 100 sec bins |
 |
 |
| Module-wise count rates for Quadrant C Data is divided into 100 sec bins |
 |
 |
| Module-wise count rates for Quadrant D Data is divided into 100 sec bins |
 |
 |
| Parameter | Plot |
|---|---|
| CZT HV Monitor | 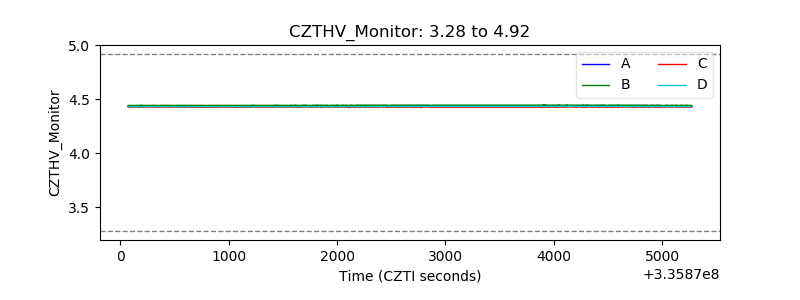 |
| D_VDD | 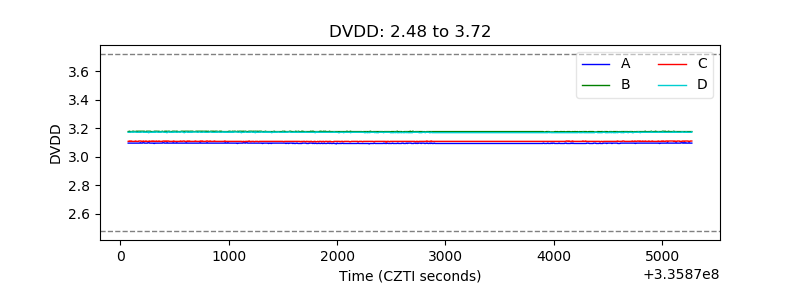 |
| Temperature 1 | 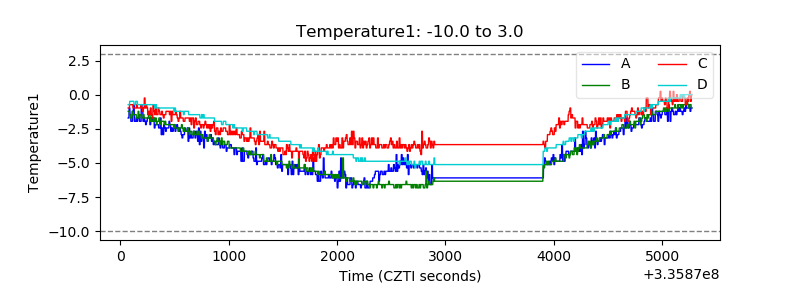 |
| Veto HV Monitor | 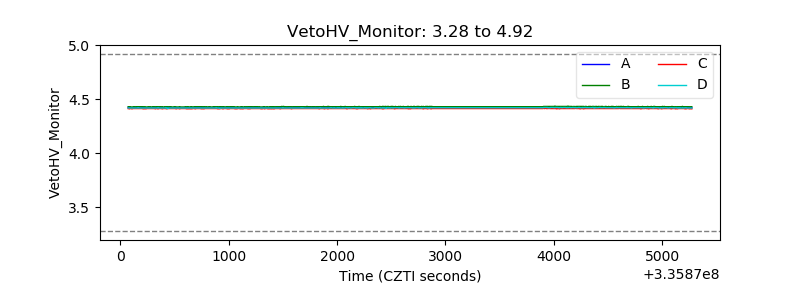 |
| Veto LLD | 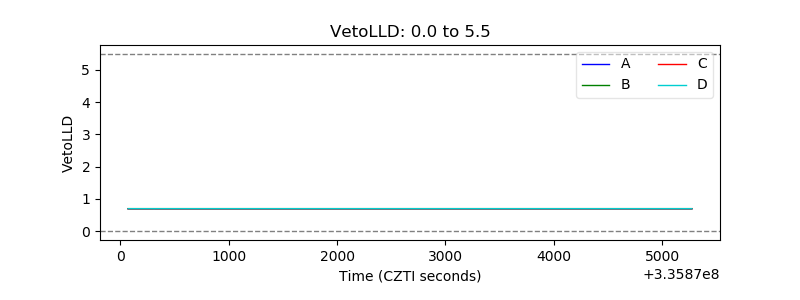 |
| Alpha Counter | 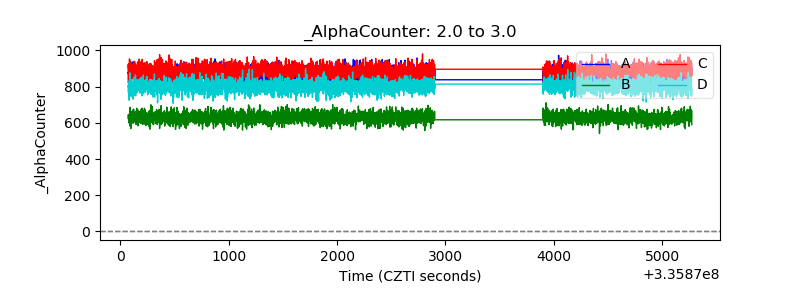 |
| _CPM_Rate | 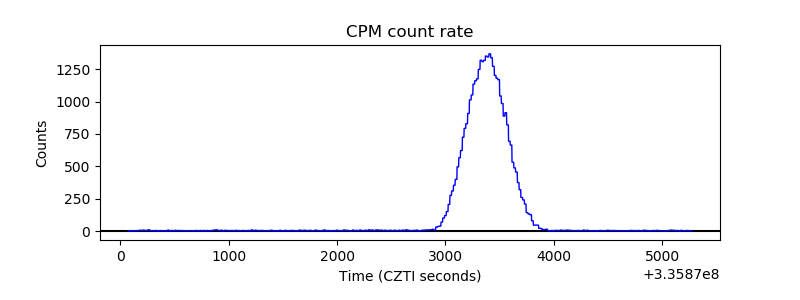 |
| CZT Counter | 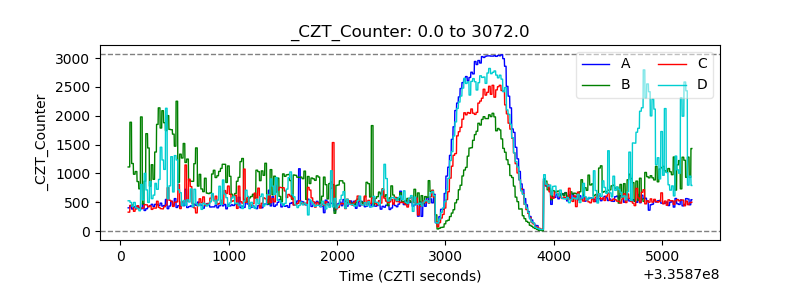 |
| +2.5 Volts monitor |  |
| +5 Volts monitor |  |
| _ROLL_ROT | 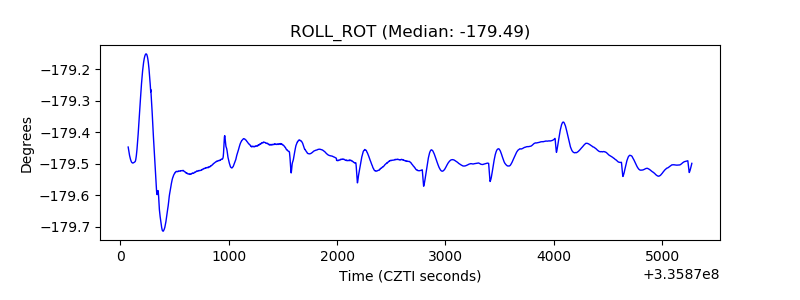 |
| _Roll_DEC | 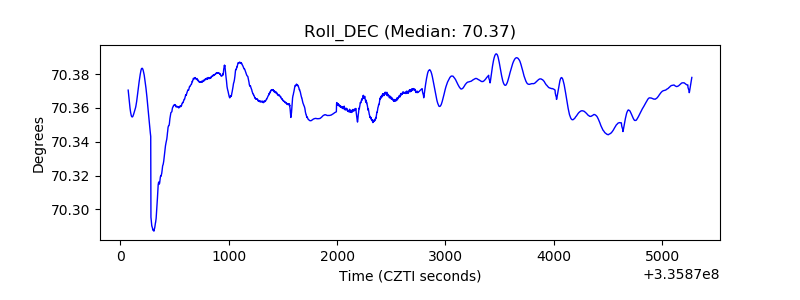 |
| _Roll_RA | 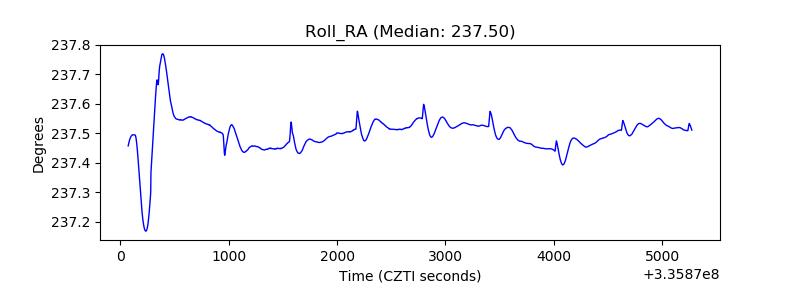 |
| Veto Counter | 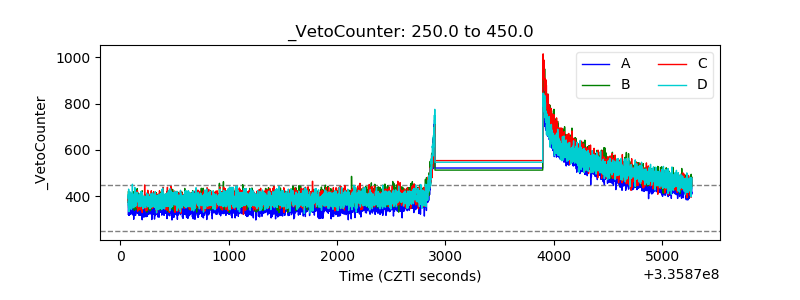 |