| Param | Original file | Final file |
|---|---|---|
| Filename | modeM0/AS1C05_019T04_9000003838_26515cztM0_level2.evt | modeM0/AS1C05_019T04_9000003838_26515cztM0_level2_quad_clean.evt |
| Size (bytes) | 685,589,760 | 124,211,520 |
| Size | 653.8 MB | 118.5 MB |
| Events in quadrant A | 3,162,848 | 877,987 |
| Events in quadrant B | 5,781,871 | 857,141 |
| Events in quadrant C | 3,518,799 | 833,388 |
| Events in quadrant D | 7,868,691 | 747,415 |
| Mode M9 | |||
|---|---|---|---|
| Quadrant | BADHDUFLAG | Total packets | Discarded packets |
| A | 0 | 12 | 0 |
| B | 0 | 12 | 0 |
| C | 0 | 12 | 0 |
| D | 0 | 12 | 0 |
| Mode M0 | |||
|---|---|---|---|
| Quadrant | BADHDUFLAG | Total packets | Discarded packets |
| A | 0 | 13560 | 0 |
| B | 0 | 21937 | 0 |
| C | 0 | 14432 | 0 |
| D | 0 | 27785 | 0 |
| Quadrant | Total seconds | Saturated seconds | Saturation percentage |
|---|---|---|---|
| A | 6385 | 29 | 0.454190% |
| B | 6385 | 96 | 1.503524% |
| C | 6385 | 79 | 1.237275% |
| D | 6386 | 1317 | 20.623238% |
Noise dominated data is calculated using 1-second bins in cleaned event files. If a bin has >2000 counts, and if more than 50% of those come from <1% of pixels, then it is considered to be noise-dominated and hence unusable.
| Quadrant | # 1 sec bins | Bins with >0 counts | Bins with >2000 counts | High rate bins dominated by noise | Noise dominated (total time) | Noise dominated (detector-on time) | Marked lightcurve |
|---|---|---|---|---|---|---|---|
| A | 7540 | 6386 | 0 | 0 | 0.00% | 0.00% | 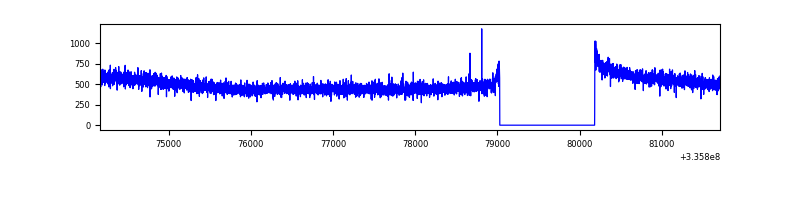 |
| B | 7540 | 6386 | 22 | 22 | 0.29% | 0.34% | 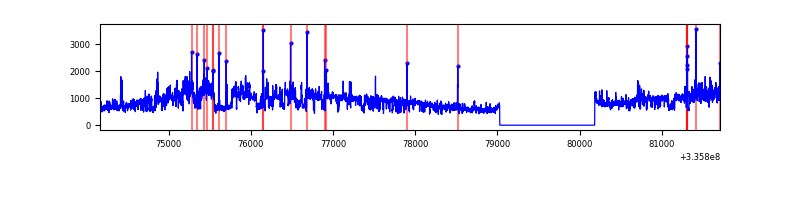 |
| C | 7540 | 6386 | 9 | 9 | 0.12% | 0.14% | 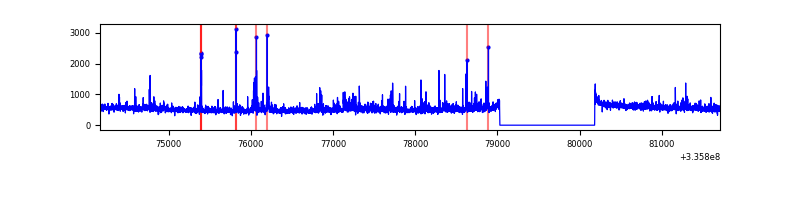 |
| D | 7540 | 6386 | 1261 | 1261 | 16.72% | 19.75% | 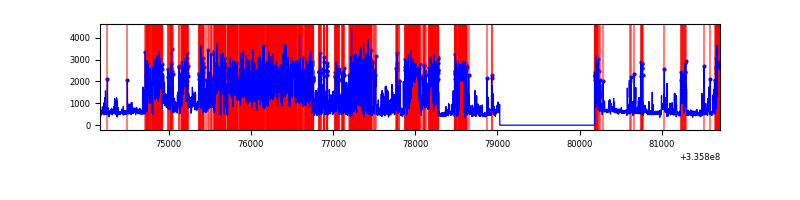 |
Top three noisy pixels from each quadrant. If the there are fewer than three noisy pixels in the level2.evt file, extra rows are filled as -1
| Pixel properties | Quadrant properties | ||||||
|---|---|---|---|---|---|---|---|
| Quadrant | DetID | PixID | Counts | Sigma | Mean | Median | Sigma |
| A | 6 | 16 | 13569 | 78.84 | 814 | 799 | 162.0 |
| A | 13 | 254 | 11059 | 63.34 | 814 | 799 | 162.0 |
| A | 0 | 13 | 8000 | 44.46 | 814 | 799 | 162.0 |
| B | 7 | 205 | 2065229 | 14172.39 | 795 | 777 | 145.7 |
| B | 0 | 189 | 461571 | 3163.33 | 795 | 777 | 145.7 |
| B | 5 | 172 | 39413 | 265.23 | 795 | 777 | 145.7 |
| C | 3 | 233 | 258766 | 1453.6 | 772 | 777 | 177.5 |
| C | 14 | 238 | 124670 | 698.05 | 772 | 777 | 177.5 |
| C | 14 | 176 | 95109 | 531.5 | 772 | 777 | 177.5 |
| D | 7 | 80 | 4206438 | 23846.09 | 731 | 711 | 176.4 |
| D | 1 | 52 | 721067 | 4084.35 | 731 | 711 | 176.4 |
| D | 12 | 233 | 104583 | 588.94 | 731 | 711 | 176.4 |
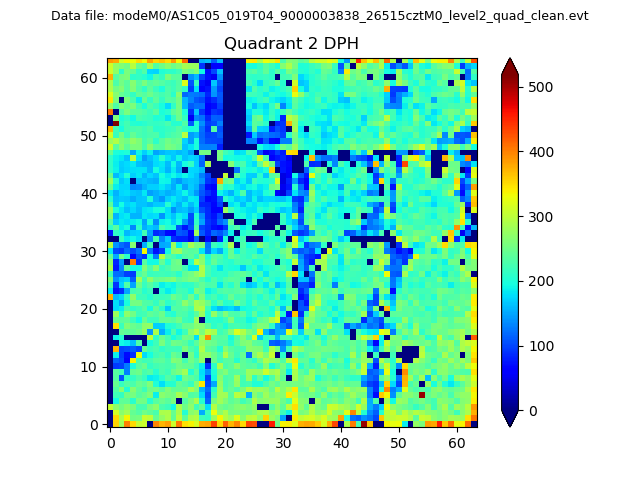
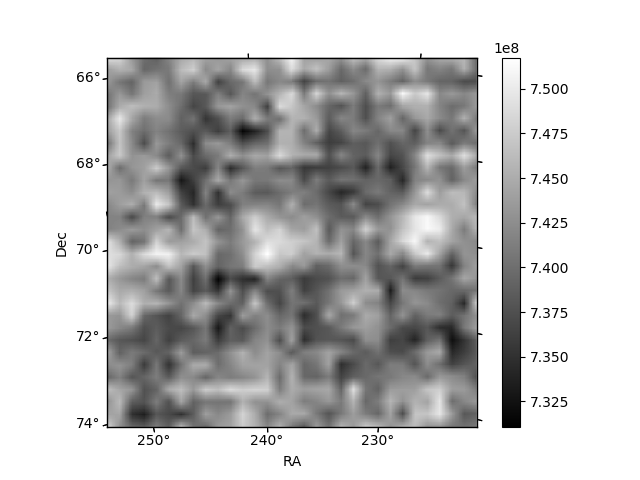
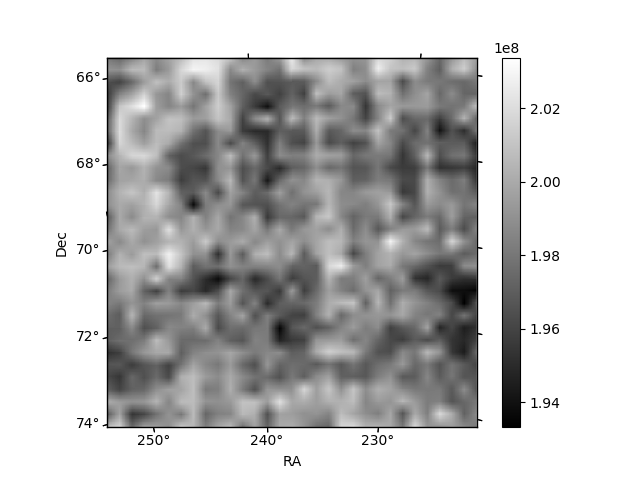
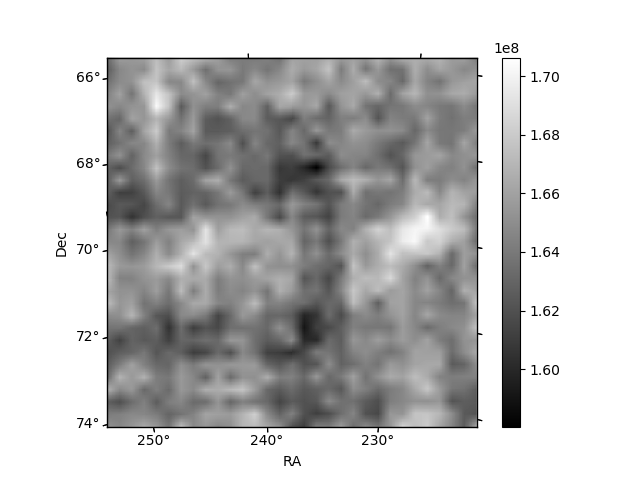
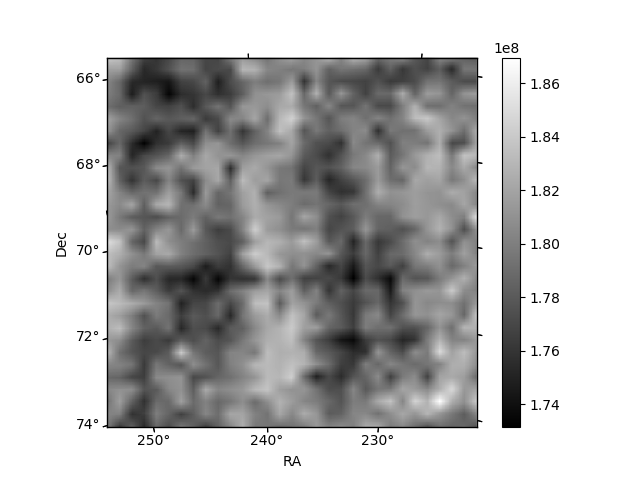
Histogram calculated using DETX and DETY for each event in the final _common_clean file
| Quadrant A | 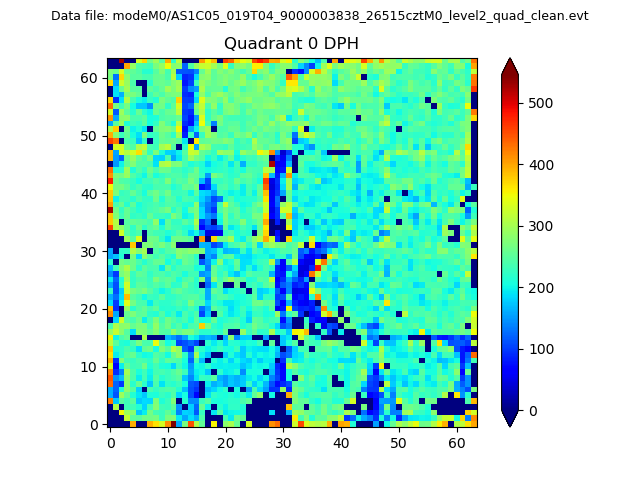 |
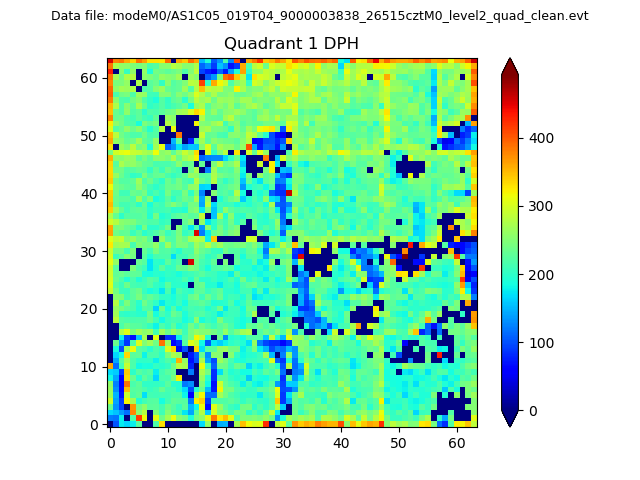 |
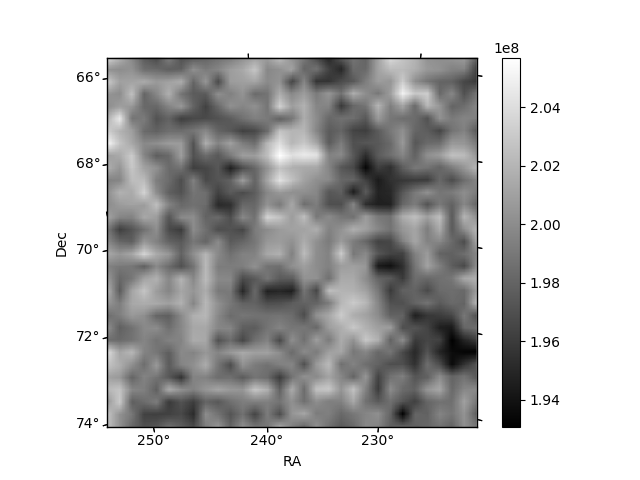
Quadrant B |
|---|---|---|---|
| Quadrant D | 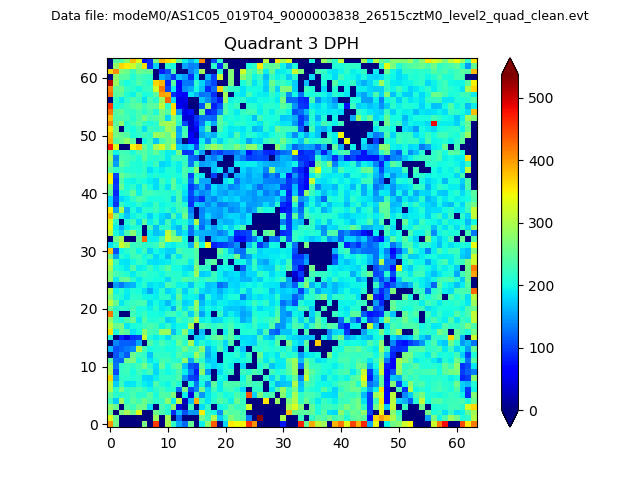 |
 |
Quadrant C |
| Plot type | Count rate plots | Images |
|---|---|---|
| Comparison with Poisson distribution Blue bars denote a histogram of data divided into 1 sec bins. Red curve is a Poisson curve with rate = median count rate of data. |
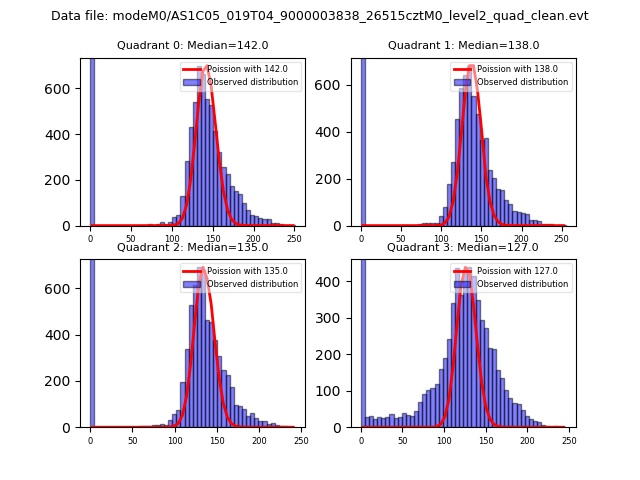 |
 |
| Quadrant-wise count rates Data is divided into 100 sec bins |
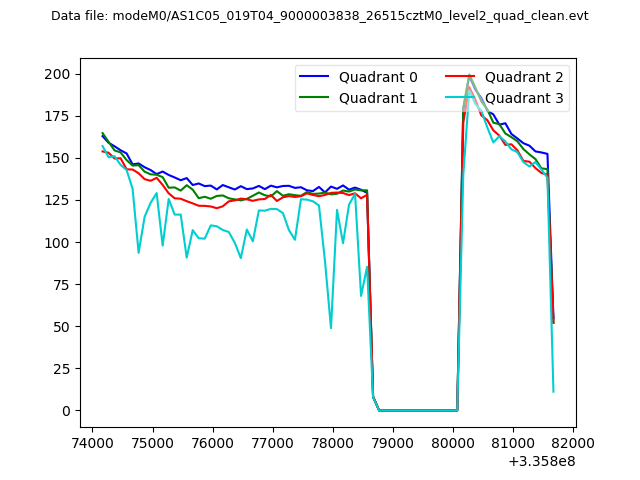 |
|
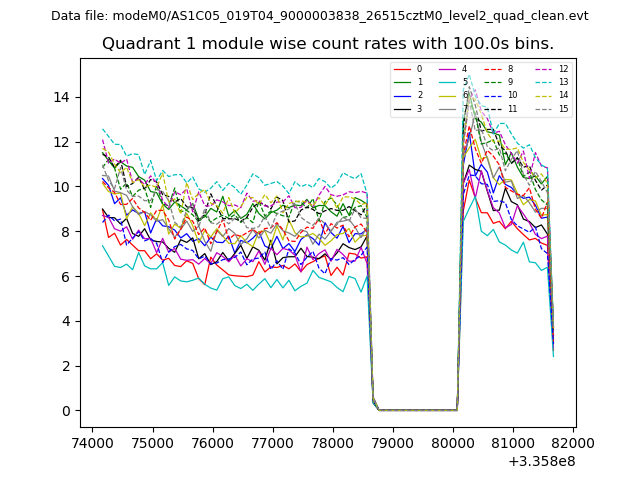
| Module-wise count rates for Quadrant A Data is divided into 100 sec bins |
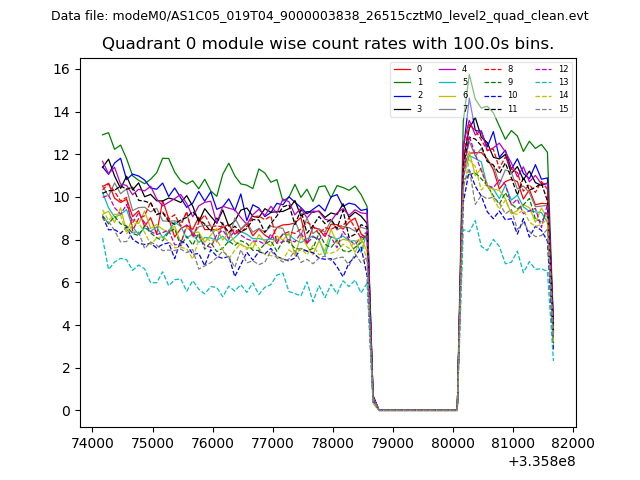 |
 |
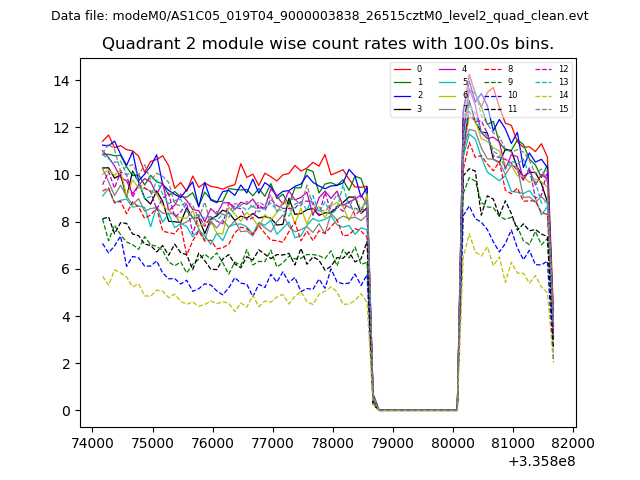
| Module-wise count rates for Quadrant B Data is divided into 100 sec bins |
 |
 |
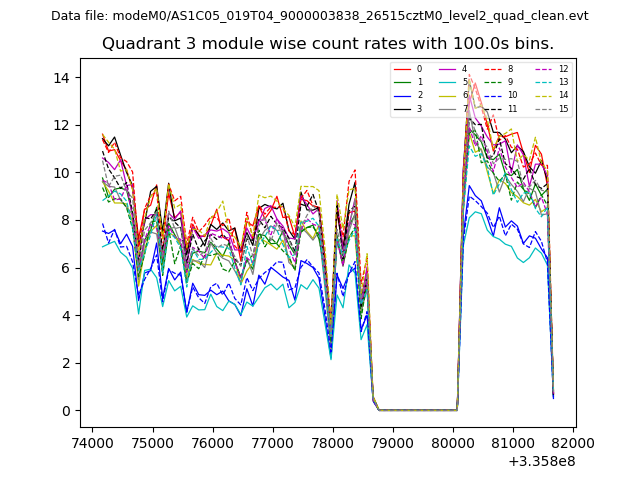
| Module-wise count rates for Quadrant C Data is divided into 100 sec bins |
 |
 |
| Module-wise count rates for Quadrant D Data is divided into 100 sec bins |
 |
 |
| Parameter | Plot |
|---|---|
| CZT HV Monitor | 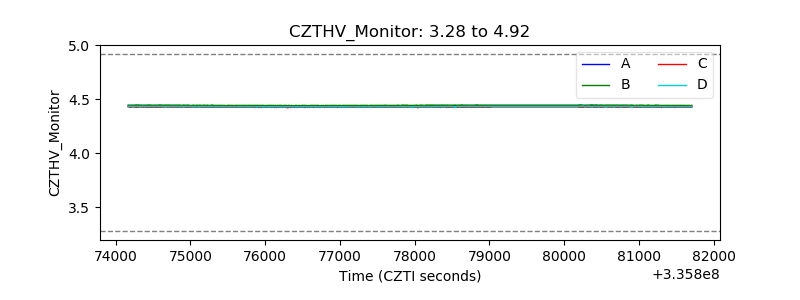 |
| D_VDD | 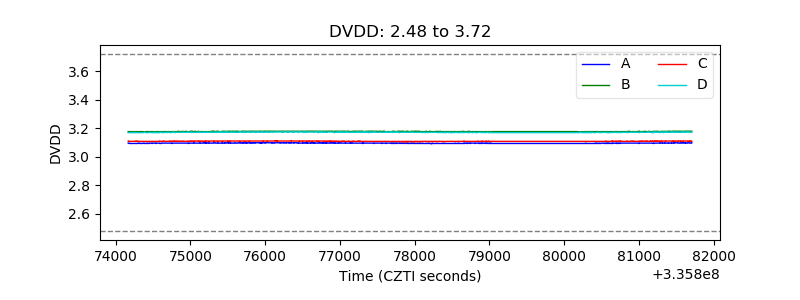 |
| Temperature 1 |  |
| Veto HV Monitor | 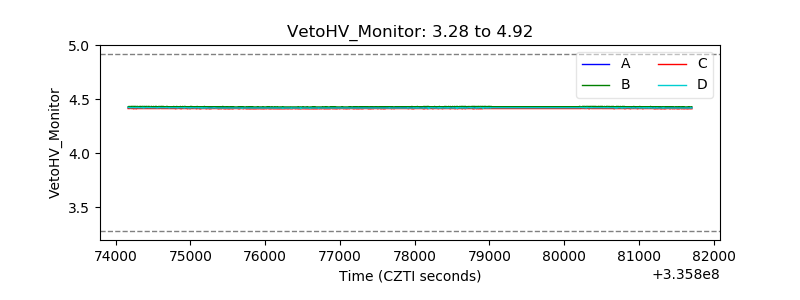 |
| Veto LLD | 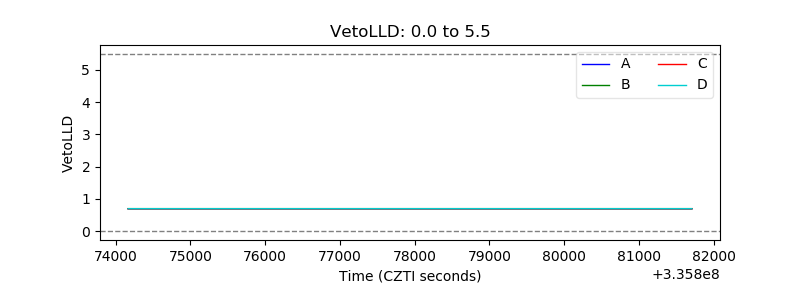 |
| Alpha Counter | 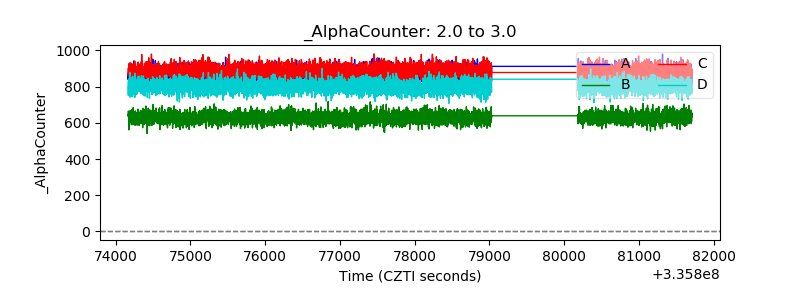 |
| _CPM_Rate | 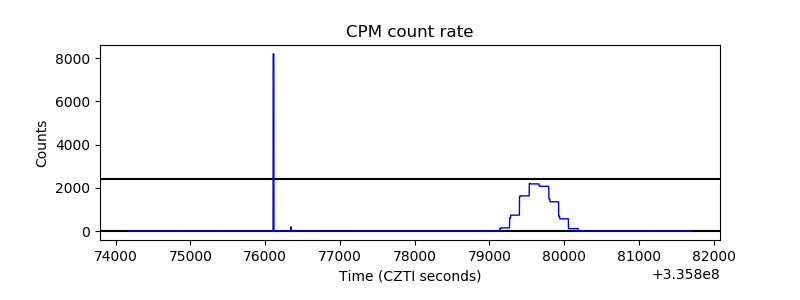 |
| CZT Counter | 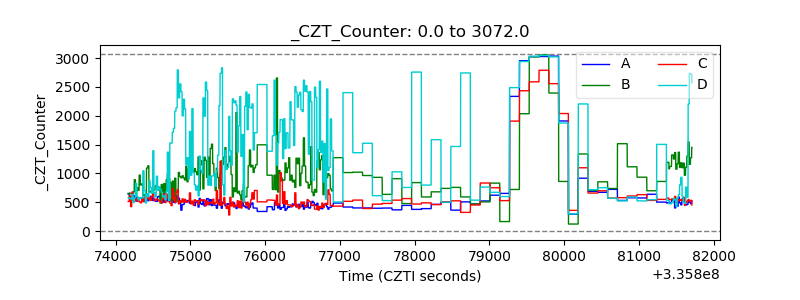 |
| +2.5 Volts monitor |  |
| +5 Volts monitor |  |
| _ROLL_ROT | 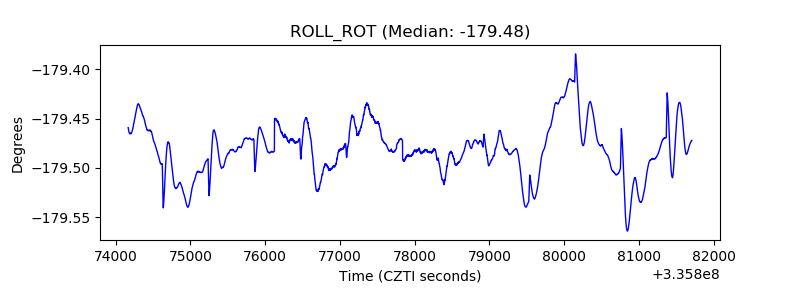 |
| _Roll_DEC | 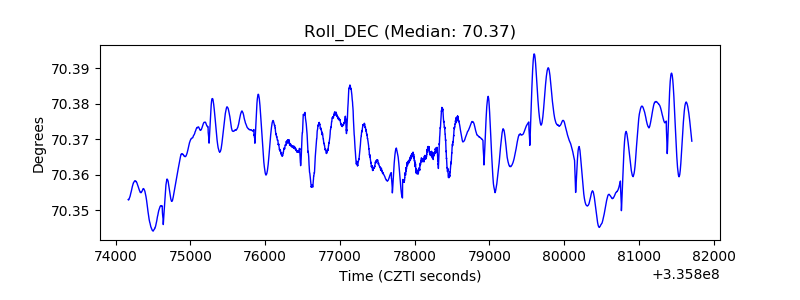 |
| _Roll_RA | 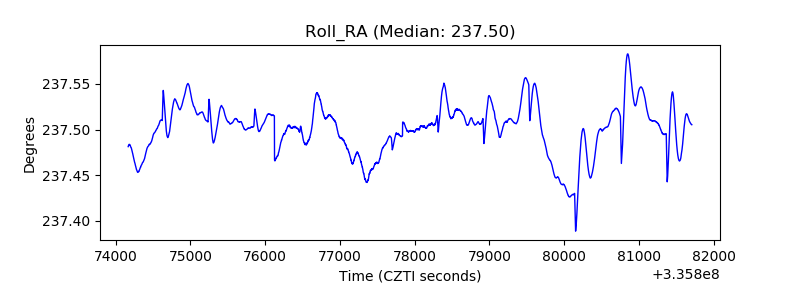 |
| Veto Counter | 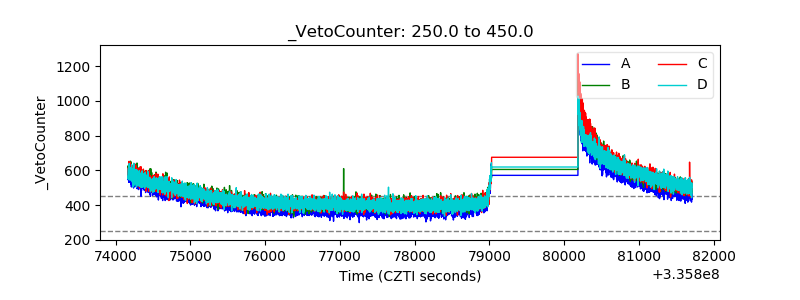 |