| Param | Original file | Final file |
|---|---|---|
| Filename | modeM0/AS1C05_019T04_9000003838_26516cztM0_level2.evt | modeM0/AS1C05_019T04_9000003838_26516cztM0_level2_quad_clean.evt |
| Size (bytes) | 632,283,840 | 107,354,880 |
| Size | 603.0 MB | 102.4 MB |
| Events in quadrant A | 2,888,577 | 776,538 |
| Events in quadrant B | 5,469,396 | 739,828 |
| Events in quadrant C | 3,067,509 | 741,022 |
| Events in quadrant D | 7,338,040 | 594,717 |
| Mode M9 | |||
|---|---|---|---|
| Quadrant | BADHDUFLAG | Total packets | Discarded packets |
| A | 0 | 12 | 0 |
| B | 0 | 12 | 0 |
| C | 0 | 12 | 0 |
| D | 0 | 12 | 0 |
| Mode M0 | |||
|---|---|---|---|
| Quadrant | BADHDUFLAG | Total packets | Discarded packets |
| A | 0 | 12290 | 0 |
| B | 0 | 20314 | 0 |
| C | 0 | 12623 | 0 |
| D | 0 | 25607 | 0 |
| Quadrant | Total seconds | Saturated seconds | Saturation percentage |
|---|---|---|---|
| A | 5699 | 48 | 0.842253% |
| B | 5699 | 304 | 5.334269% |
| C | 5699 | 77 | 1.351114% |
| D | 5699 | 1669 | 29.285840% |
Noise dominated data is calculated using 1-second bins in cleaned event files. If a bin has >2000 counts, and if more than 50% of those come from <1% of pixels, then it is considered to be noise-dominated and hence unusable.
| Quadrant | # 1 sec bins | Bins with >0 counts | Bins with >2000 counts | High rate bins dominated by noise | Noise dominated (total time) | Noise dominated (detector-on time) | Marked lightcurve |
|---|---|---|---|---|---|---|---|
| A | 6949 | 5699 | 0 | 0 | 0.00% | 0.00% | 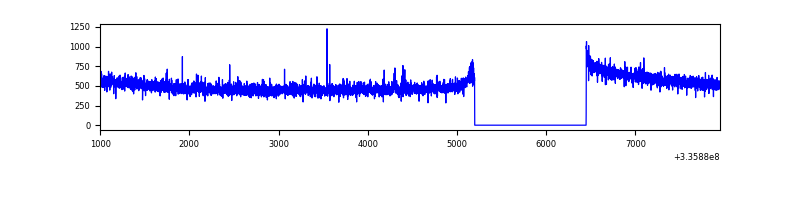 |
| B | 6949 | 5700 | 199 | 199 | 2.86% | 3.49% | 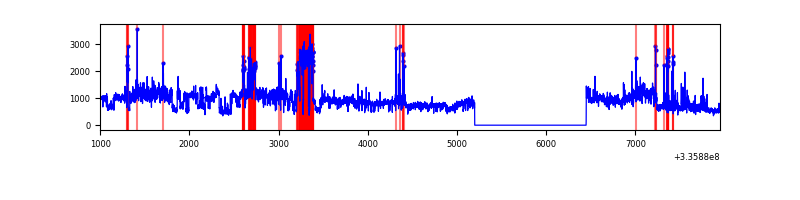 |
| C | 6949 | 5699 | 3 | 3 | 0.04% | 0.05% | 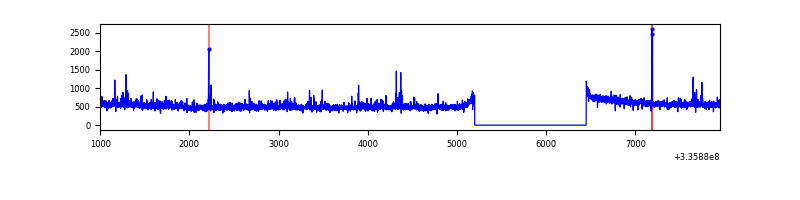 |
| D | 6948 | 5698 | 1425 | 1425 | 20.51% | 25.01% | 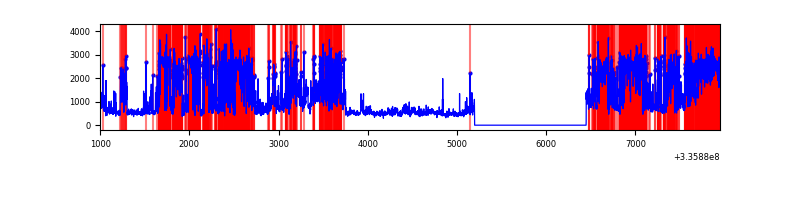 |
Top three noisy pixels from each quadrant. If the there are fewer than three noisy pixels in the level2.evt file, extra rows are filled as -1
| Pixel properties | Quadrant properties | ||||||
|---|---|---|---|---|---|---|---|
| Quadrant | DetID | PixID | Counts | Sigma | Mean | Median | Sigma |
| A | 0 | 13 | 26539 | 177.6 | 741 | 729 | 145.3 |
| A | 13 | 254 | 9538 | 60.62 | 741 | 729 | 145.3 |
| A | 0 | 226 | 6482 | 39.59 | 741 | 729 | 145.3 |
| B | 7 | 205 | 1460820 | 11225.27 | 714 | 698 | 130.1 |
| B | 0 | 189 | 1018880 | 7827.68 | 714 | 698 | 130.1 |
| B | 5 | 172 | 82029 | 625.26 | 714 | 698 | 130.1 |
| C | 3 | 233 | 145014 | 879.69 | 712 | 718 | 164.0 |
| C | 14 | 238 | 114073 | 691.06 | 712 | 718 | 164.0 |
| C | 14 | 176 | 15828 | 92.12 | 712 | 718 | 164.0 |
| D | 7 | 80 | 4047180 | 27413.9 | 618 | 605 | 147.6 |
| D | 1 | 52 | 861718 | 5833.69 | 618 | 605 | 147.6 |
| D | 2 | 234 | 23918 | 157.94 | 618 | 605 | 147.6 |
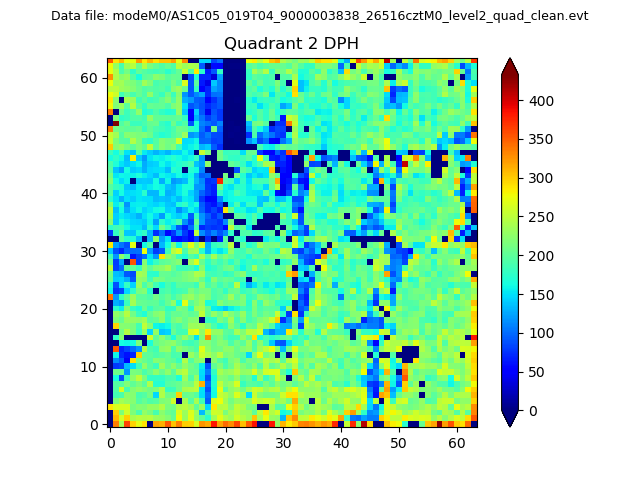
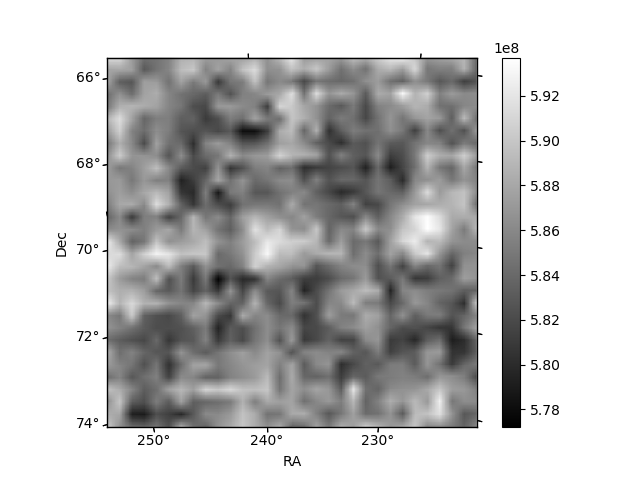
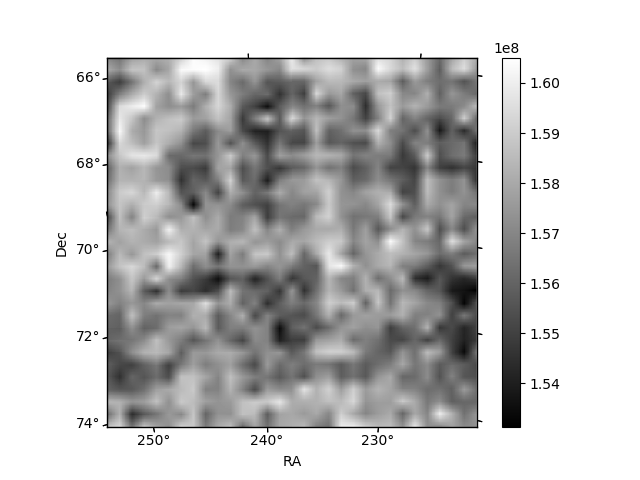
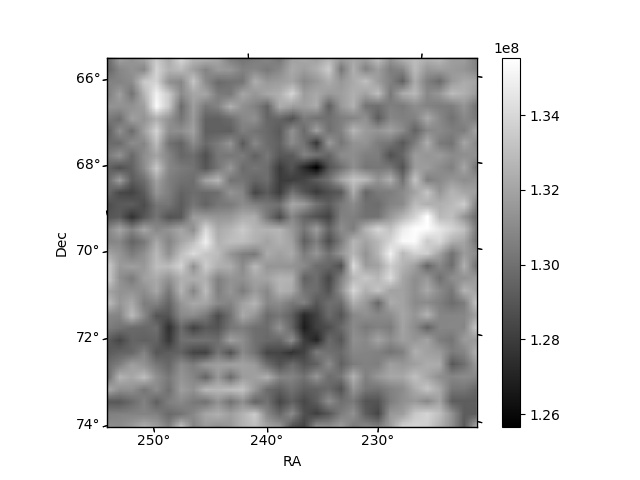
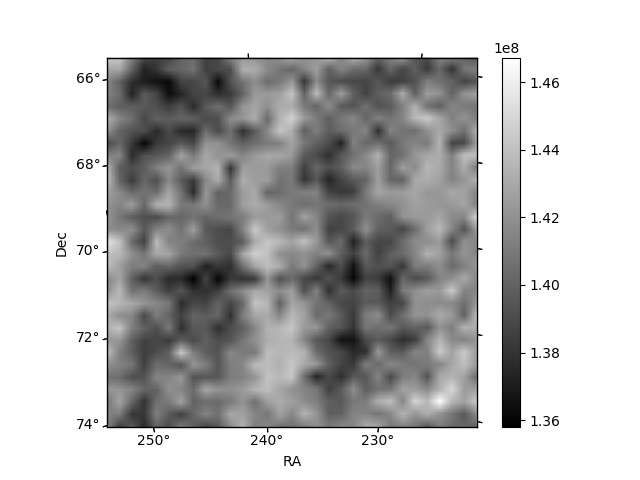
Histogram calculated using DETX and DETY for each event in the final _common_clean file
| Quadrant A | 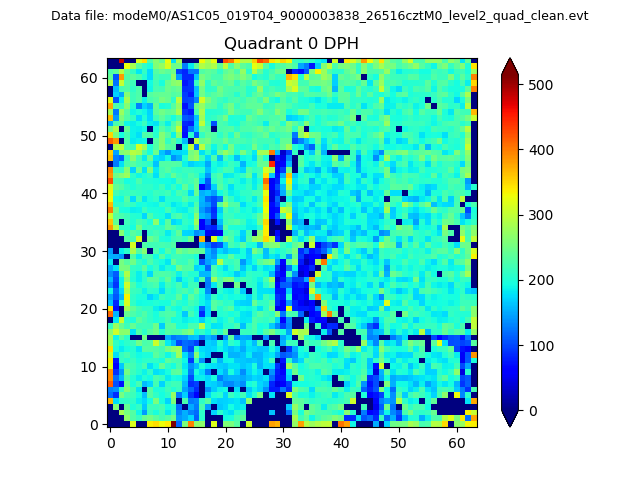 |
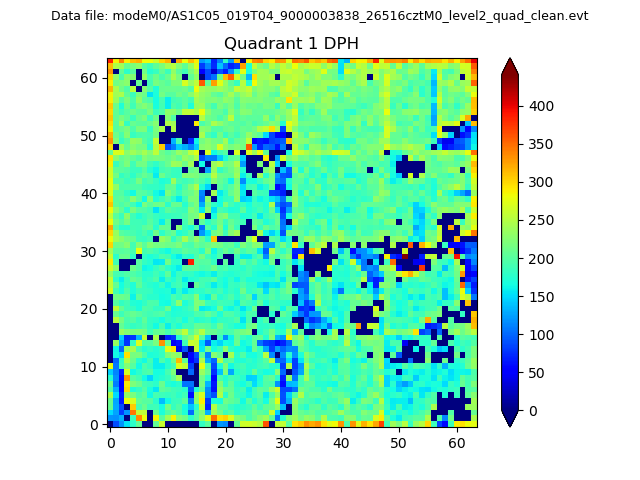 |
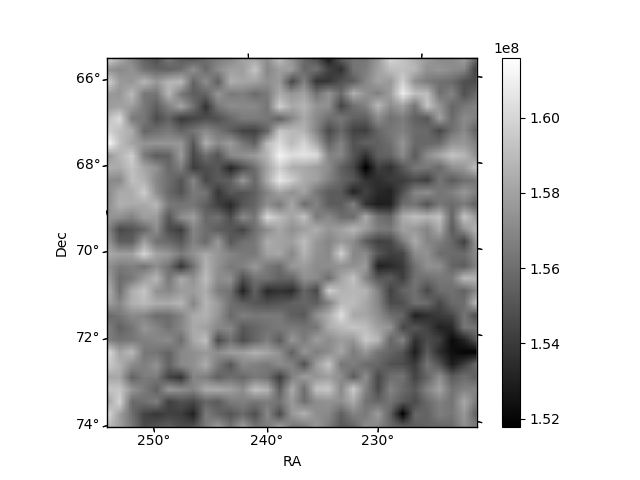
Quadrant B |
|---|---|---|---|
| Quadrant D | 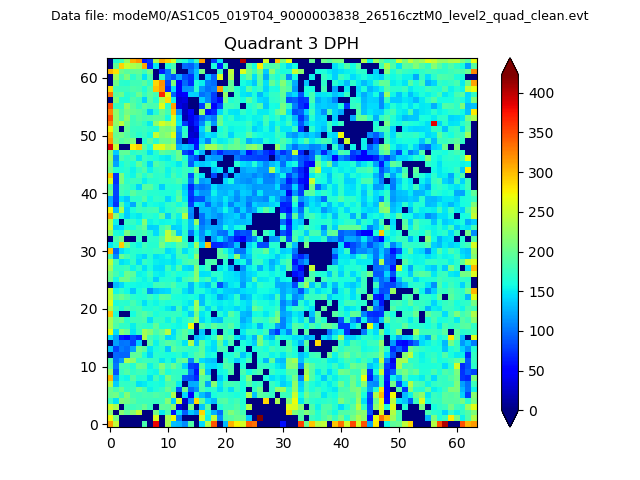 |
 |
Quadrant C |
| Plot type | Count rate plots | Images |
|---|---|---|
| Comparison with Poisson distribution Blue bars denote a histogram of data divided into 1 sec bins. Red curve is a Poisson curve with rate = median count rate of data. |
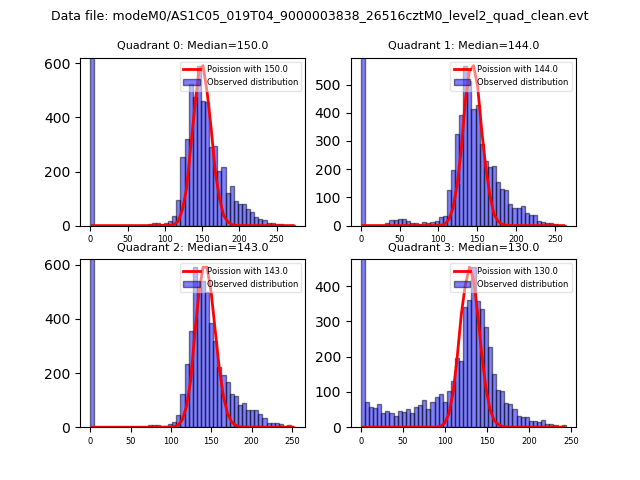 |
 |
| Quadrant-wise count rates Data is divided into 100 sec bins |
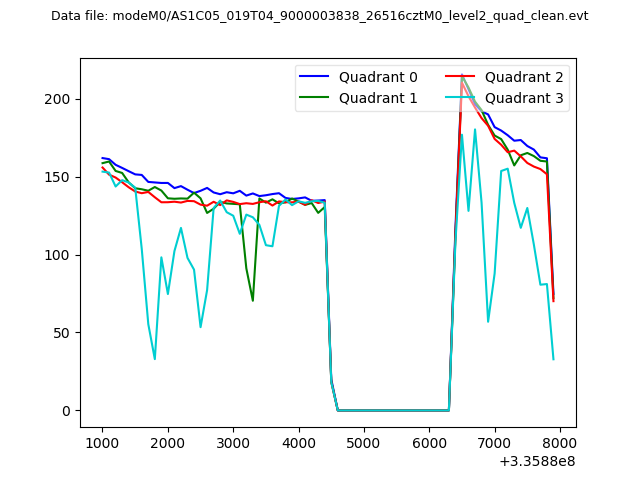 |
|
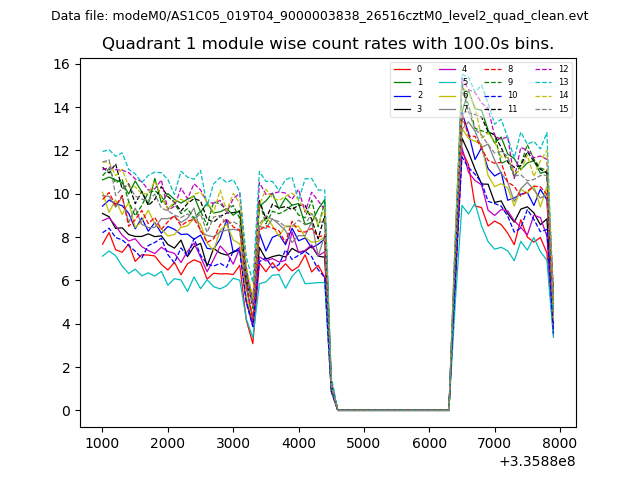
| Module-wise count rates for Quadrant A Data is divided into 100 sec bins |
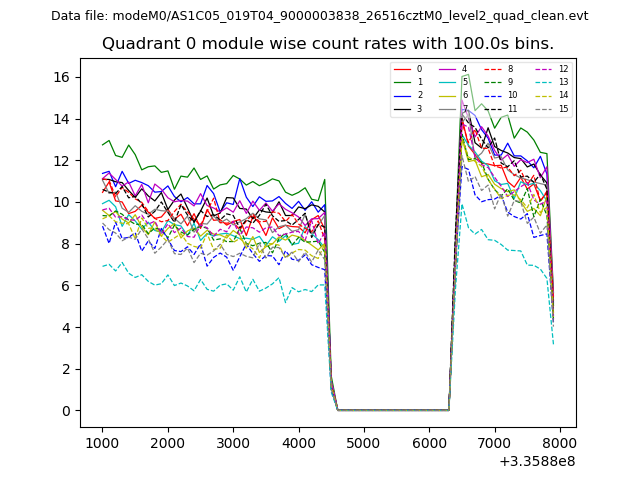 |
 |
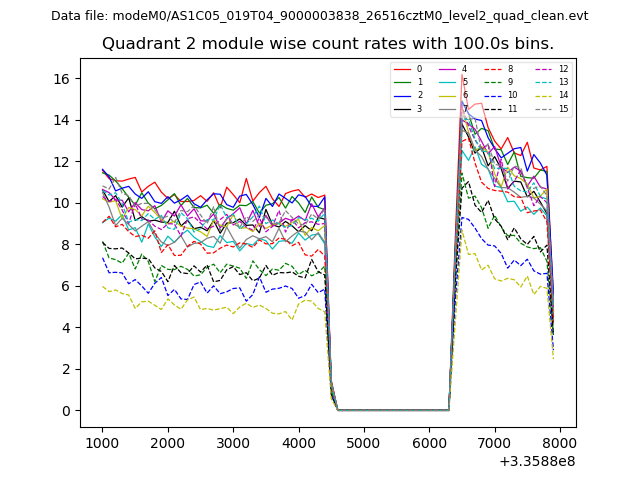
| Module-wise count rates for Quadrant B Data is divided into 100 sec bins |
 |
 |
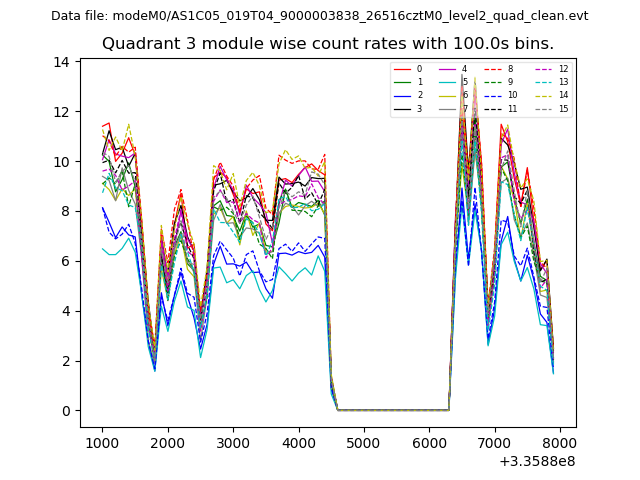
| Module-wise count rates for Quadrant C Data is divided into 100 sec bins |
 |
 |
| Module-wise count rates for Quadrant D Data is divided into 100 sec bins |
 |
 |
| Parameter | Plot |
|---|---|
| CZT HV Monitor | 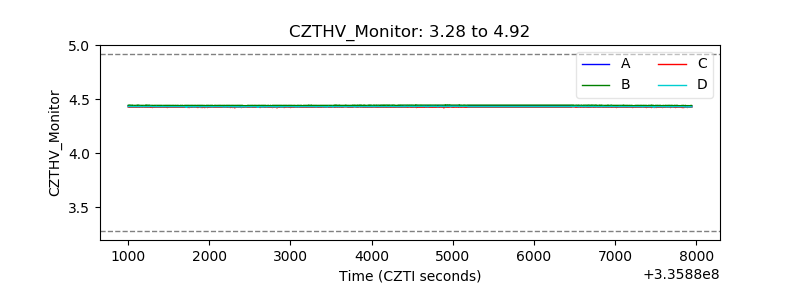 |
| D_VDD | 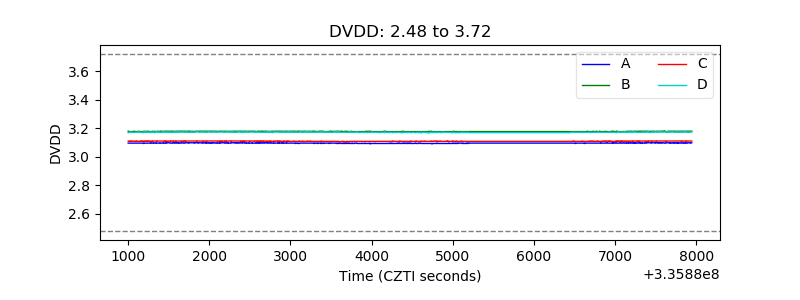 |
| Temperature 1 | 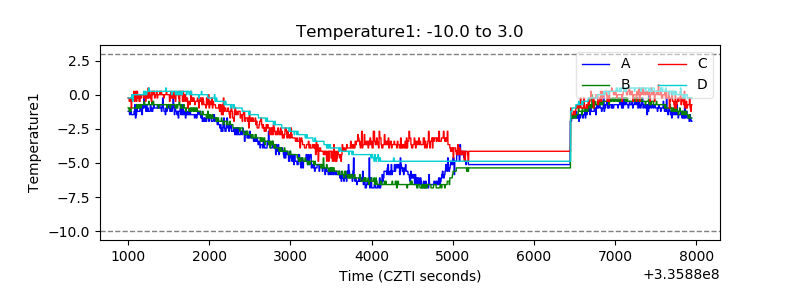 |
| Veto HV Monitor | 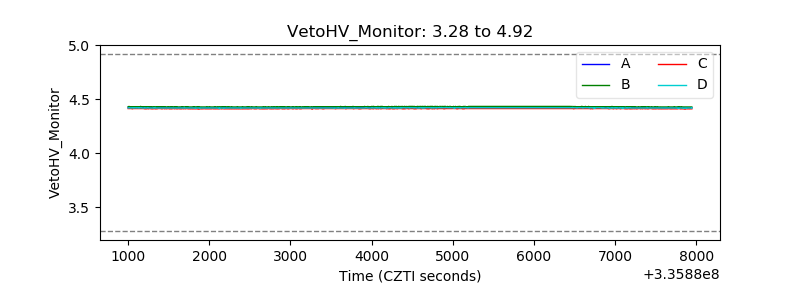 |
| Veto LLD | 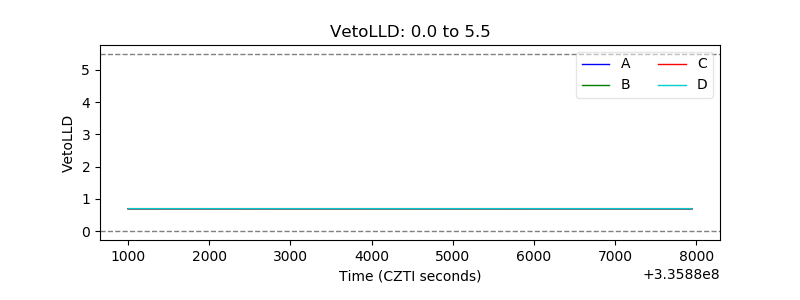 |
| Alpha Counter | 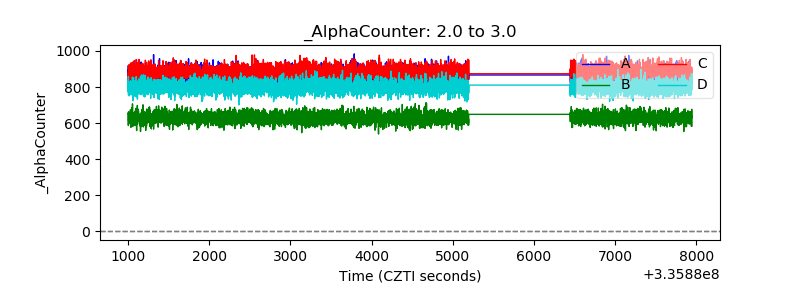 |
| _CPM_Rate | 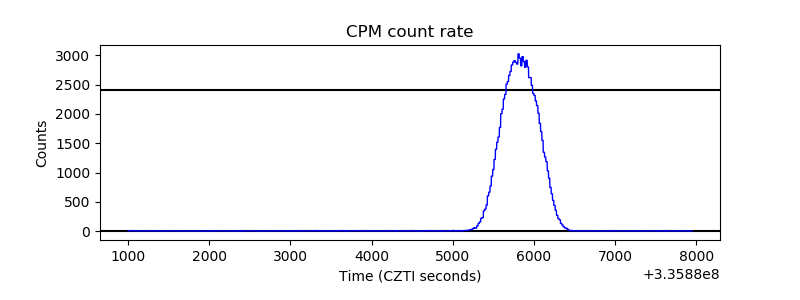 |
| CZT Counter | 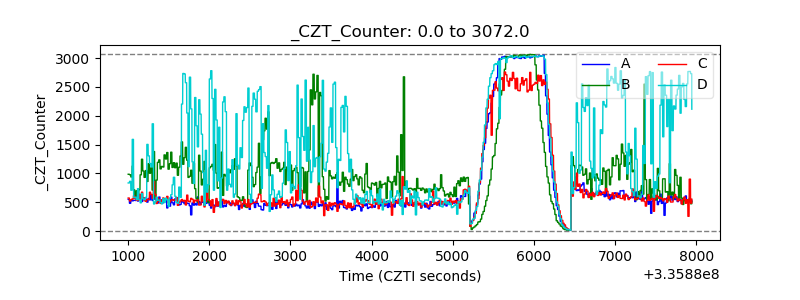 |
| +2.5 Volts monitor |  |
| +5 Volts monitor |  |
| _ROLL_ROT | 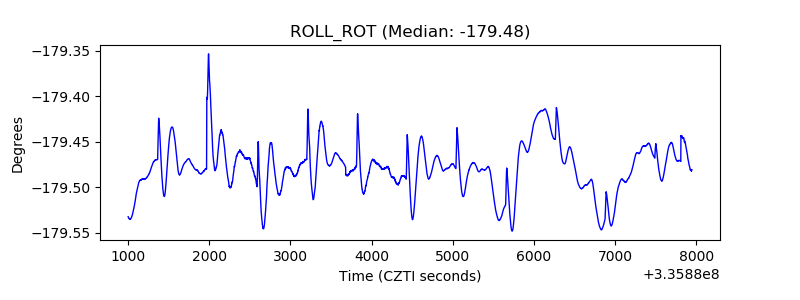 |
| _Roll_DEC | 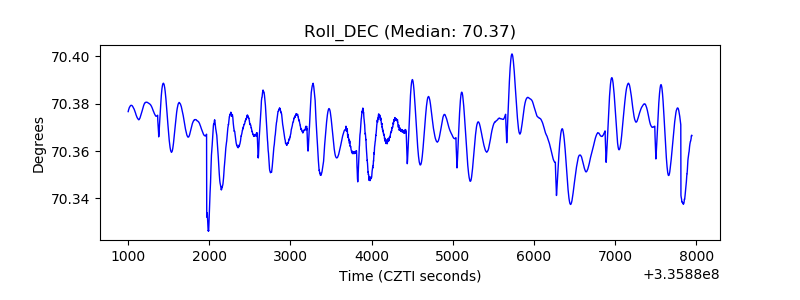 |
| _Roll_RA | 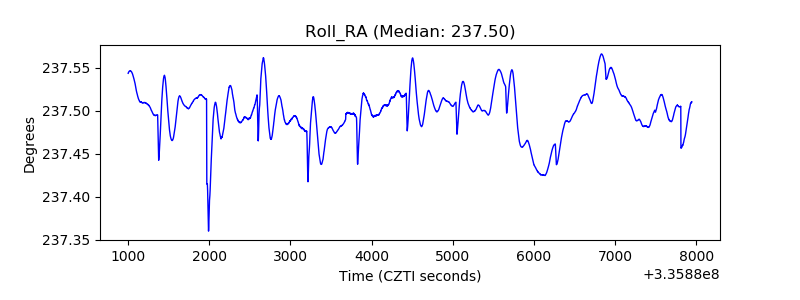 |
| Veto Counter | 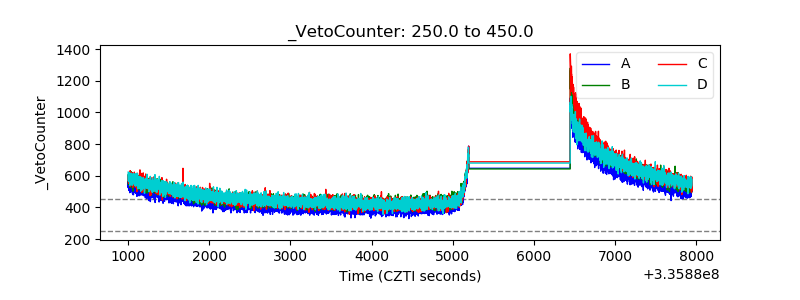 |