| Param | Original file | Final file |
|---|---|---|
| Filename | modeM0/AS1C05_019T04_9000003838_26517cztM0_level2.evt | modeM0/AS1C05_019T04_9000003838_26517cztM0_level2_quad_clean.evt |
| Size (bytes) | 747,679,680 | 114,301,440 |
| Size | 713.0 MB | 109.0 MB |
| Events in quadrant A | 3,177,535 | 860,180 |
| Events in quadrant B | 3,852,460 | 854,879 |
| Events in quadrant C | 3,385,194 | 832,575 |
| Events in quadrant D | 11,815,797 | 486,494 |
| Mode M9 | |||
|---|---|---|---|
| Quadrant | BADHDUFLAG | Total packets | Discarded packets |
| A | 0 | 14 | 0 |
| B | 0 | 14 | 0 |
| C | 0 | 14 | 0 |
| D | 0 | 14 | 0 |
| Mode M0 | |||
|---|---|---|---|
| Quadrant | BADHDUFLAG | Total packets | Discarded packets |
| A | 0 | 13409 | 0 |
| B | 0 | 15523 | 0 |
| C | 0 | 13962 | 0 |
| D | 0 | 39301 | 0 |
| Quadrant | Total seconds | Saturated seconds | Saturation percentage |
|---|---|---|---|
| A | 6109 | 55 | 0.900311% |
| B | 6110 | 103 | 1.685761% |
| C | 6110 | 102 | 1.669394% |
| D | 6110 | 3750 | 61.374795% |
Noise dominated data is calculated using 1-second bins in cleaned event files. If a bin has >2000 counts, and if more than 50% of those come from <1% of pixels, then it is considered to be noise-dominated and hence unusable.
| Quadrant | # 1 sec bins | Bins with >0 counts | Bins with >2000 counts | High rate bins dominated by noise | Noise dominated (total time) | Noise dominated (detector-on time) | Marked lightcurve |
|---|---|---|---|---|---|---|---|
| A | 7444 | 6109 | 0 | 0 | 0.00% | 0.00% | 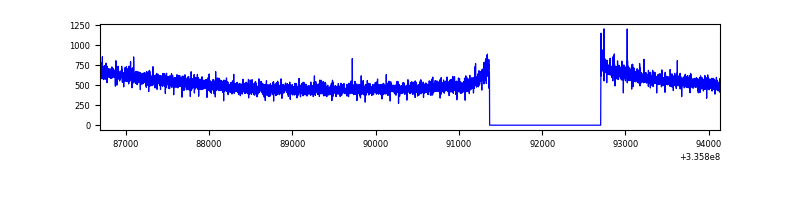 |
| B | 7445 | 6111 | 26 | 26 | 0.35% | 0.43% | 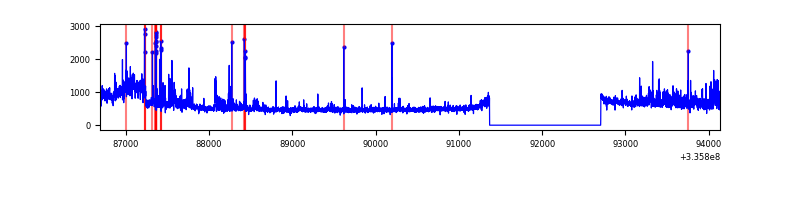 |
| C | 7445 | 6111 | 5 | 5 | 0.07% | 0.08% | 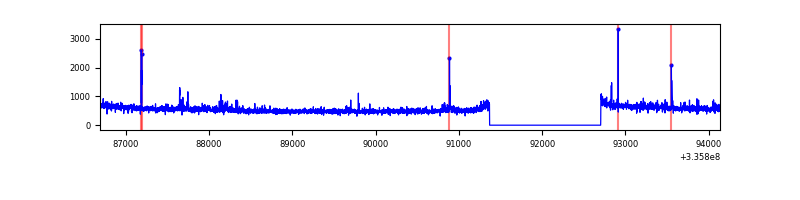 |
| D | 7444 | 6109 | 3461 | 3461 | 46.49% | 56.65% | 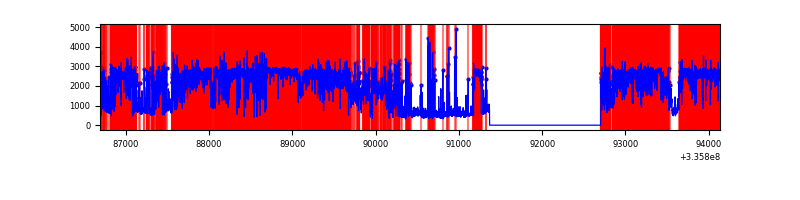 |
Top three noisy pixels from each quadrant. If the there are fewer than three noisy pixels in the level2.evt file, extra rows are filled as -1
| Pixel properties | Quadrant properties | ||||||
|---|---|---|---|---|---|---|---|
| Quadrant | DetID | PixID | Counts | Sigma | Mean | Median | Sigma |
| A | 13 | 254 | 10767 | 62.26 | 821 | 807 | 160.0 |
| A | 0 | 226 | 7292 | 40.54 | 821 | 807 | 160.0 |
| A | 0 | 13 | 7055 | 39.06 | 821 | 807 | 160.0 |
| B | 0 | 189 | 435522 | 2955.15 | 809 | 790 | 147.1 |
| B | 5 | 172 | 95986 | 647.11 | 809 | 790 | 147.1 |
| B | 0 | 245 | 58406 | 391.65 | 809 | 790 | 147.1 |
| C | 14 | 238 | 128406 | 702.01 | 796 | 803 | 181.8 |
| C | 3 | 233 | 118957 | 650.03 | 796 | 803 | 181.8 |
| C | 0 | 207 | 25287 | 134.7 | 796 | 803 | 181.8 |
| D | 7 | 80 | 7339087 | 54566.56 | 556 | 543 | 134.5 |
| D | 1 | 52 | 2256038 | 16770.98 | 556 | 543 | 134.5 |
| D | 12 | 233 | 70120 | 517.34 | 556 | 543 | 134.5 |
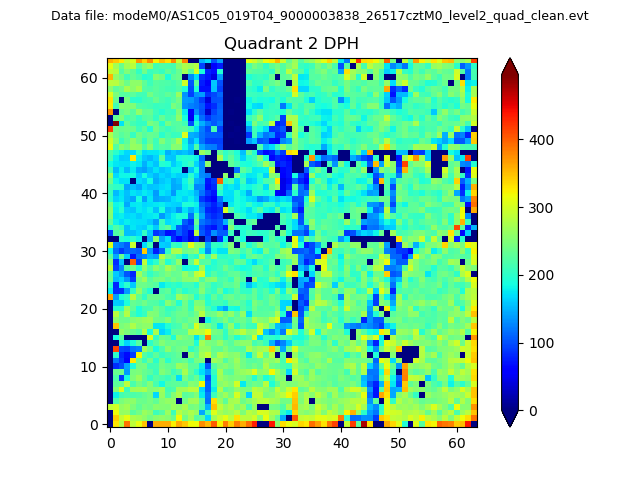
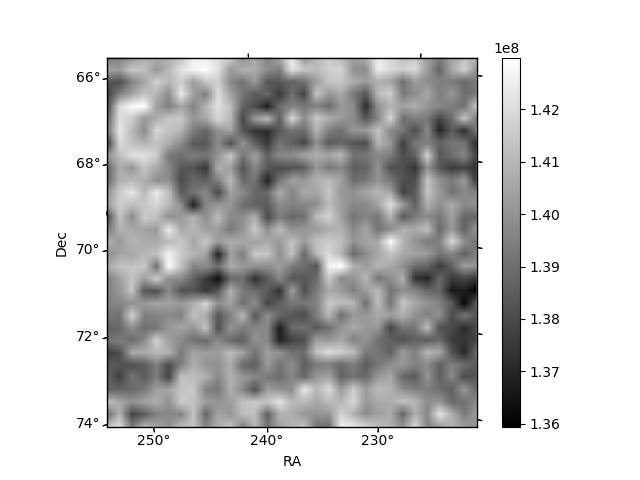
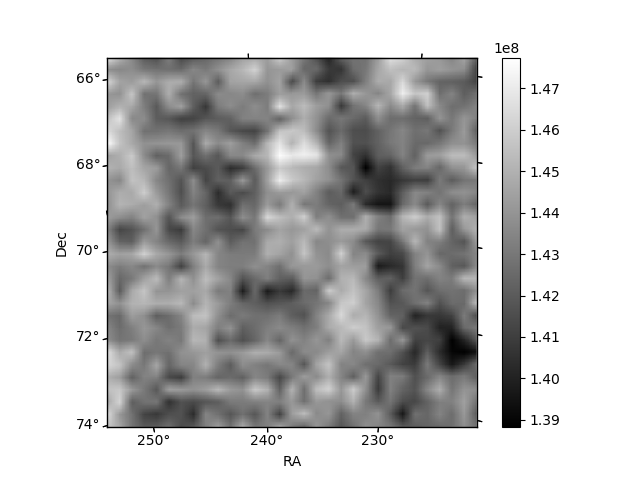
Histogram calculated using DETX and DETY for each event in the final _common_clean file
| Quadrant A | 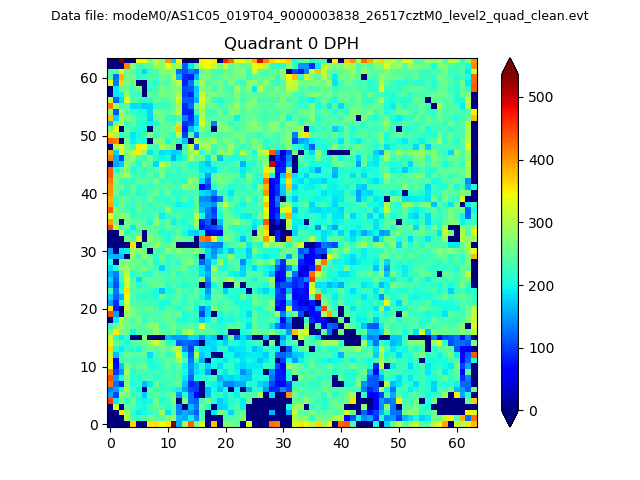 |
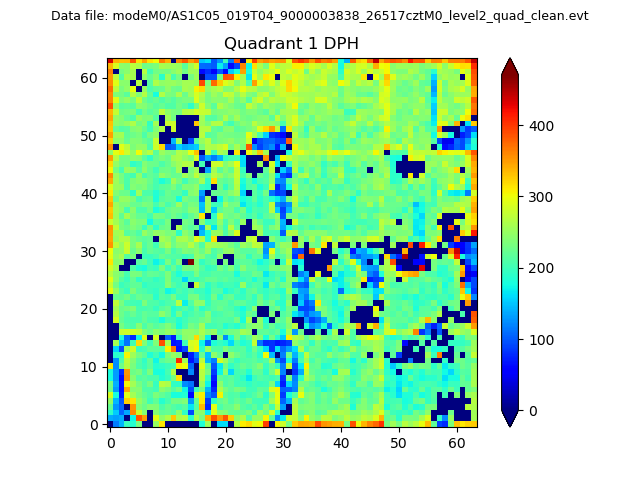 |
Quadrant B |
|---|---|---|---|
| Quadrant D | 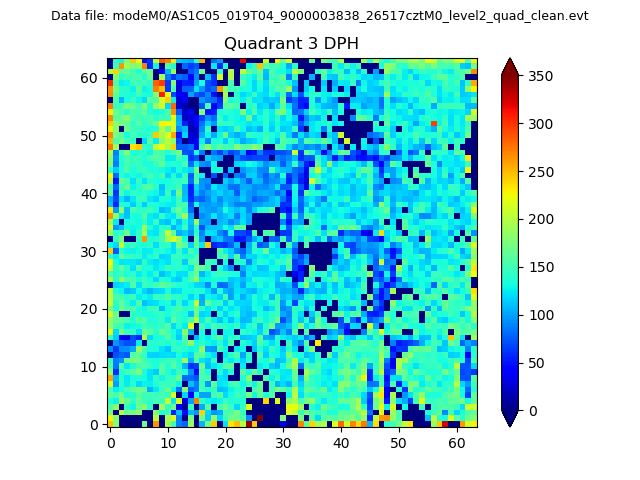 |
 |
Quadrant C |
| Plot type | Count rate plots | Images |
|---|---|---|
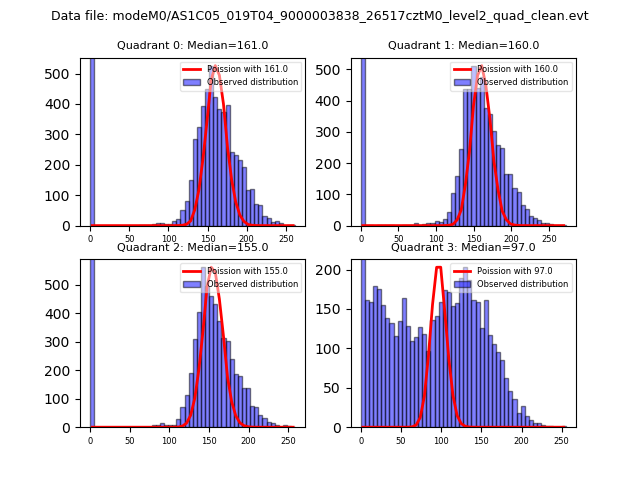
| Comparison with Poisson distribution Blue bars denote a histogram of data divided into 1 sec bins. Red curve is a Poisson curve with rate = median count rate of data. |
 |
 |
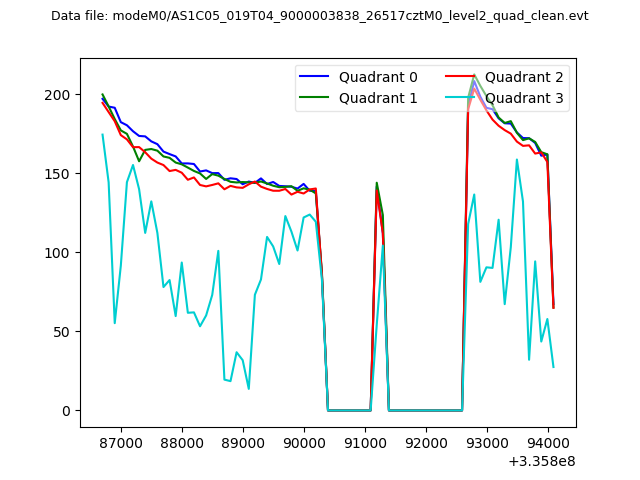
| Quadrant-wise count rates Data is divided into 100 sec bins |
 |
|
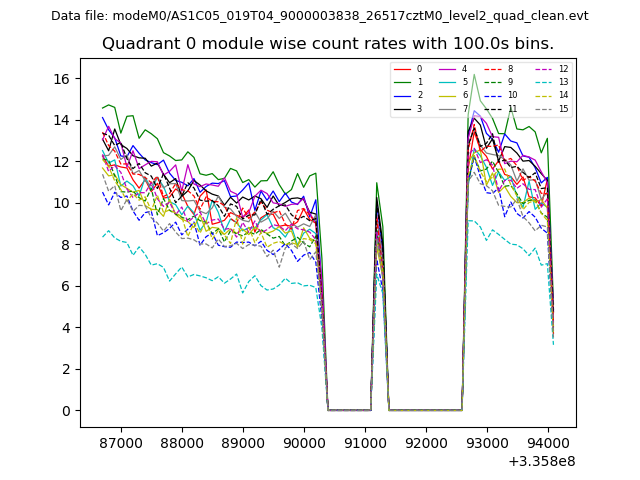
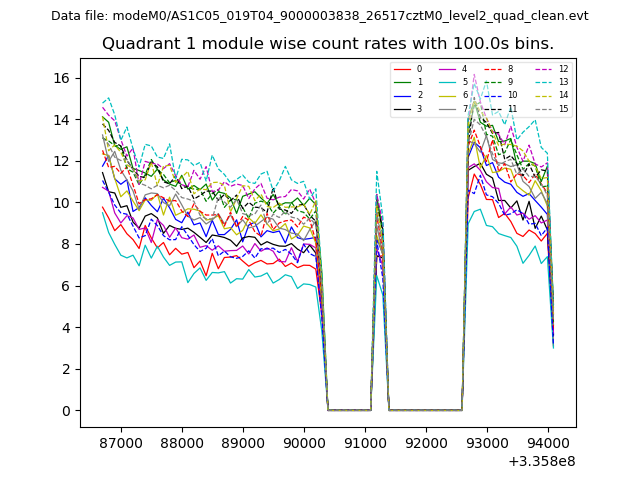
| Module-wise count rates for Quadrant A Data is divided into 100 sec bins |
 |
 |
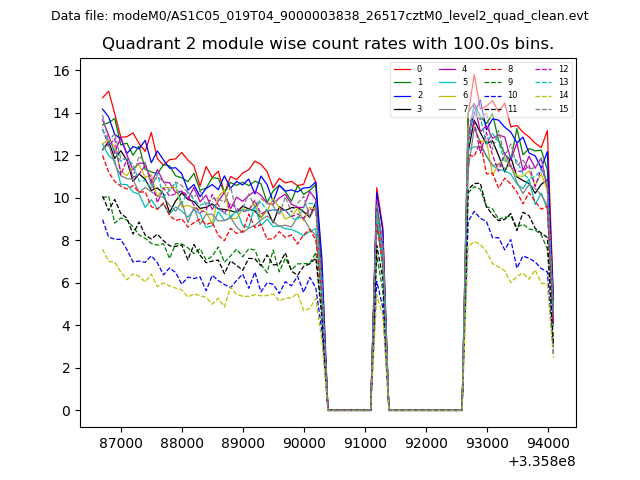
| Module-wise count rates for Quadrant B Data is divided into 100 sec bins |
 |
 |
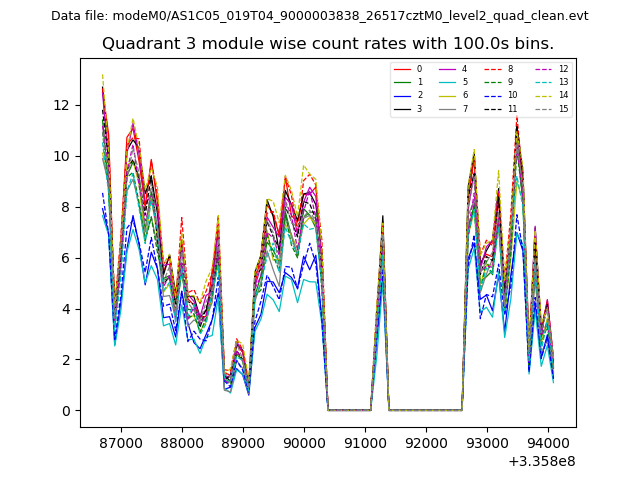
| Module-wise count rates for Quadrant C Data is divided into 100 sec bins |
 |
 |
| Module-wise count rates for Quadrant D Data is divided into 100 sec bins |
 |
 |
| Parameter | Plot |
|---|---|
| CZT HV Monitor | 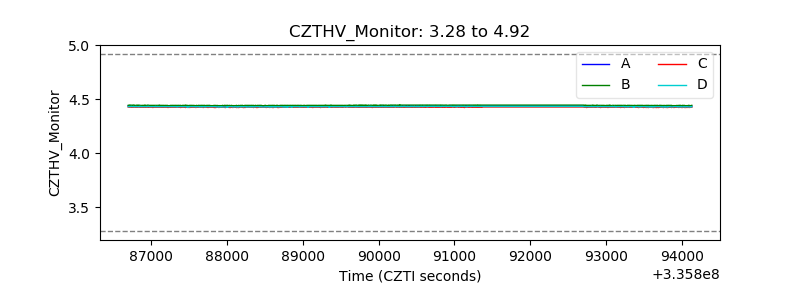 |
| D_VDD | 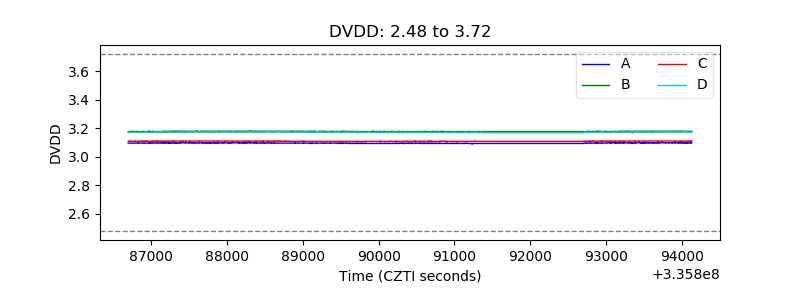 |
| Temperature 1 |  |
| Veto HV Monitor | 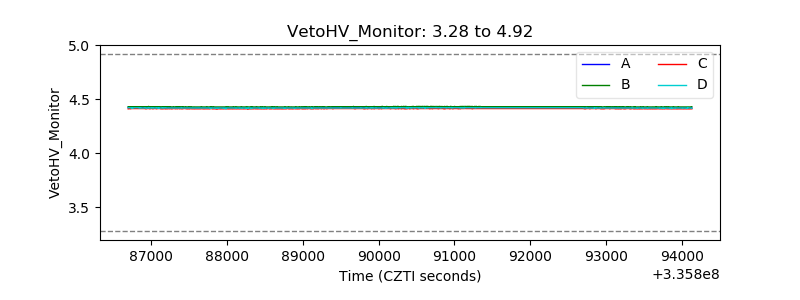 |
| Veto LLD | 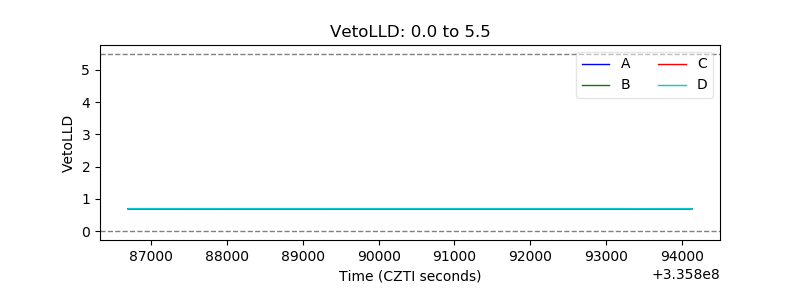 |
| Alpha Counter | 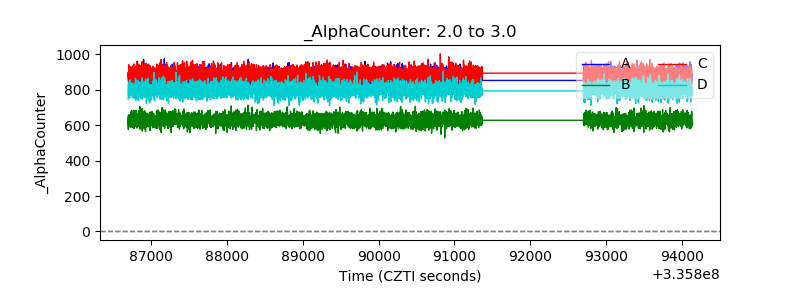 |
| _CPM_Rate | 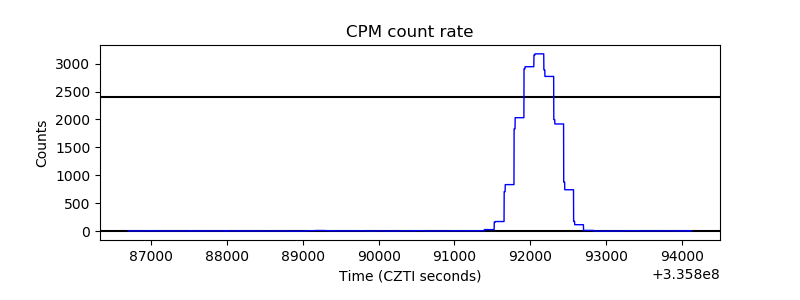 |
| CZT Counter | 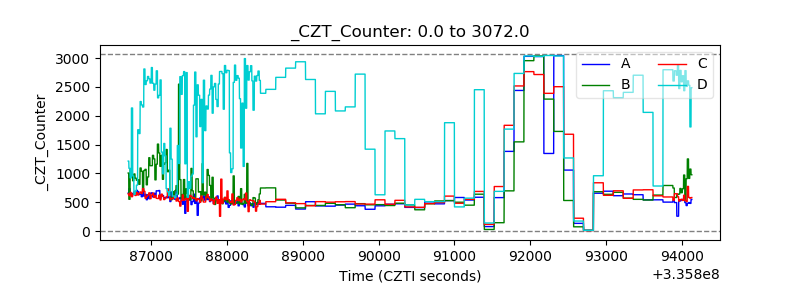 |
| +2.5 Volts monitor |  |
| +5 Volts monitor |  |
| _ROLL_ROT | 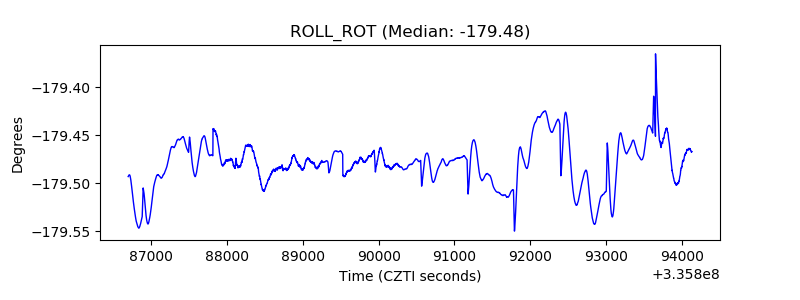 |
| _Roll_DEC | 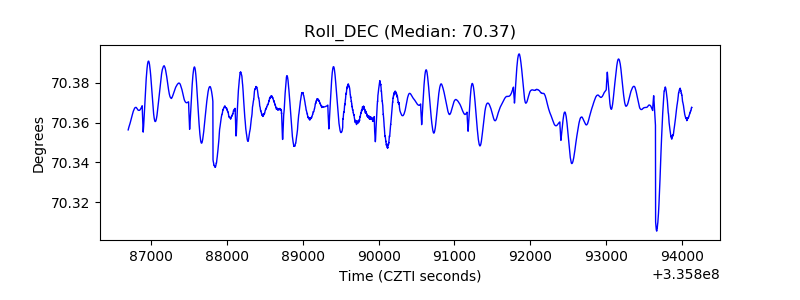 |
| _Roll_RA | 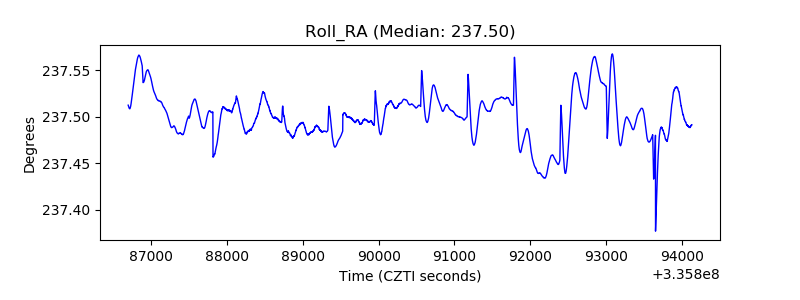 |
| Veto Counter | 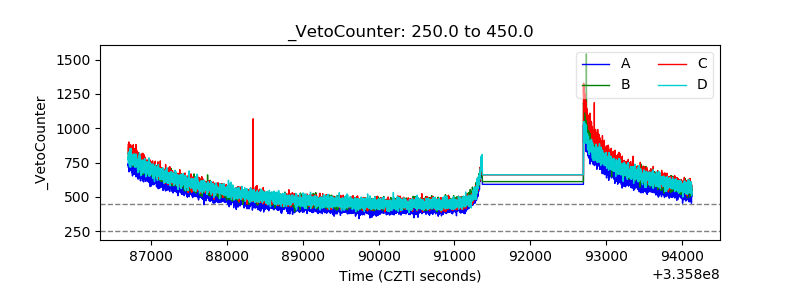 |