| Param | Original file | Final file |
|---|---|---|
| Filename | modeM0/AS1C05_019T04_9000003838_26518cztM0_level2.evt | modeM0/AS1C05_019T04_9000003838_26518cztM0_level2_quad_clean.evt |
| Size (bytes) | 719,173,440 | 110,502,720 |
| Size | 685.9 MB | 105.4 MB |
| Events in quadrant A | 2,999,397 | 807,400 |
| Events in quadrant B | 3,585,122 | 813,418 |
| Events in quadrant C | 3,225,175 | 796,390 |
| Events in quadrant D | 11,573,007 | 517,553 |
| Mode M9 | |||
|---|---|---|---|
| Quadrant | BADHDUFLAG | Total packets | Discarded packets |
| A | 0 | 14 | 0 |
| B | 0 | 14 | 0 |
| C | 0 | 14 | 0 |
| D | 0 | 14 | 0 |
| Mode M0 | |||
|---|---|---|---|
| Quadrant | BADHDUFLAG | Total packets | Discarded packets |
| A | 0 | 12566 | 0 |
| B | 0 | 14660 | 0 |
| C | 0 | 13337 | 0 |
| D | 0 | 38410 | 0 |
| Quadrant | Total seconds | Saturated seconds | Saturation percentage |
|---|---|---|---|
| A | 5884 | 46 | 0.781781% |
| B | 5883 | 60 | 1.019888% |
| C | 5883 | 88 | 1.495835% |
| D | 5884 | 3486 | 59.245411% |
Noise dominated data is calculated using 1-second bins in cleaned event files. If a bin has >2000 counts, and if more than 50% of those come from <1% of pixels, then it is considered to be noise-dominated and hence unusable.
| Quadrant | # 1 sec bins | Bins with >0 counts | Bins with >2000 counts | High rate bins dominated by noise | Noise dominated (total time) | Noise dominated (detector-on time) | Marked lightcurve |
|---|---|---|---|---|---|---|---|
| A | 7279 | 5885 | 0 | 0 | 0.00% | 0.00% | 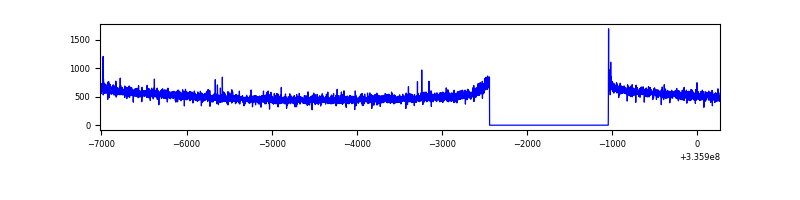 |
| B | 7278 | 5884 | 7 | 7 | 0.10% | 0.12% | 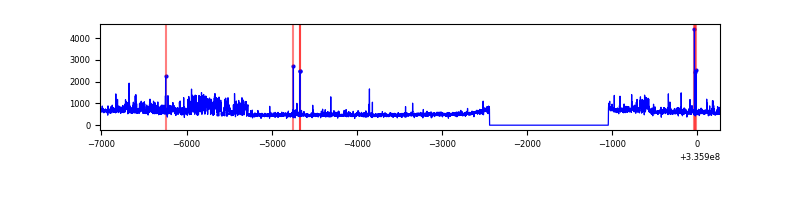 |
| C | 7278 | 5883 | 2 | 2 | 0.03% | 0.03% | 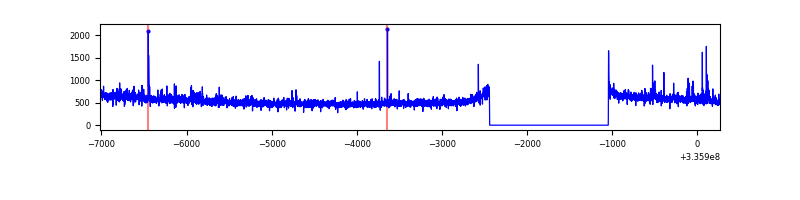 |
| D | 7279 | 5884 | 3355 | 3355 | 46.09% | 57.02% | 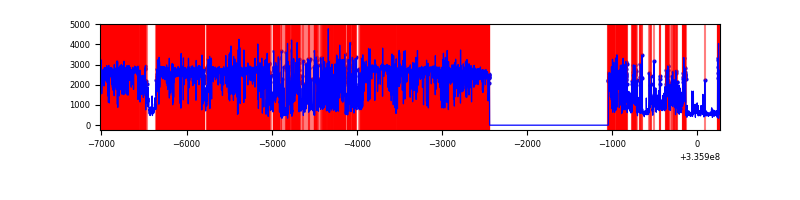 |
Top three noisy pixels from each quadrant. If the there are fewer than three noisy pixels in the level2.evt file, extra rows are filled as -1
| Pixel properties | Quadrant properties | ||||||
|---|---|---|---|---|---|---|---|
| Quadrant | DetID | PixID | Counts | Sigma | Mean | Median | Sigma |
| A | 13 | 254 | 10999 | 67.03 | 776 | 761 | 152.7 |
| A | 0 | 226 | 6683 | 38.77 | 776 | 761 | 152.7 |
| A | 3 | 137 | 6075 | 34.79 | 776 | 761 | 152.7 |
| B | 0 | 189 | 354089 | 2510.16 | 773 | 756 | 140.8 |
| B | 3 | 112 | 94078 | 662.98 | 773 | 756 | 140.8 |
| B | 5 | 172 | 36637 | 254.91 | 773 | 756 | 140.8 |
| C | 14 | 238 | 121802 | 692.52 | 763 | 770 | 174.8 |
| C | 3 | 233 | 100914 | 573.0 | 763 | 770 | 174.8 |
| C | 0 | 207 | 13353 | 72.0 | 763 | 770 | 174.8 |
| D | 1 | 52 | 4826815 | 37736.45 | 521 | 510 | 127.9 |
| D | 7 | 80 | 4511382 | 35270.11 | 521 | 510 | 127.9 |
| D | 12 | 233 | 143073 | 1114.68 | 521 | 510 | 127.9 |
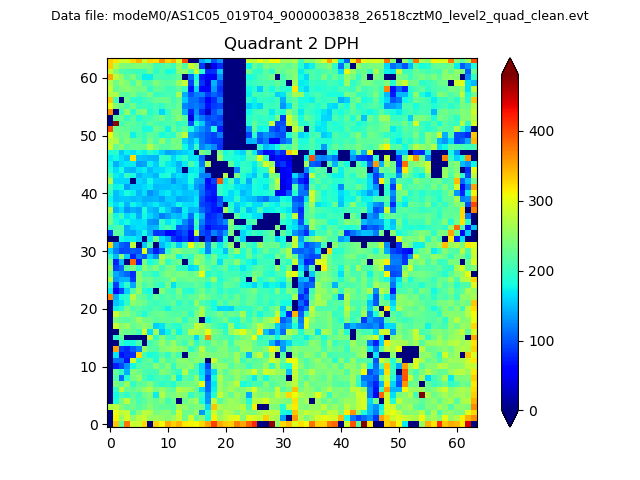
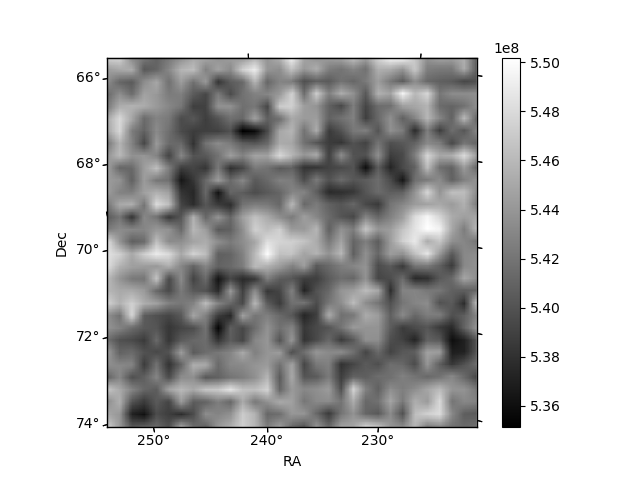
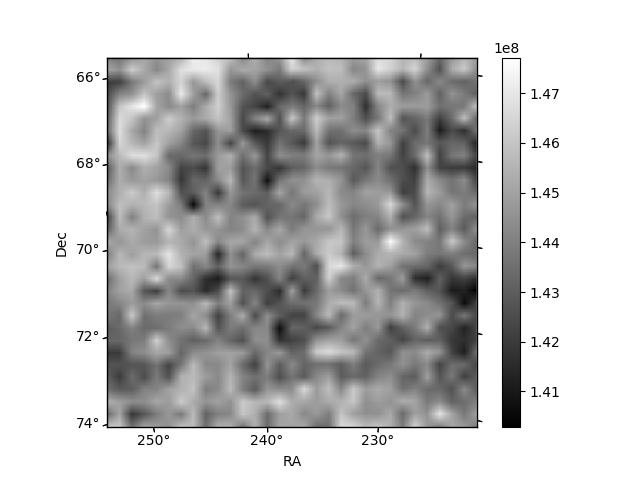
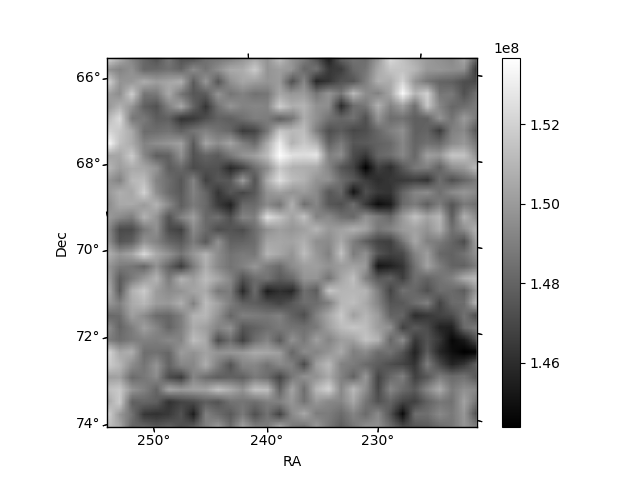
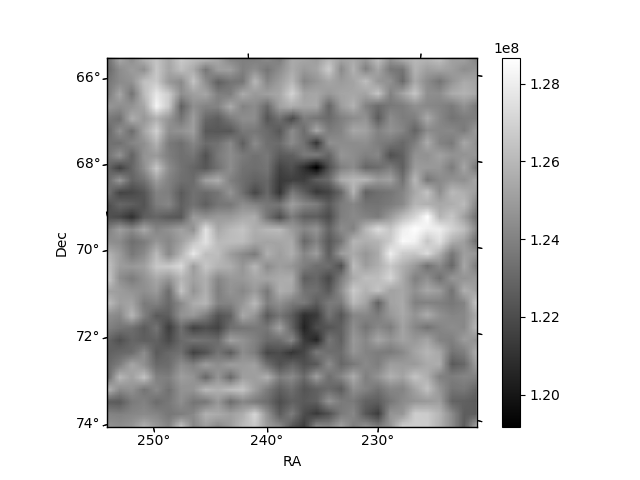
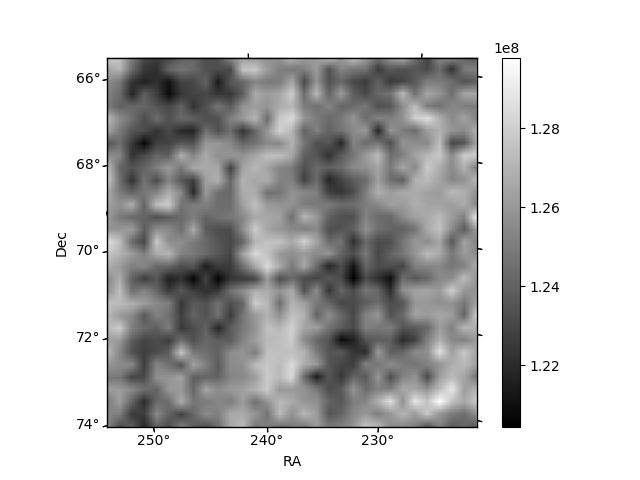
Histogram calculated using DETX and DETY for each event in the final _common_clean file
| Quadrant A | 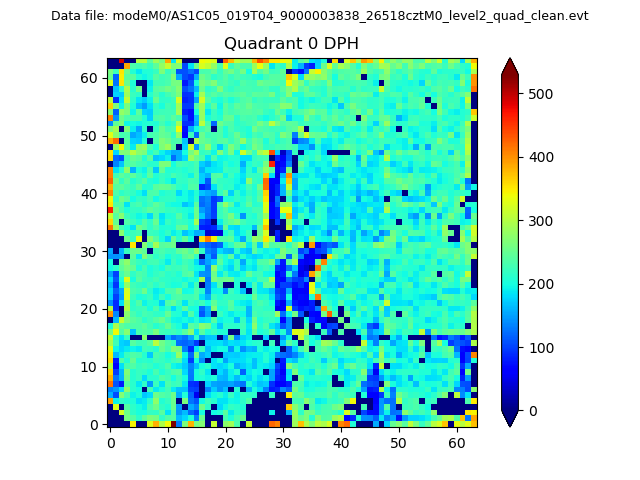 |
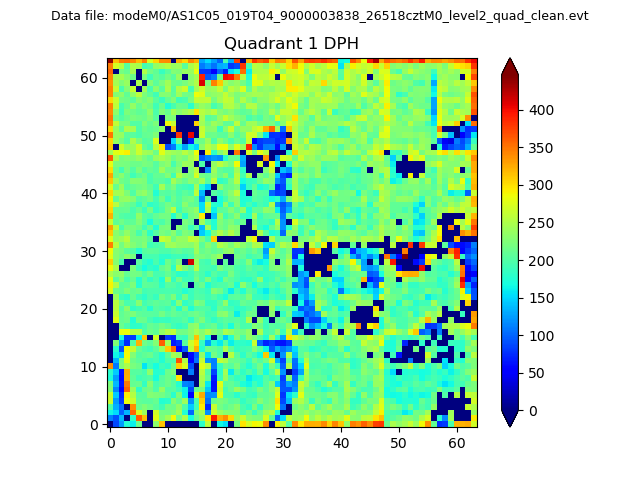 |
Quadrant B |
|---|---|---|---|
| Quadrant D | 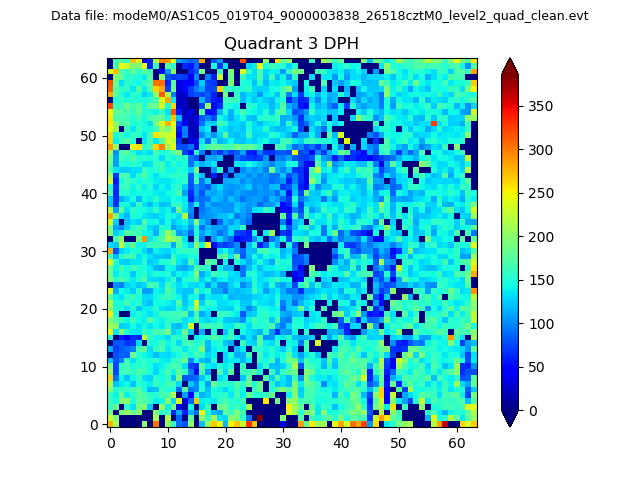 |
 |
Quadrant C |
| Plot type | Count rate plots | Images |
|---|---|---|
| Comparison with Poisson distribution Blue bars denote a histogram of data divided into 1 sec bins. Red curve is a Poisson curve with rate = median count rate of data. |
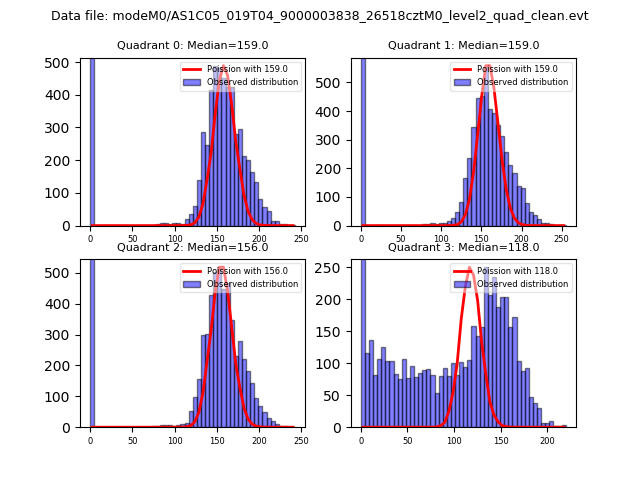 |
 |
| Quadrant-wise count rates Data is divided into 100 sec bins |
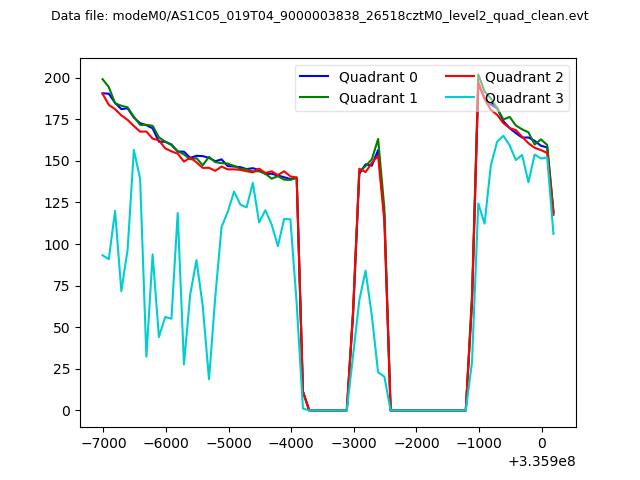 |
|
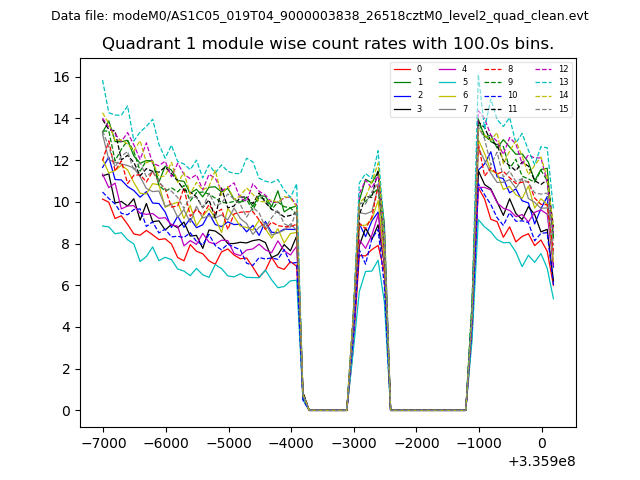
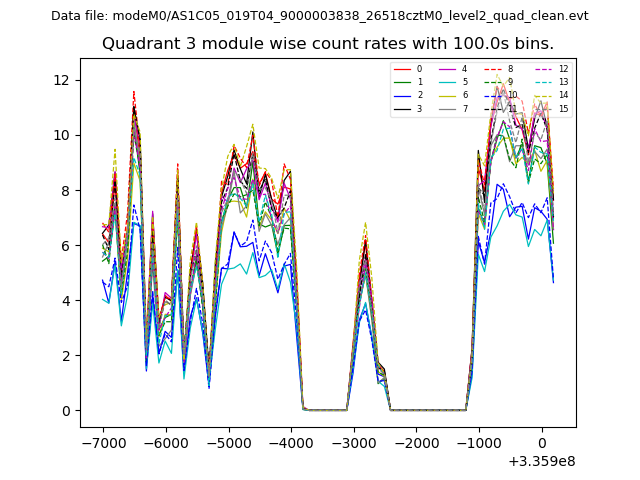
| Module-wise count rates for Quadrant A Data is divided into 100 sec bins |
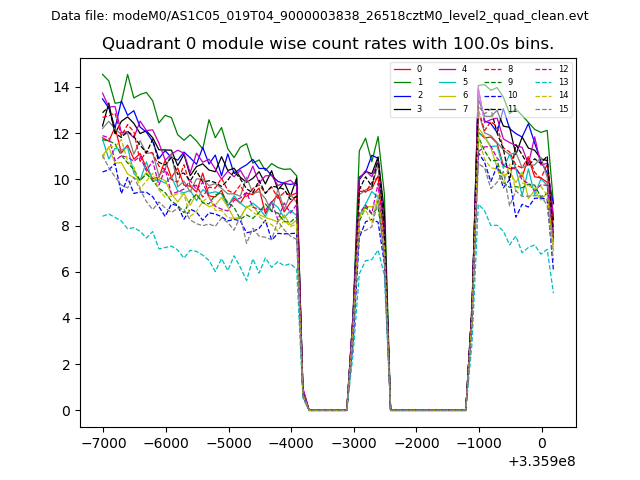 |
 |
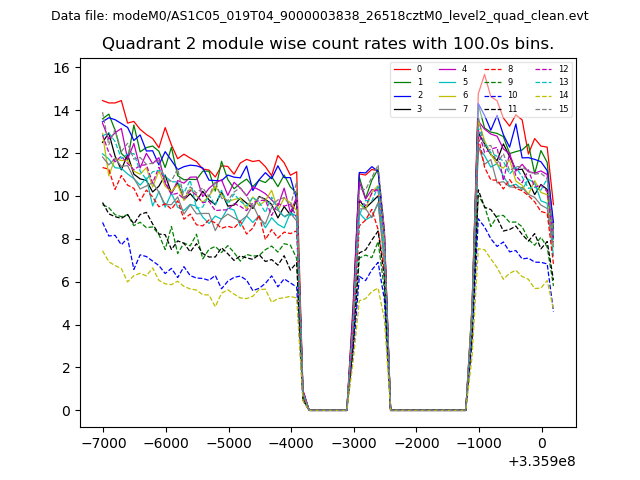
| Module-wise count rates for Quadrant B Data is divided into 100 sec bins |
 |
 |
| Module-wise count rates for Quadrant C Data is divided into 100 sec bins |
 |
 |
| Module-wise count rates for Quadrant D Data is divided into 100 sec bins |
 |
 |
| Parameter | Plot |
|---|---|
| CZT HV Monitor | 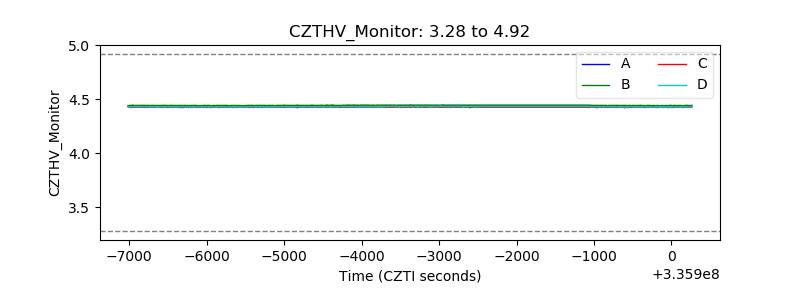 |
| D_VDD | 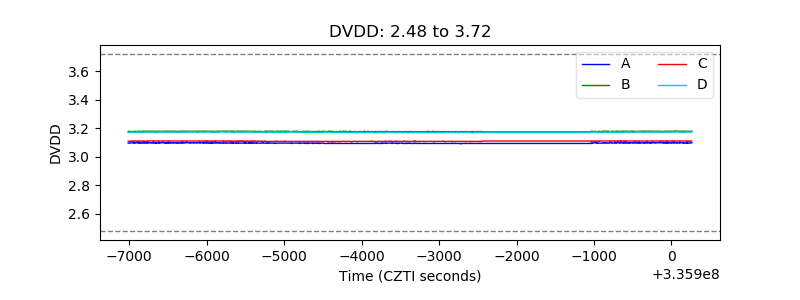 |
| Temperature 1 | 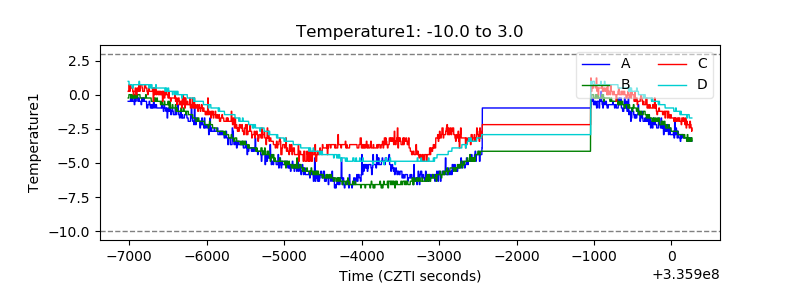 |
| Veto HV Monitor | 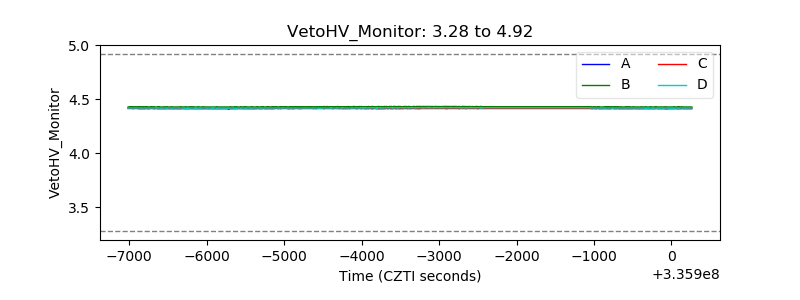 |
| Veto LLD | 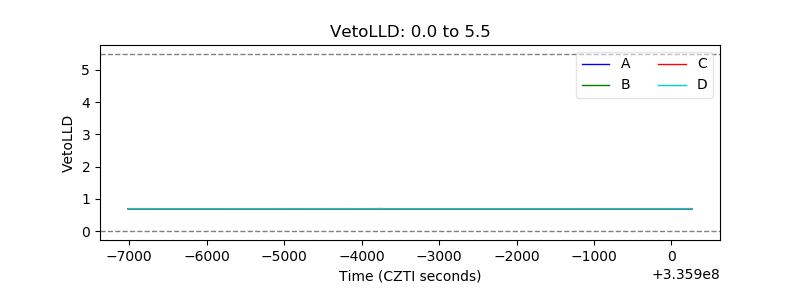 |
| Alpha Counter | 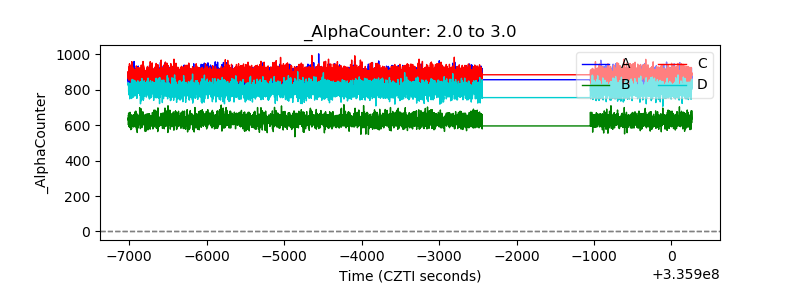 |
| _CPM_Rate | 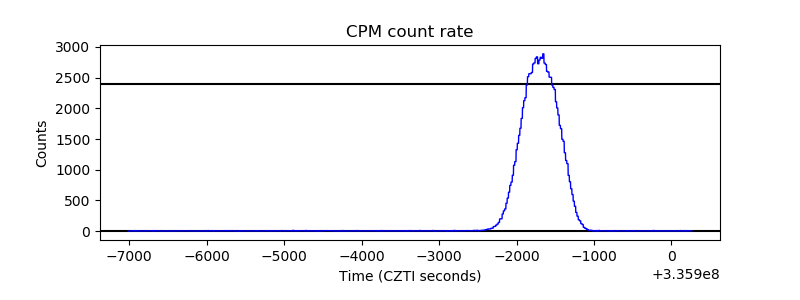 |
| CZT Counter | 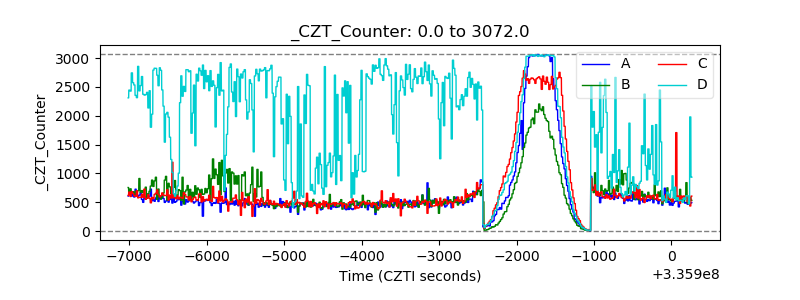 |
| +2.5 Volts monitor |  |
| +5 Volts monitor |  |
| _ROLL_ROT | 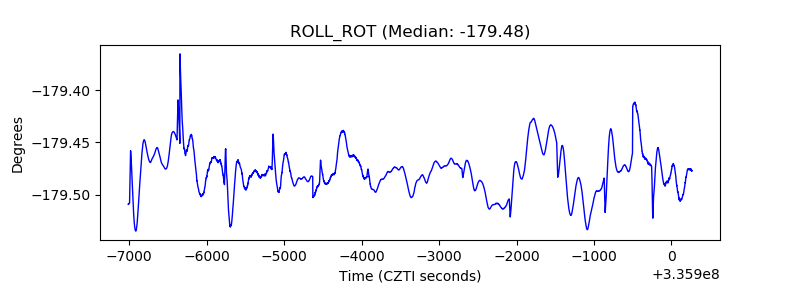 |
| _Roll_DEC | 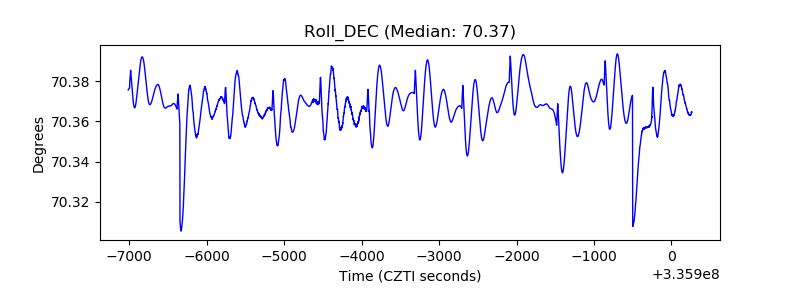 |
| _Roll_RA | 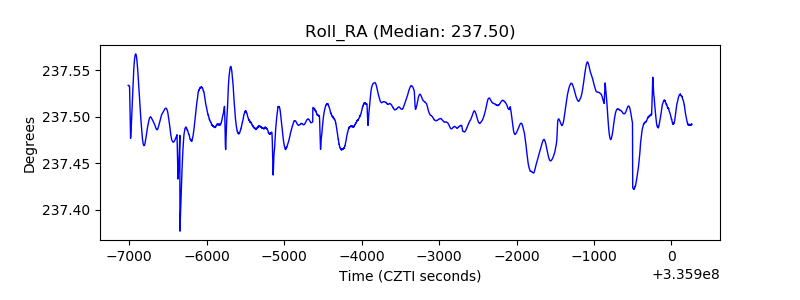 |
| Veto Counter | 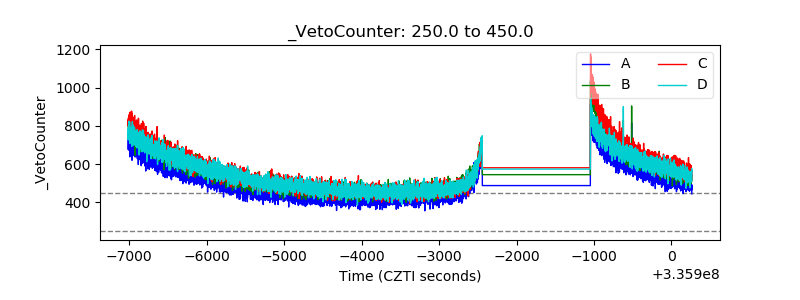 |