| Param | Original file | Final file |
|---|---|---|
| Filename | modeM0/AS1C05_019T04_9000003838_26519cztM0_level2.evt | modeM0/AS1C05_019T04_9000003838_26519cztM0_level2_quad_clean.evt |
| Size (bytes) | 664,848,000 | 111,124,800 |
| Size | 634.0 MB | 106.0 MB |
| Events in quadrant A | 3,014,662 | 787,174 |
| Events in quadrant B | 3,469,360 | 800,187 |
| Events in quadrant C | 3,327,297 | 781,160 |
| Events in quadrant D | 9,912,901 | 572,362 |
| Mode M9 | |||
|---|---|---|---|
| Quadrant | BADHDUFLAG | Total packets | Discarded packets |
| A | 0 | 13 | 0 |
| B | 0 | 13 | 0 |
| C | 0 | 13 | 0 |
| D | 0 | 13 | 0 |
| Mode M0 | |||
|---|---|---|---|
| Quadrant | BADHDUFLAG | Total packets | Discarded packets |
| A | 0 | 12718 | 0 |
| B | 0 | 14338 | 0 |
| C | 0 | 13635 | 0 |
| D | 0 | 33631 | 0 |
| Quadrant | Total seconds | Saturated seconds | Saturation percentage |
|---|---|---|---|
| A | 6067 | 42 | 0.692270% |
| B | 6068 | 93 | 1.532630% |
| C | 6068 | 116 | 1.911668% |
| D | 6068 | 2468 | 40.672380% |
Noise dominated data is calculated using 1-second bins in cleaned event files. If a bin has >2000 counts, and if more than 50% of those come from <1% of pixels, then it is considered to be noise-dominated and hence unusable.
| Quadrant | # 1 sec bins | Bins with >0 counts | Bins with >2000 counts | High rate bins dominated by noise | Noise dominated (total time) | Noise dominated (detector-on time) | Marked lightcurve |
|---|---|---|---|---|---|---|---|
| A | 7407 | 6068 | 2 | 2 | 0.03% | 0.03% | 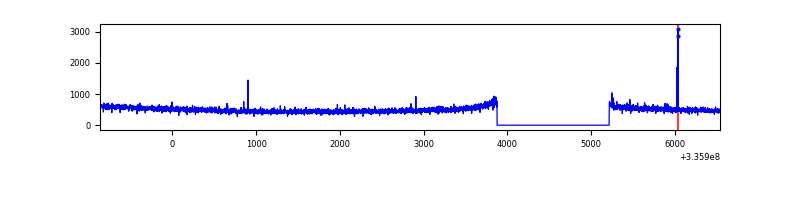 |
| B | 7408 | 6069 | 22 | 22 | 0.30% | 0.36% | 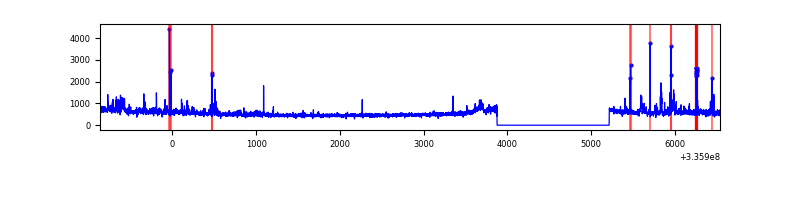 |
| C | 7408 | 6069 | 2 | 2 | 0.03% | 0.03% | 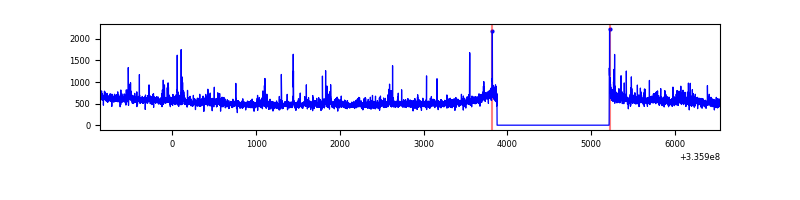 |
| D | 7407 | 6067 | 2345 | 2345 | 31.66% | 38.65% | 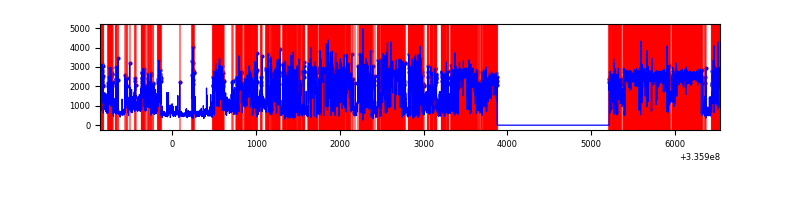 |
Top three noisy pixels from each quadrant. If the there are fewer than three noisy pixels in the level2.evt file, extra rows are filled as -1
| Pixel properties | Quadrant properties | ||||||
|---|---|---|---|---|---|---|---|
| Quadrant | DetID | PixID | Counts | Sigma | Mean | Median | Sigma |
| A | 6 | 16 | 17336 | 109.7 | 772 | 757 | 151.1 |
| A | 3 | 15 | 14719 | 92.38 | 772 | 757 | 151.1 |
| A | 13 | 254 | 10961 | 67.52 | 772 | 757 | 151.1 |
| B | 0 | 189 | 125143 | 885.77 | 773 | 756 | 140.4 |
| B | 3 | 112 | 102425 | 724.0 | 773 | 756 | 140.4 |
| B | 0 | 244 | 51275 | 359.75 | 773 | 756 | 140.4 |
| C | 3 | 233 | 153701 | 875.01 | 763 | 769 | 174.8 |
| C | 14 | 238 | 121447 | 690.47 | 763 | 769 | 174.8 |
| C | 4 | 254 | 39579 | 222.05 | 763 | 769 | 174.8 |
| D | 1 | 52 | 3751405 | 25092.36 | 601 | 589 | 149.5 |
| D | 7 | 80 | 3389752 | 22672.96 | 601 | 589 | 149.5 |
| D | 12 | 233 | 254468 | 1698.41 | 601 | 589 | 149.5 |
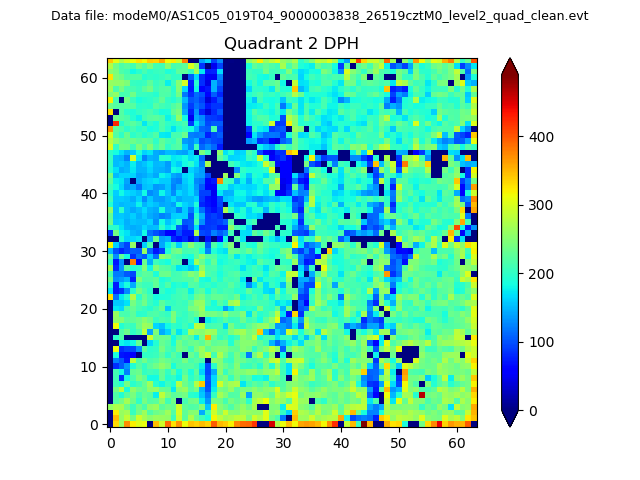
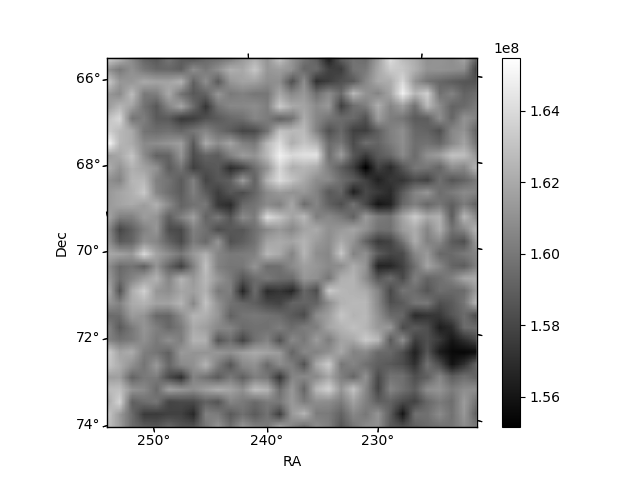
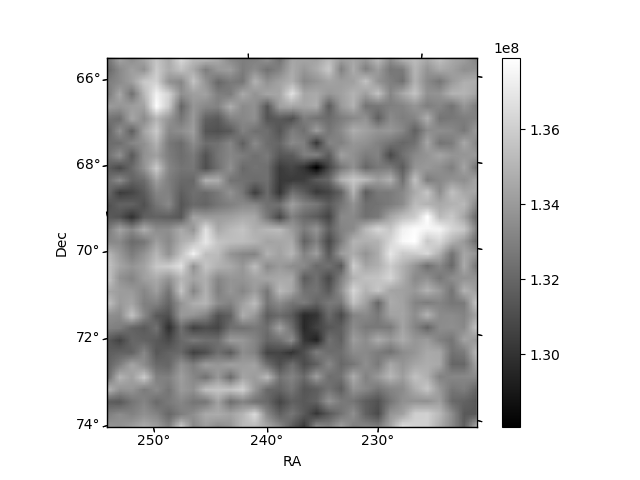
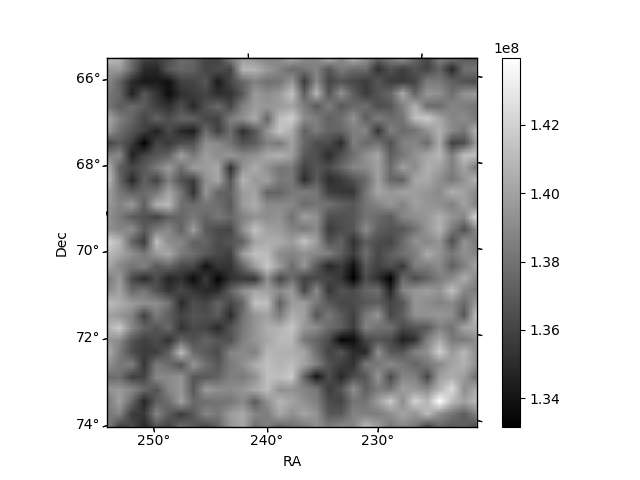
Histogram calculated using DETX and DETY for each event in the final _common_clean file
| Quadrant A | 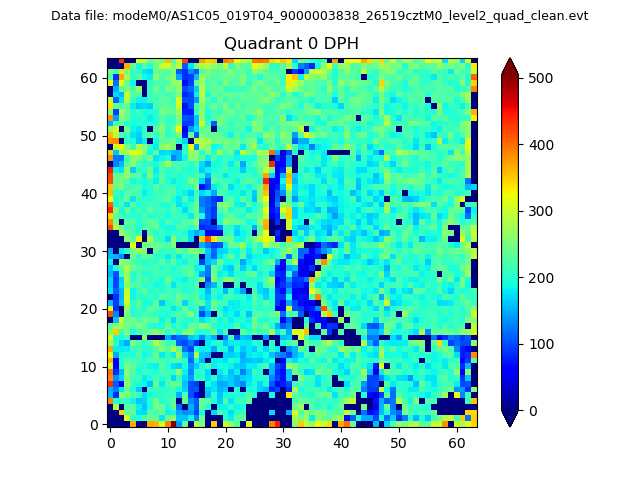 |
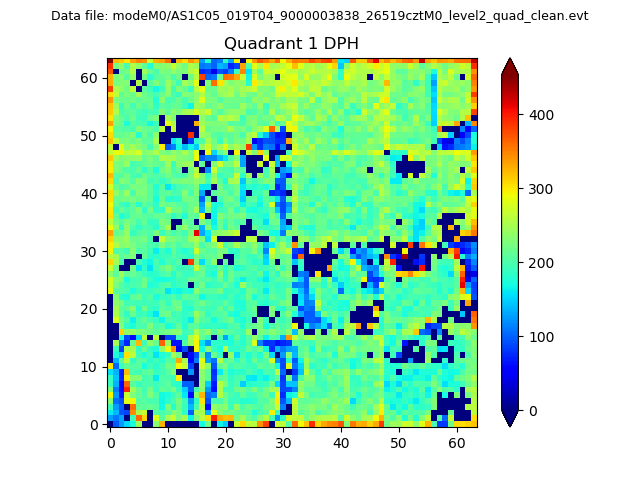 |
Quadrant B |
|---|---|---|---|
| Quadrant D | 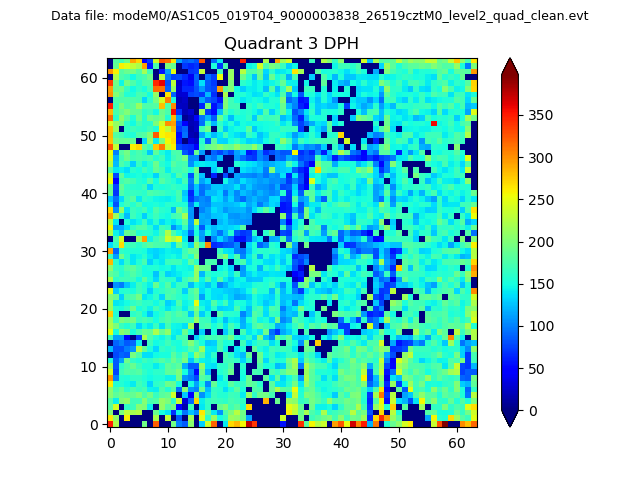 |
 |
Quadrant C |
| Plot type | Count rate plots | Images |
|---|---|---|
| Comparison with Poisson distribution Blue bars denote a histogram of data divided into 1 sec bins. Red curve is a Poisson curve with rate = median count rate of data. |
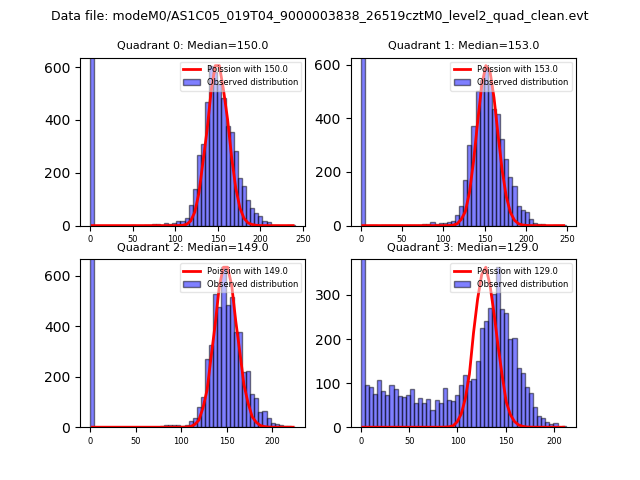 |
 |
| Quadrant-wise count rates Data is divided into 100 sec bins |
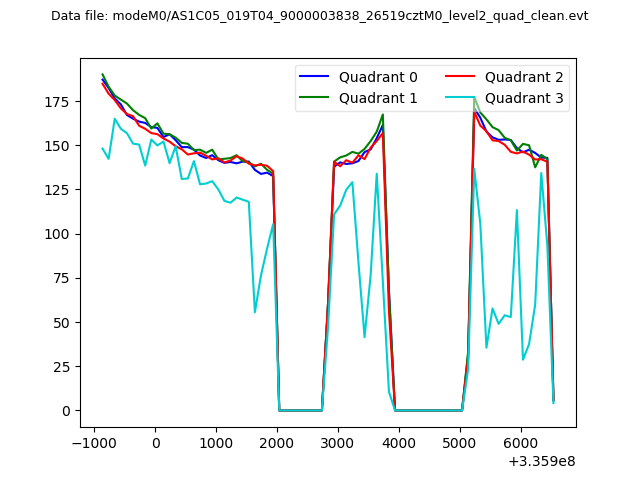 |
|
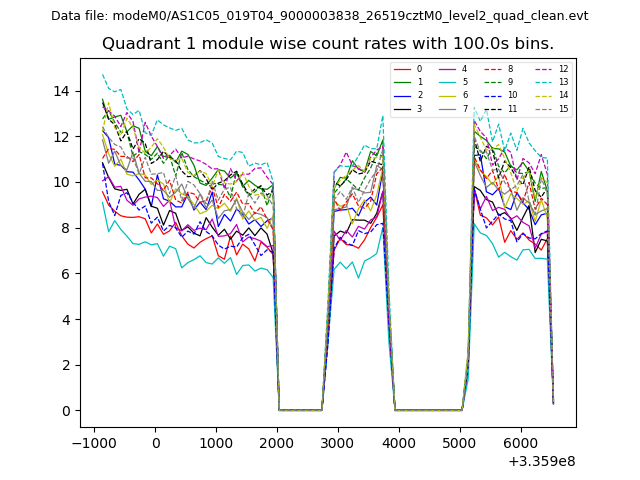
| Module-wise count rates for Quadrant A Data is divided into 100 sec bins |
 |
 |
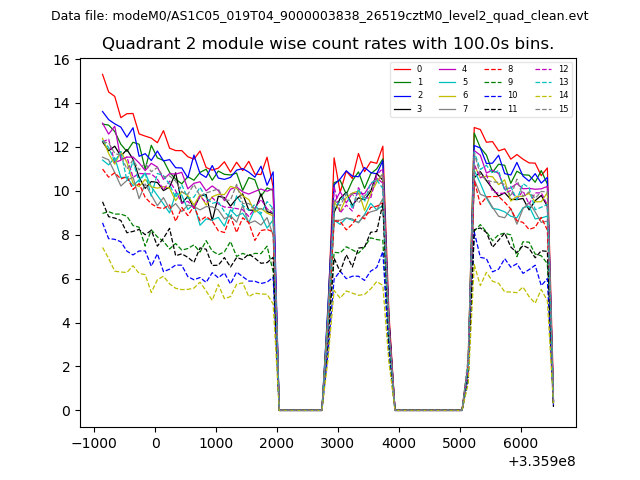
| Module-wise count rates for Quadrant B Data is divided into 100 sec bins |
 |
 |
| Module-wise count rates for Quadrant C Data is divided into 100 sec bins |
 |
 |
| Module-wise count rates for Quadrant D Data is divided into 100 sec bins |
 |
 |
| Parameter | Plot |
|---|---|
| CZT HV Monitor |  |
| D_VDD | 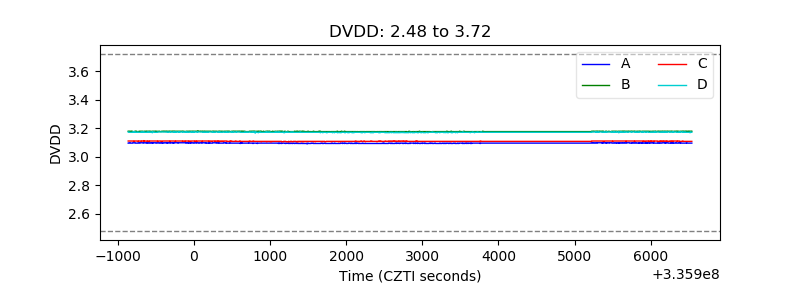 |
| Temperature 1 | 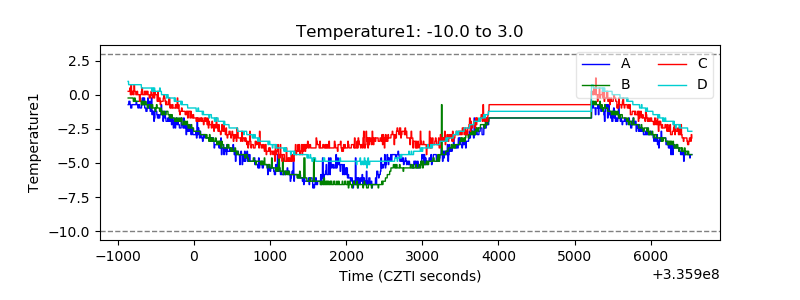 |
| Veto HV Monitor | 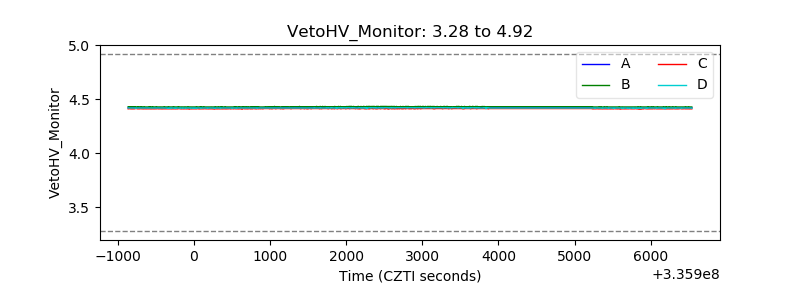 |
| Veto LLD |  |
| Alpha Counter | 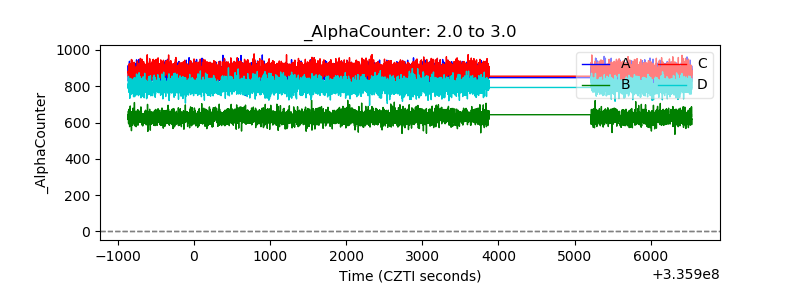 |
| _CPM_Rate | 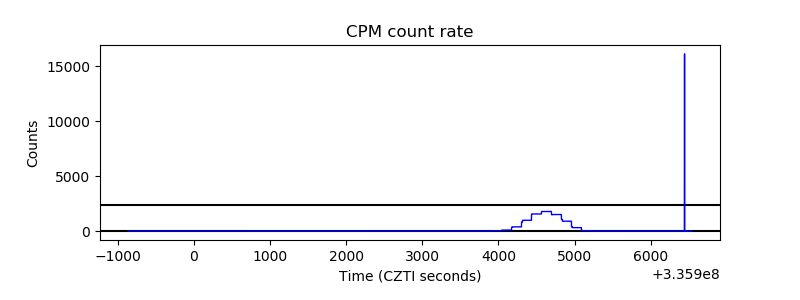 |
| CZT Counter | 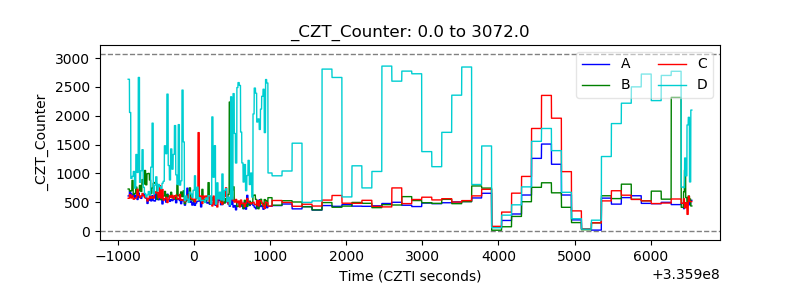 |
| +2.5 Volts monitor |  |
| +5 Volts monitor |  |
| _ROLL_ROT |  |
| _Roll_DEC | 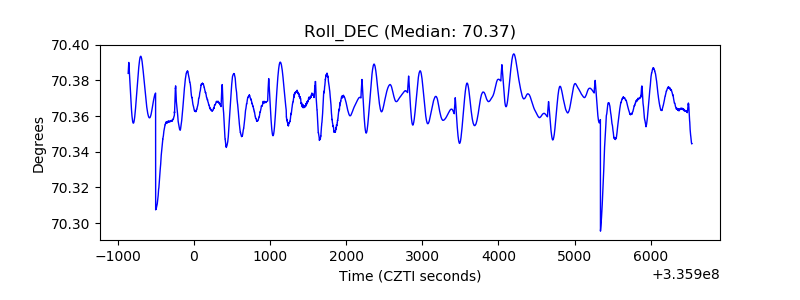 |
| _Roll_RA | 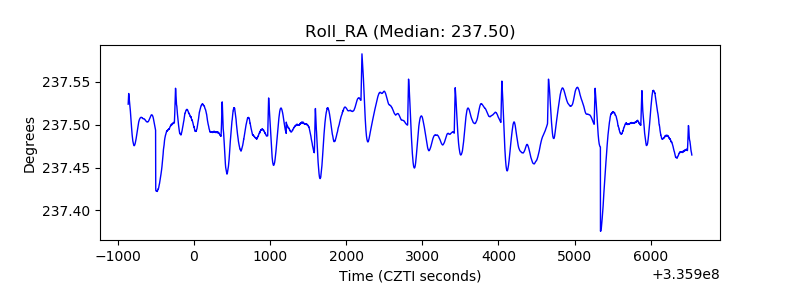 |
| Veto Counter |  |