| Param | Original file | Final file |
|---|---|---|
| Filename | modeM0/AS1C05_019T04_9000003838_26520cztM0_level2.evt | modeM0/AS1C05_019T04_9000003838_26520cztM0_level2_quad_clean.evt |
| Size (bytes) | 640,166,400 | 106,110,720 |
| Size | 610.5 MB | 101.2 MB |
| Events in quadrant A | 3,057,419 | 750,274 |
| Events in quadrant B | 3,326,877 | 763,123 |
| Events in quadrant C | 3,397,525 | 744,271 |
| Events in quadrant D | 9,181,676 | 518,079 |
| Mode M9 | |||
|---|---|---|---|
| Quadrant | BADHDUFLAG | Total packets | Discarded packets |
| A | 0 | 11 | 0 |
| B | 0 | 11 | 0 |
| C | 0 | 11 | 0 |
| D | 0 | 11 | 0 |
| Mode M0 | |||
|---|---|---|---|
| Quadrant | BADHDUFLAG | Total packets | Discarded packets |
| A | 0 | 13066 | 0 |
| B | 0 | 13923 | 0 |
| C | 0 | 13922 | 0 |
| D | 0 | 31598 | 0 |
| Quadrant | Total seconds | Saturated seconds | Saturation percentage |
|---|---|---|---|
| A | 6254 | 14 | 0.223857% |
| B | 6255 | 64 | 1.023181% |
| C | 6255 | 103 | 1.646683% |
| D | 6255 | 2494 | 39.872102% |
Noise dominated data is calculated using 1-second bins in cleaned event files. If a bin has >2000 counts, and if more than 50% of those come from <1% of pixels, then it is considered to be noise-dominated and hence unusable.
| Quadrant | # 1 sec bins | Bins with >0 counts | Bins with >2000 counts | High rate bins dominated by noise | Noise dominated (total time) | Noise dominated (detector-on time) | Marked lightcurve |
|---|---|---|---|---|---|---|---|
| A | 7359 | 6255 | 5 | 5 | 0.07% | 0.08% | 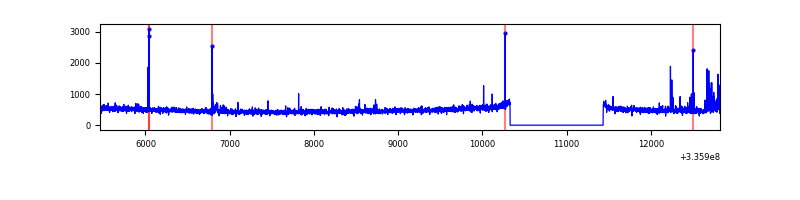 |
| B | 7360 | 6256 | 20 | 20 | 0.27% | 0.32% | 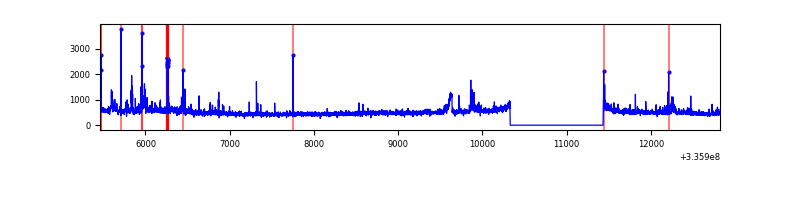 |
| C | 7360 | 6255 | 12 | 12 | 0.16% | 0.19% | 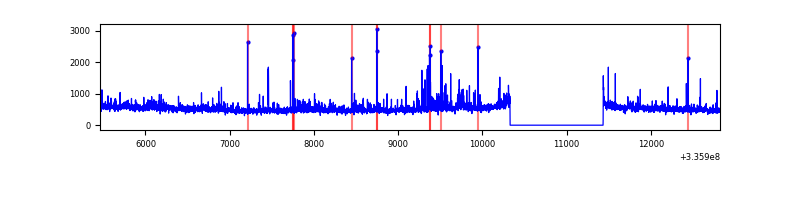 |
| D | 7360 | 6255 | 2227 | 2227 | 30.26% | 35.60% | 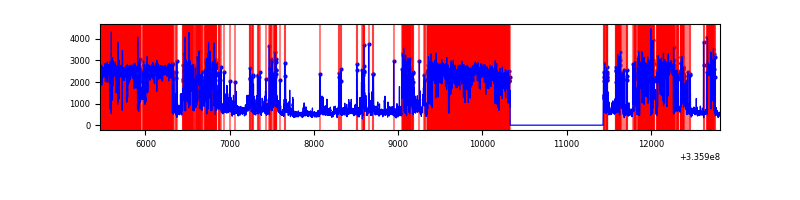 |
Top three noisy pixels from each quadrant. If the there are fewer than three noisy pixels in the level2.evt file, extra rows are filled as -1
| Pixel properties | Quadrant properties | ||||||
|---|---|---|---|---|---|---|---|
| Quadrant | DetID | PixID | Counts | Sigma | Mean | Median | Sigma |
| A | 0 | 13 | 80048 | 527.62 | 754 | 738 | 150.3 |
| A | 6 | 16 | 46249 | 302.77 | 754 | 738 | 150.3 |
| A | 3 | 15 | 14629 | 92.41 | 754 | 738 | 150.3 |
| B | 0 | 189 | 93817 | 667.4 | 756 | 738 | 139.5 |
| B | 3 | 112 | 55651 | 393.74 | 756 | 738 | 139.5 |
| B | 0 | 244 | 45471 | 320.75 | 756 | 738 | 139.5 |
| C | 4 | 254 | 171017 | 987.79 | 743 | 749 | 172.4 |
| C | 3 | 233 | 151587 | 875.07 | 743 | 749 | 172.4 |
| C | 14 | 238 | 118601 | 683.7 | 743 | 749 | 172.4 |
| D | 7 | 80 | 5247182 | 37046.86 | 575 | 561 | 141.6 |
| D | 1 | 52 | 1531863 | 10812.66 | 575 | 561 | 141.6 |
| D | 12 | 233 | 162233 | 1141.58 | 575 | 561 | 141.6 |
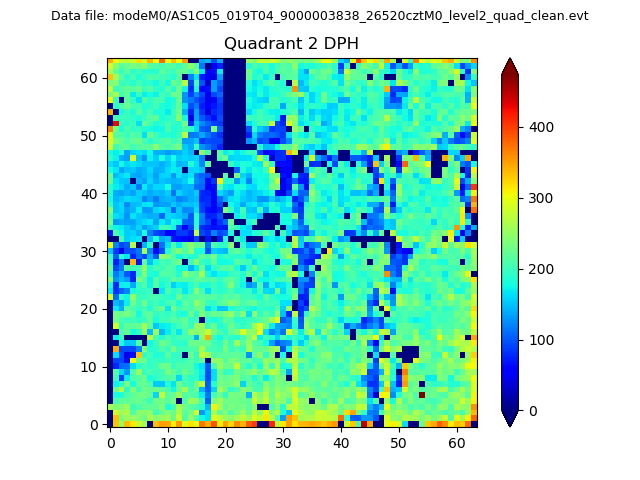
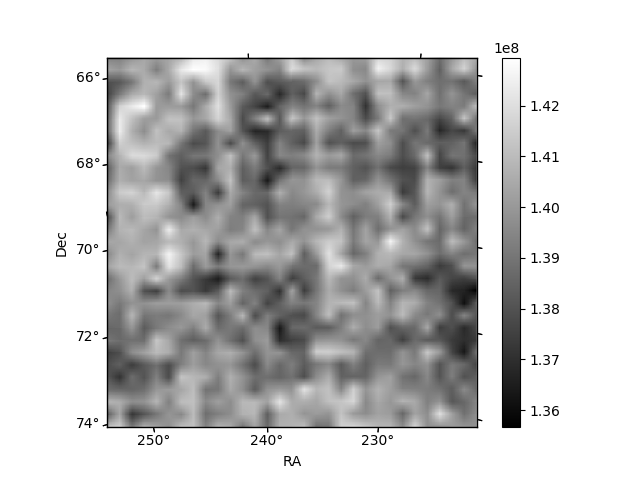
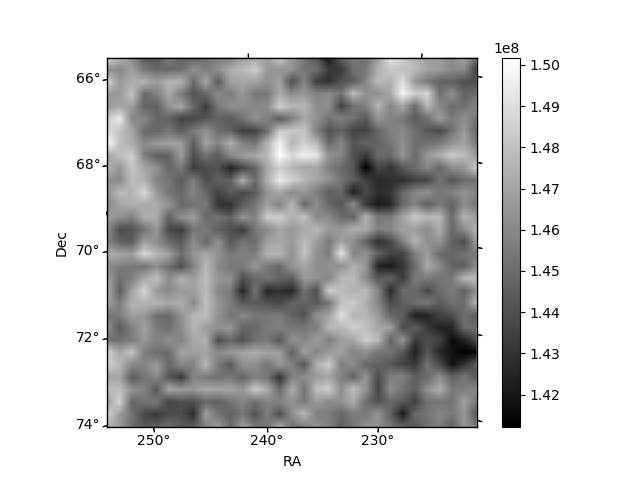
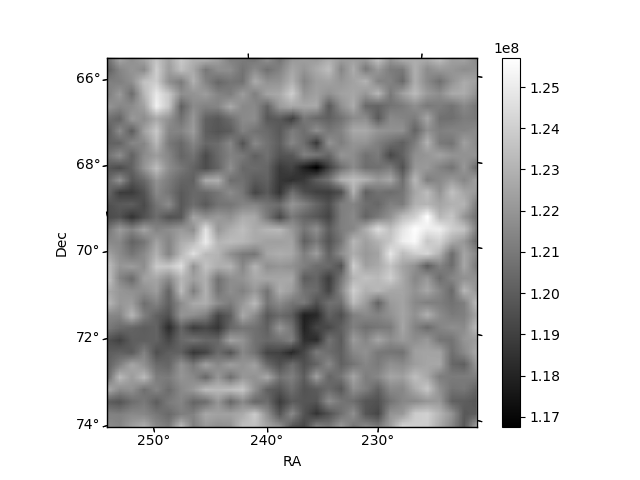
Histogram calculated using DETX and DETY for each event in the final _common_clean file
| Quadrant A | 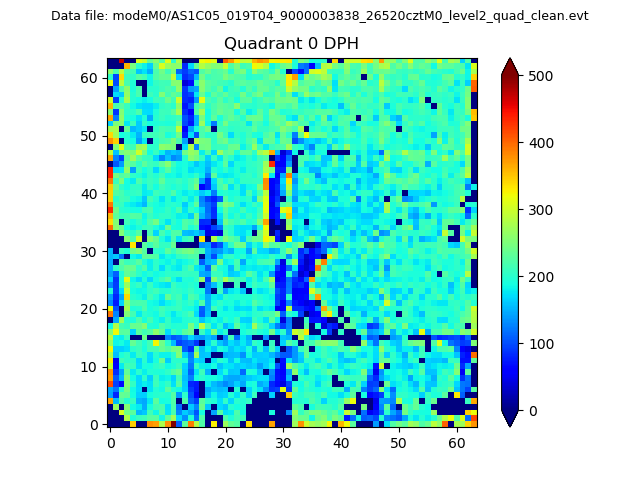 |
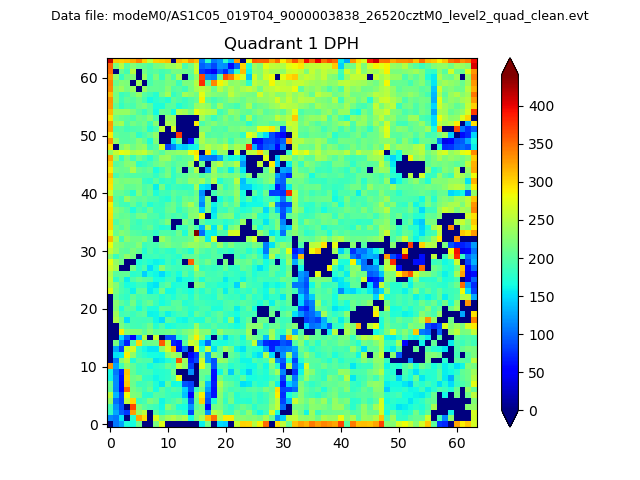 |
Quadrant B |
|---|---|---|---|
| Quadrant D | 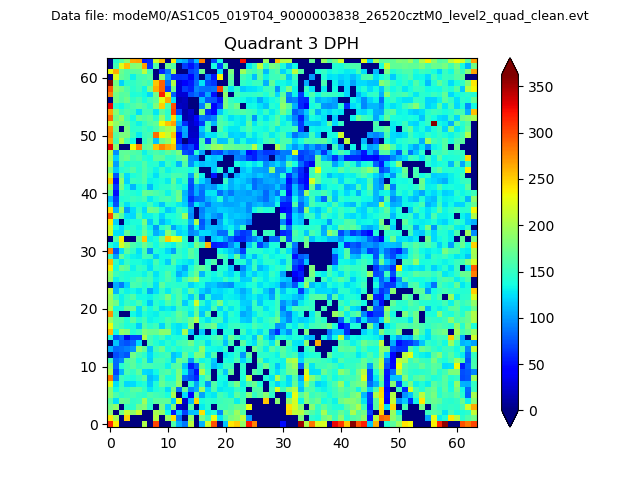 |
 |
Quadrant C |
| Plot type | Count rate plots | Images |
|---|---|---|
| Comparison with Poisson distribution Blue bars denote a histogram of data divided into 1 sec bins. Red curve is a Poisson curve with rate = median count rate of data. |
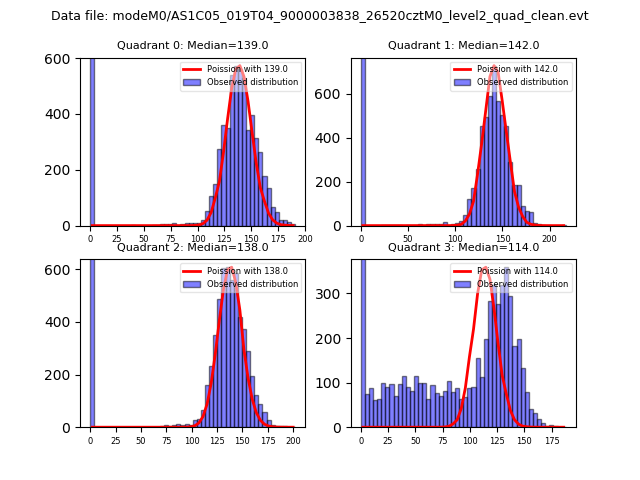 |
 |
| Quadrant-wise count rates Data is divided into 100 sec bins |
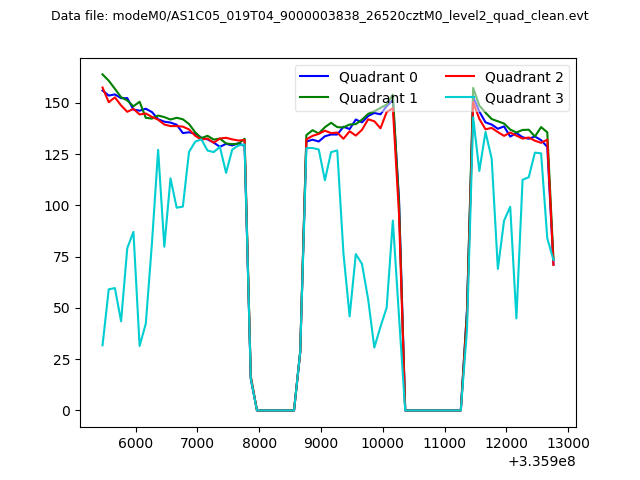 |
|
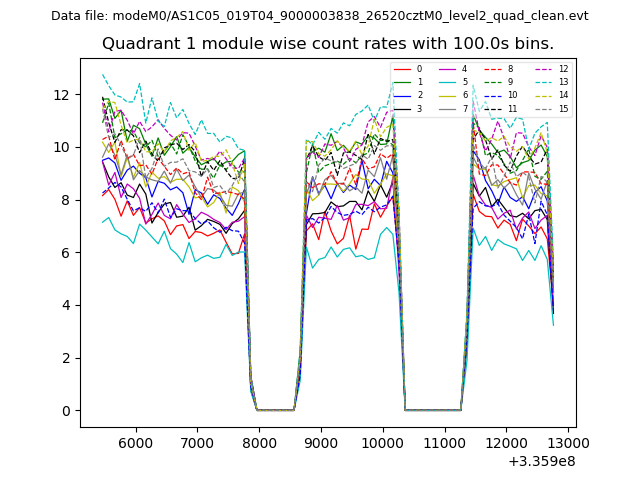
| Module-wise count rates for Quadrant A Data is divided into 100 sec bins |
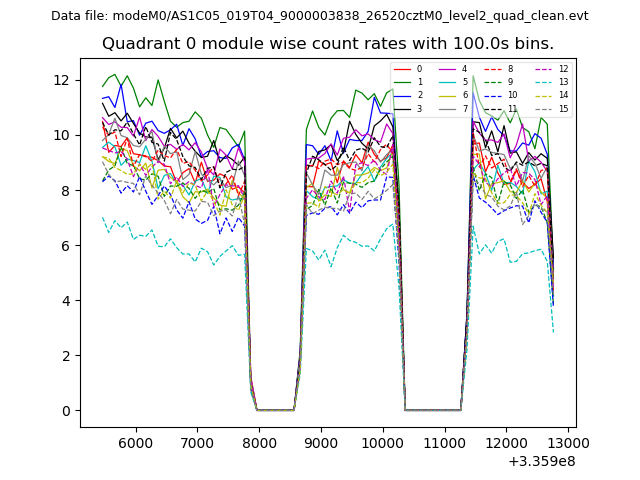 |
 |
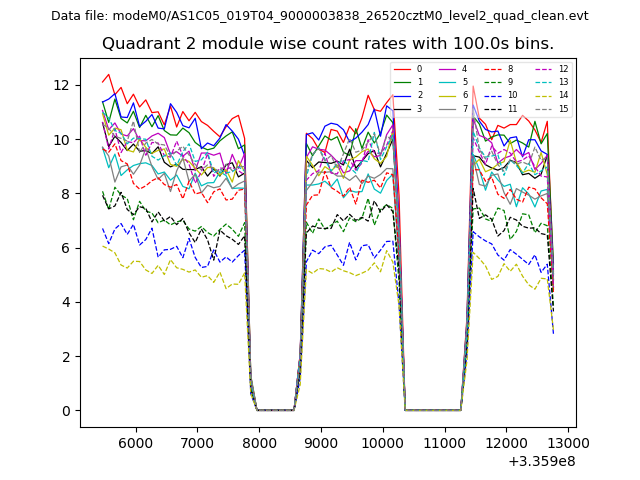
| Module-wise count rates for Quadrant B Data is divided into 100 sec bins |
 |
 |
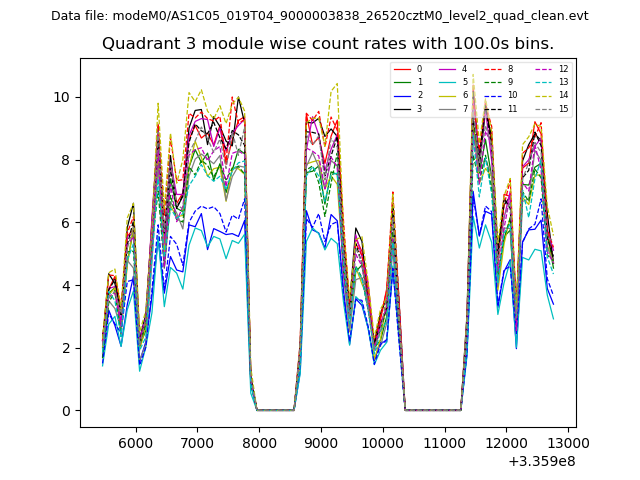
| Module-wise count rates for Quadrant C Data is divided into 100 sec bins |
 |
 |
| Module-wise count rates for Quadrant D Data is divided into 100 sec bins |
 |
 |
| Parameter | Plot |
|---|---|
| CZT HV Monitor | 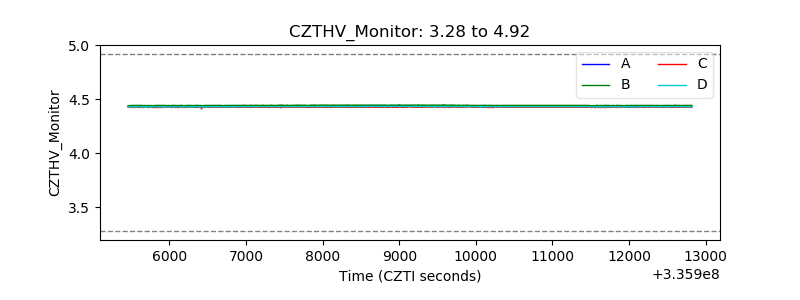 |
| D_VDD | 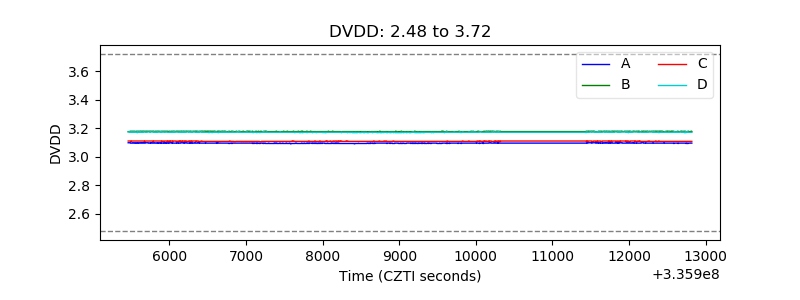 |
| Temperature 1 | 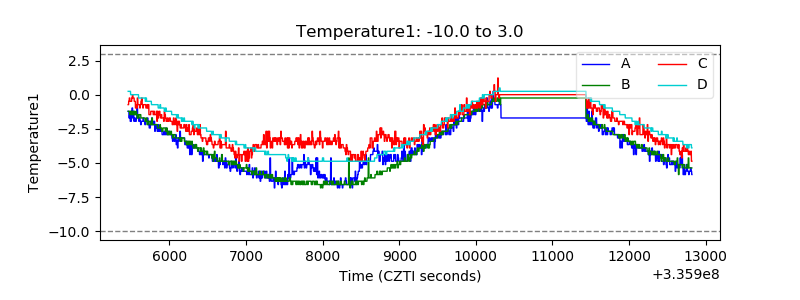 |
| Veto HV Monitor | 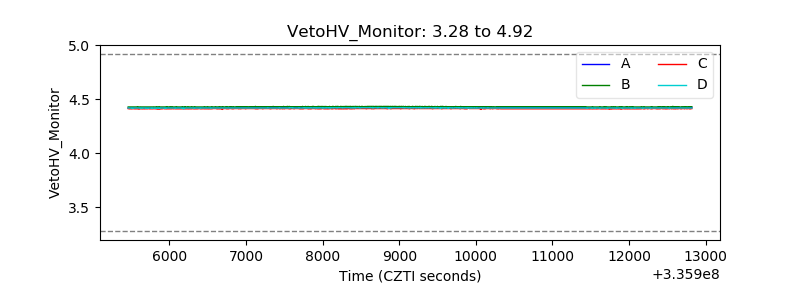 |
| Veto LLD | 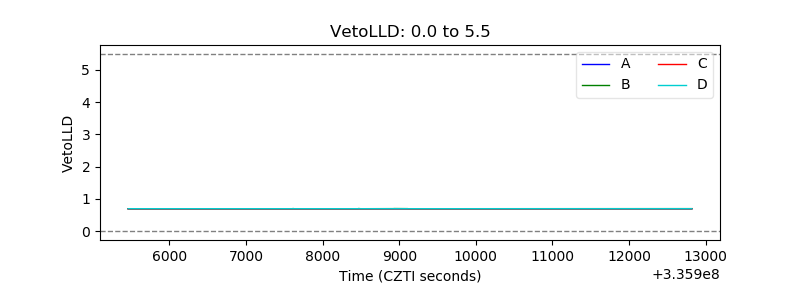 |
| Alpha Counter | 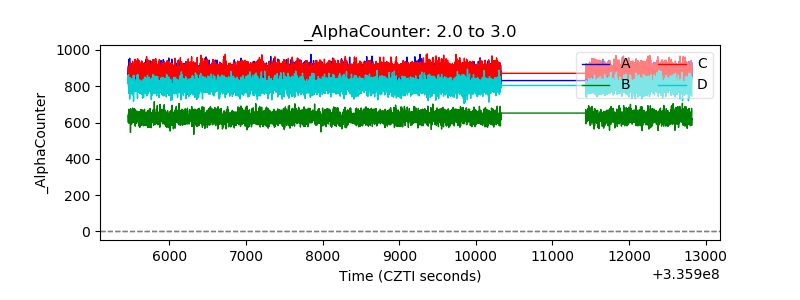 |
| _CPM_Rate | 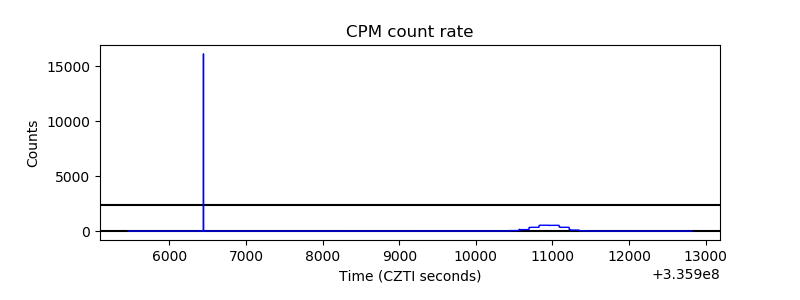 |
| CZT Counter |  |
| +2.5 Volts monitor |  |
| +5 Volts monitor | 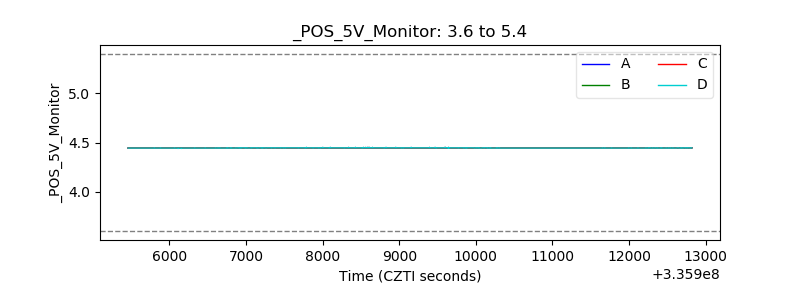 |
| _ROLL_ROT | 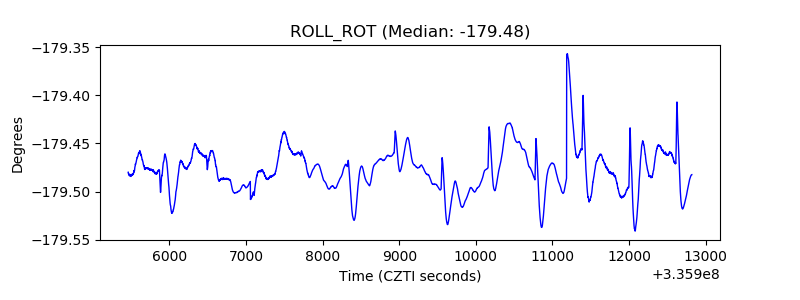 |
| _Roll_DEC | 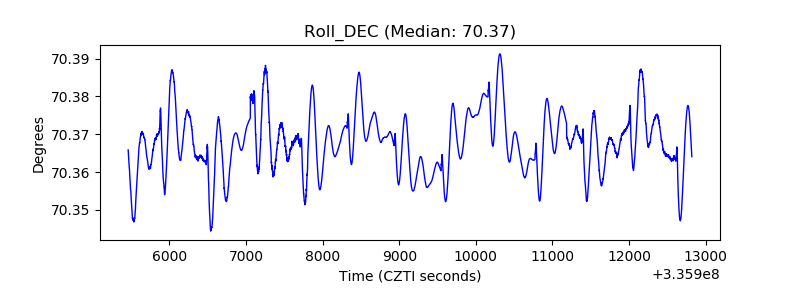 |
| _Roll_RA |  |
| Veto Counter | 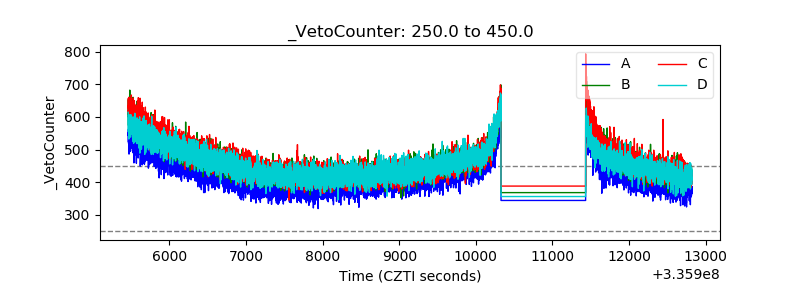 |