| Param | Original file | Final file |
|---|---|---|
| Filename | modeM0/AS1C05_019T04_9000003838_26521cztM0_level2.evt | modeM0/AS1C05_019T04_9000003838_26521cztM0_level2_quad_clean.evt |
| Size (bytes) | 589,253,760 | 120,332,160 |
| Size | 562.0 MB | 114.8 MB |
| Events in quadrant A | 3,452,395 | 815,820 |
| Events in quadrant B | 3,548,468 | 830,716 |
| Events in quadrant C | 3,834,779 | 800,479 |
| Events in quadrant D | 6,535,296 | 709,389 |
| Mode M9 | |||
|---|---|---|---|
| Quadrant | BADHDUFLAG | Total packets | Discarded packets |
| A | 0 | 11 | 0 |
| B | 0 | 12 | 0 |
| C | 0 | 12 | 0 |
| D | 0 | 12 | 0 |
| Mode M0 | |||
|---|---|---|---|
| Quadrant | BADHDUFLAG | Total packets | Discarded packets |
| A | 0 | 14914 | 0 |
| B | 0 | 15127 | 0 |
| C | 0 | 15988 | 0 |
| D | 0 | 24348 | 0 |
| Quadrant | Total seconds | Saturated seconds | Saturation percentage |
|---|---|---|---|
| A | 7001 | 61 | 0.871304% |
| B | 7001 | 103 | 1.471218% |
| C | 7001 | 171 | 2.442508% |
| D | 7001 | 1176 | 16.797600% |
Noise dominated data is calculated using 1-second bins in cleaned event files. If a bin has >2000 counts, and if more than 50% of those come from <1% of pixels, then it is considered to be noise-dominated and hence unusable.
| Quadrant | # 1 sec bins | Bins with >0 counts | Bins with >2000 counts | High rate bins dominated by noise | Noise dominated (total time) | Noise dominated (detector-on time) | Marked lightcurve |
|---|---|---|---|---|---|---|---|
| A | 7621 | 7002 | 16 | 16 | 0.21% | 0.23% | 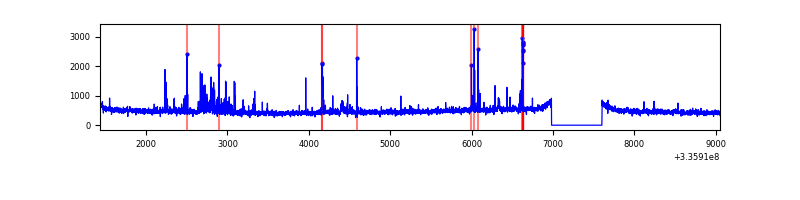 |
| B | 7621 | 7001 | 15 | 15 | 0.20% | 0.21% | 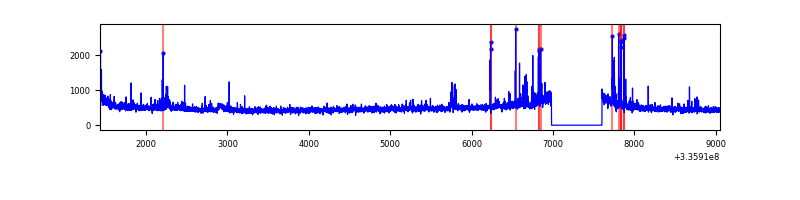 |
| C | 7621 | 7002 | 11 | 11 | 0.14% | 0.16% | 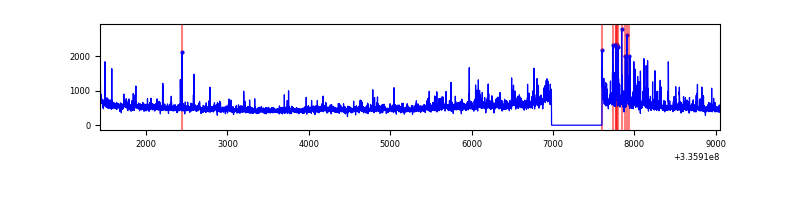 |
| D | 7621 | 7002 | 1018 | 1018 | 13.36% | 14.54% | 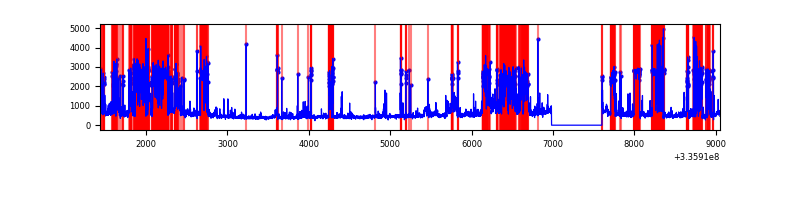 |
Top three noisy pixels from each quadrant. If the there are fewer than three noisy pixels in the level2.evt file, extra rows are filled as -1
| Pixel properties | Quadrant properties | ||||||
|---|---|---|---|---|---|---|---|
| Quadrant | DetID | PixID | Counts | Sigma | Mean | Median | Sigma |
| A | 0 | 13 | 210365 | 1255.37 | 834 | 815 | 166.9 |
| A | 6 | 16 | 18786 | 107.66 | 834 | 815 | 166.9 |
| A | 13 | 254 | 13377 | 75.26 | 834 | 815 | 166.9 |
| B | 5 | 172 | 108749 | 685.0 | 837 | 815 | 157.6 |
| B | 0 | 189 | 45298 | 282.31 | 837 | 815 | 157.6 |
| B | 3 | 112 | 35584 | 220.66 | 837 | 815 | 157.6 |
| C | 3 | 233 | 342358 | 1798.04 | 813 | 816 | 190.0 |
| C | 4 | 254 | 179556 | 940.97 | 813 | 816 | 190.0 |
| C | 14 | 238 | 129695 | 678.48 | 813 | 816 | 190.0 |
| D | 7 | 80 | 1736100 | 9253.48 | 755 | 736 | 187.5 |
| D | 1 | 52 | 1710815 | 9118.65 | 755 | 736 | 187.5 |
| D | 12 | 233 | 110631 | 585.99 | 755 | 736 | 187.5 |
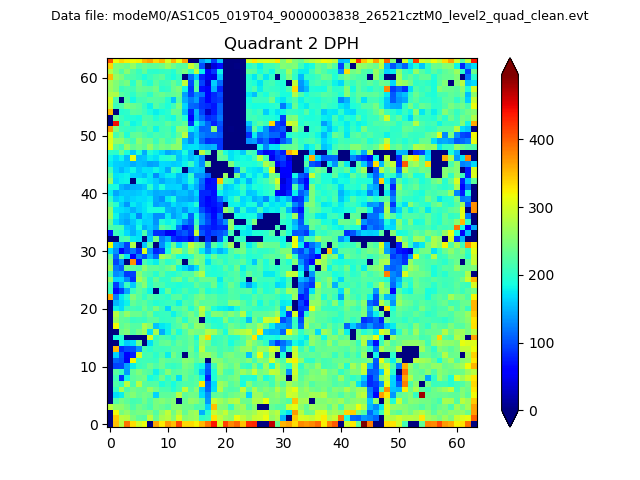
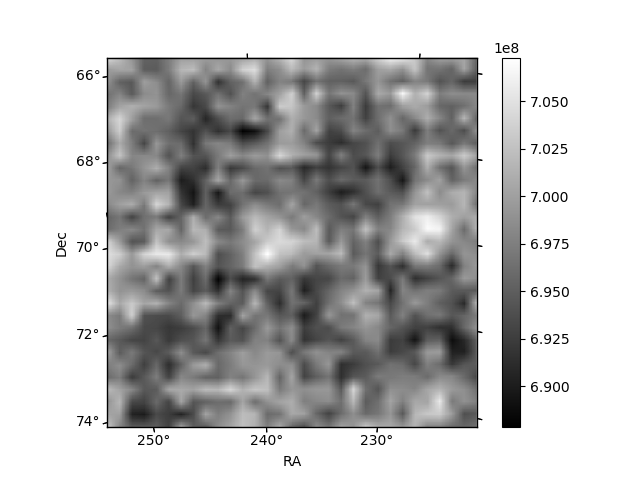
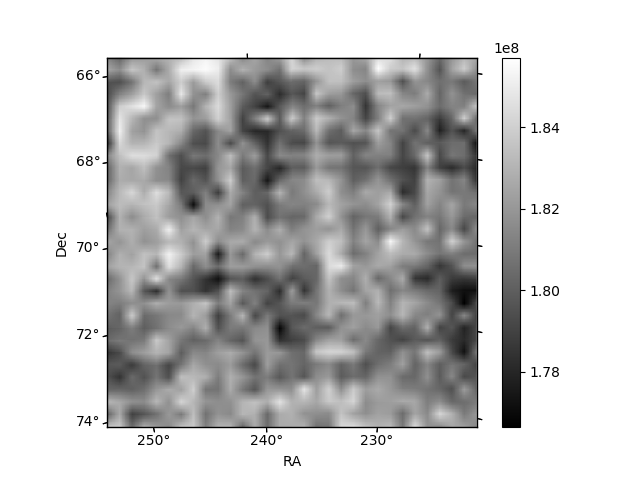
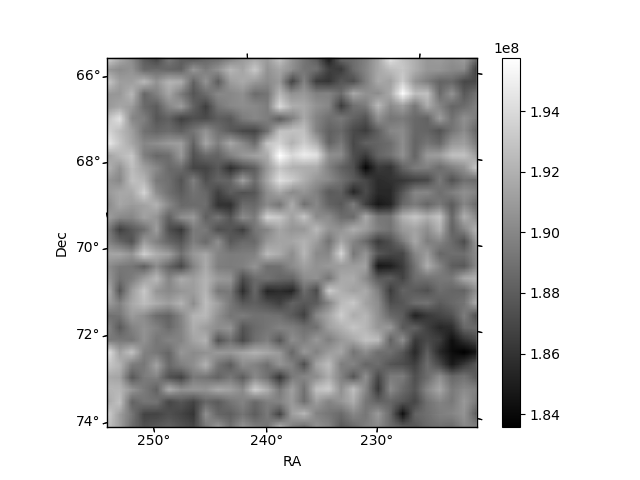
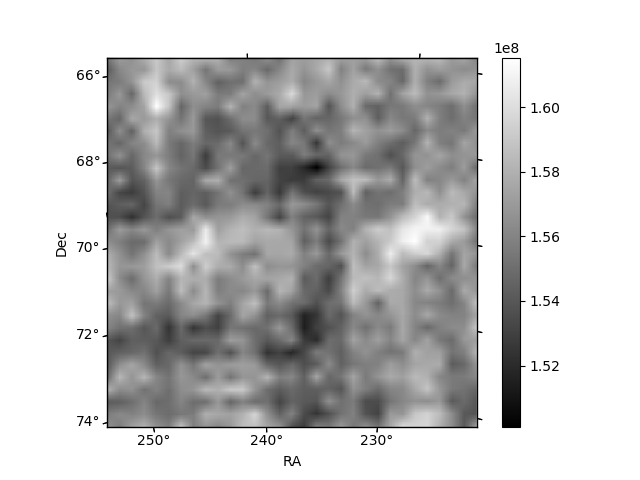
Histogram calculated using DETX and DETY for each event in the final _common_clean file
| Quadrant A | 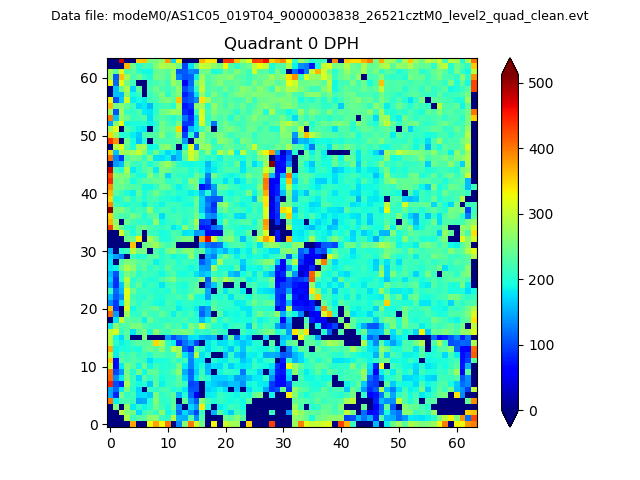 |
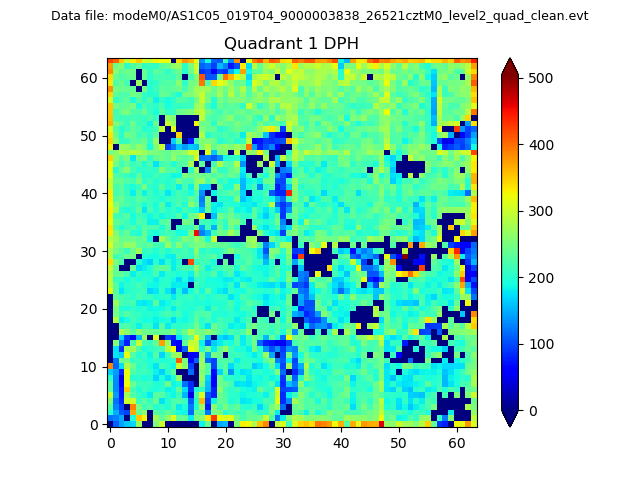 |
Quadrant B |
|---|---|---|---|
| Quadrant D | 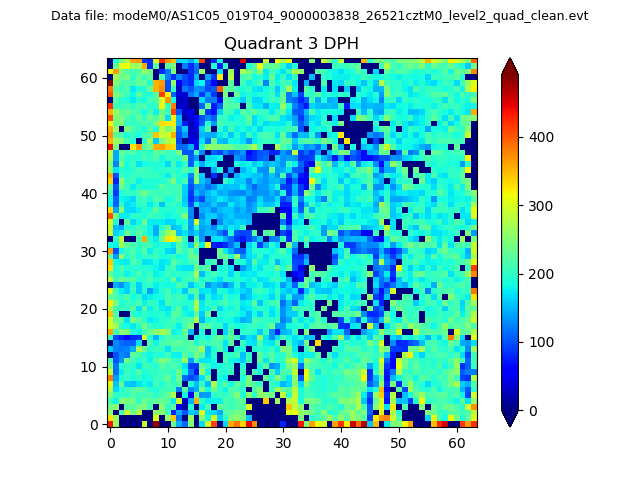 |
 |
Quadrant C |
| Plot type | Count rate plots | Images |
|---|---|---|
| Comparison with Poisson distribution Blue bars denote a histogram of data divided into 1 sec bins. Red curve is a Poisson curve with rate = median count rate of data. |
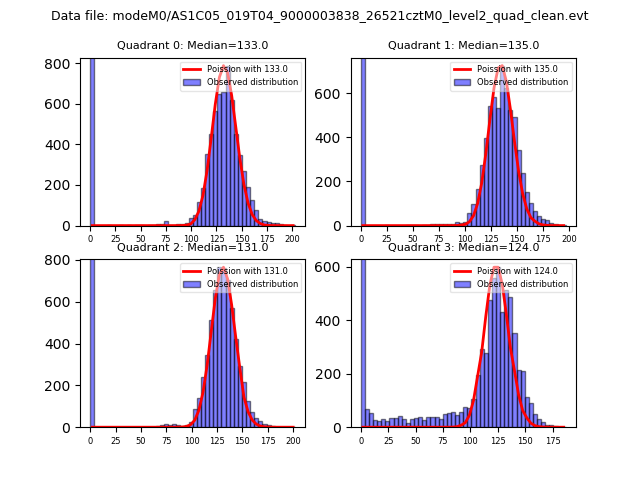 |
 |
| Quadrant-wise count rates Data is divided into 100 sec bins |
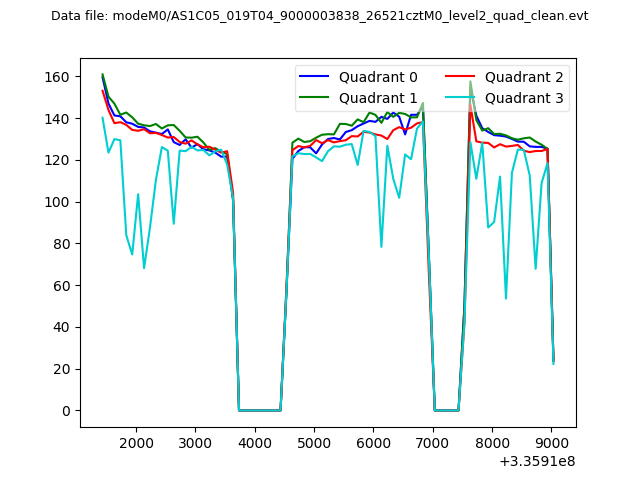 |
|
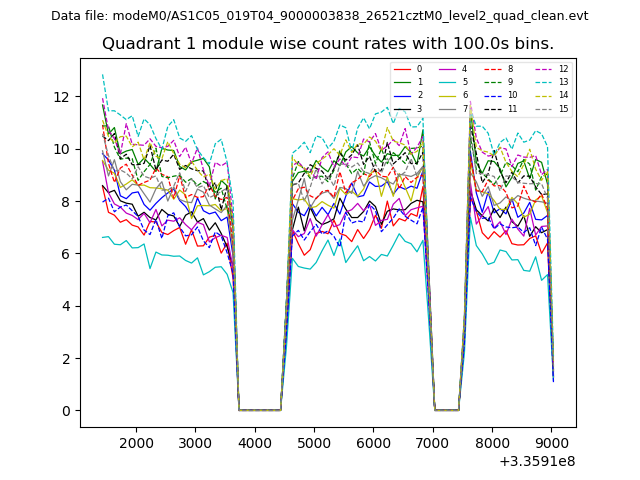
| Module-wise count rates for Quadrant A Data is divided into 100 sec bins |
 |
 |
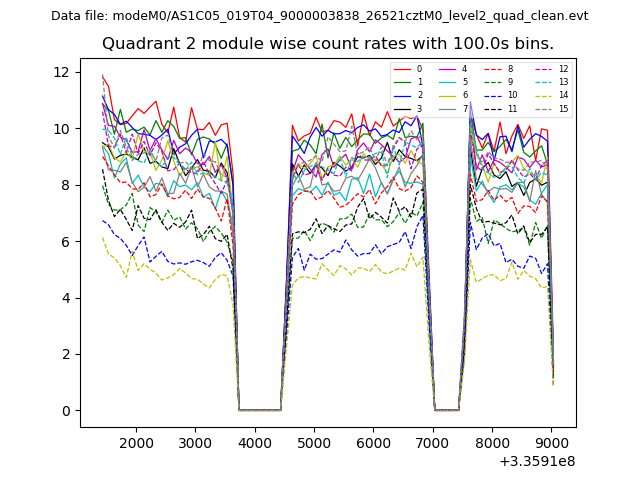
| Module-wise count rates for Quadrant B Data is divided into 100 sec bins |
 |
 |
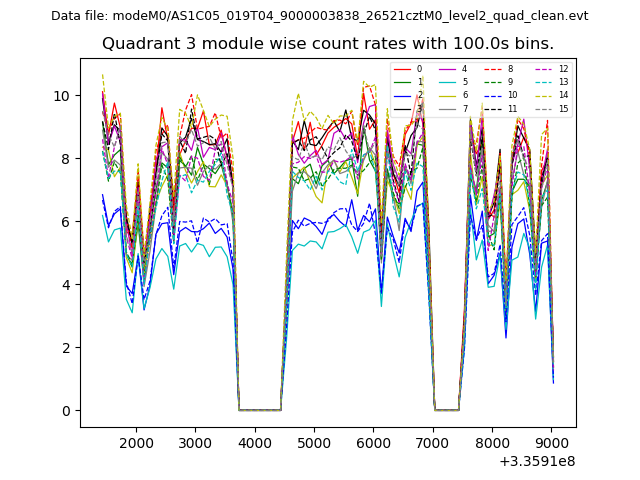
| Module-wise count rates for Quadrant C Data is divided into 100 sec bins |
 |
 |
| Module-wise count rates for Quadrant D Data is divided into 100 sec bins |
 |
 |
| Parameter | Plot |
|---|---|
| CZT HV Monitor | 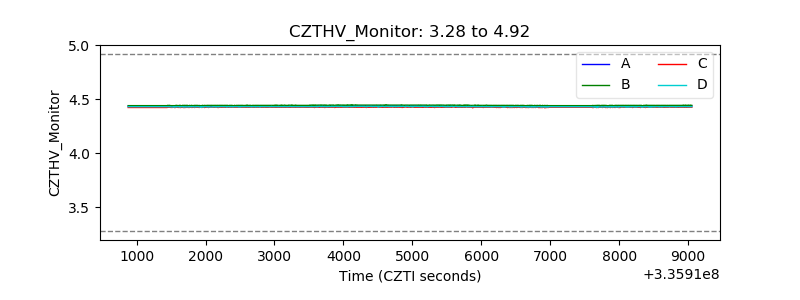 |
| D_VDD | 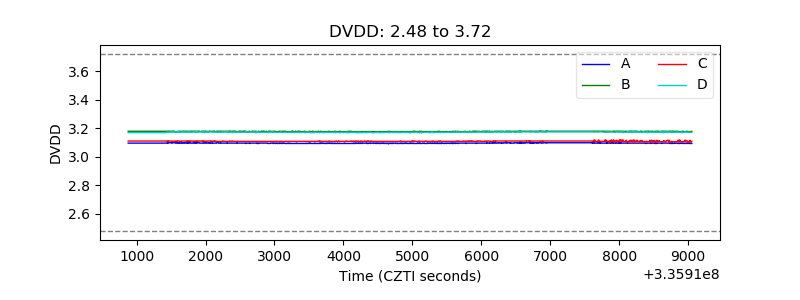 |
| Temperature 1 | 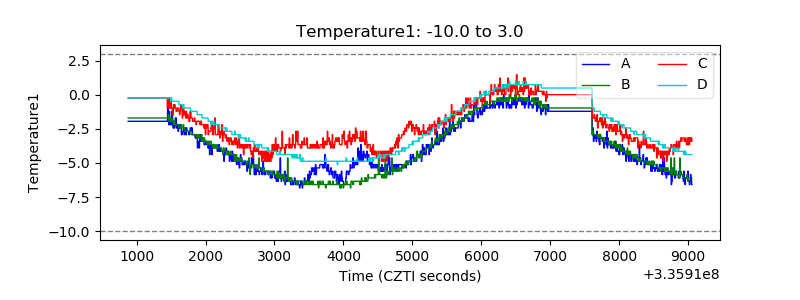 |
| Veto HV Monitor | 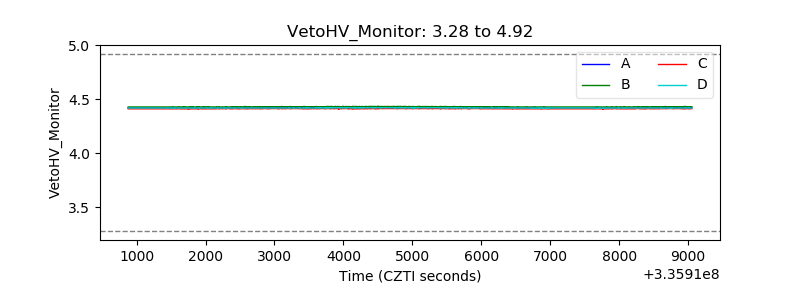 |
| Veto LLD | 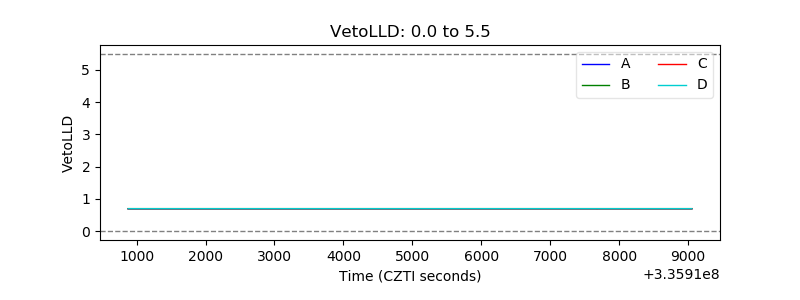 |
| Alpha Counter | 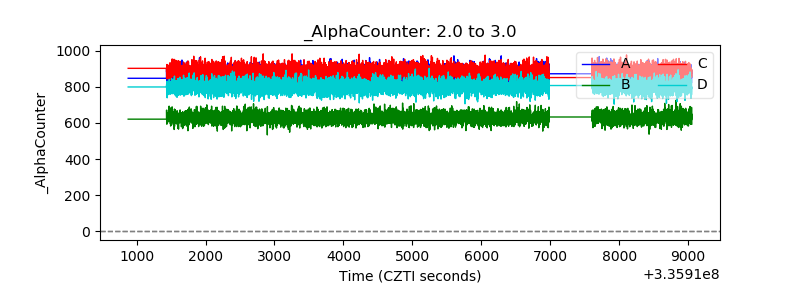 |
| _CPM_Rate | 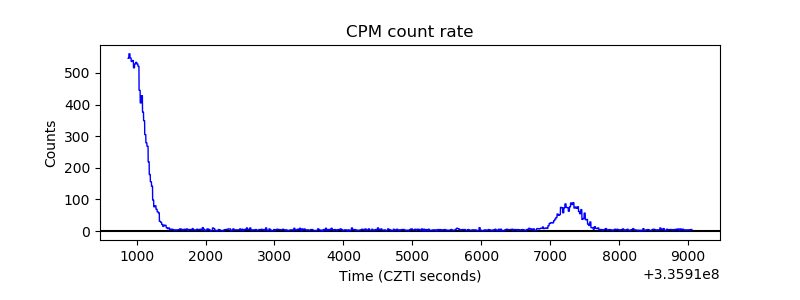 |
| CZT Counter | 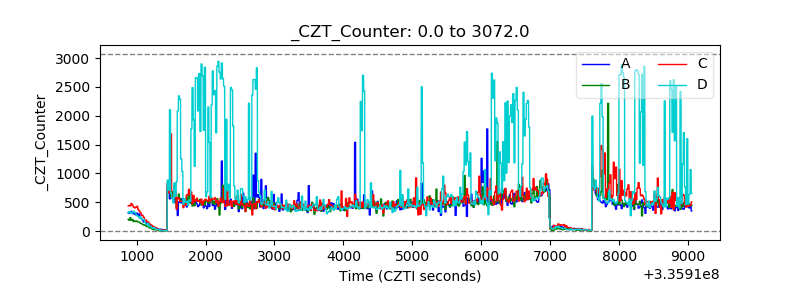 |
| +2.5 Volts monitor |  |
| +5 Volts monitor |  |
| _ROLL_ROT |  |
| _Roll_DEC | 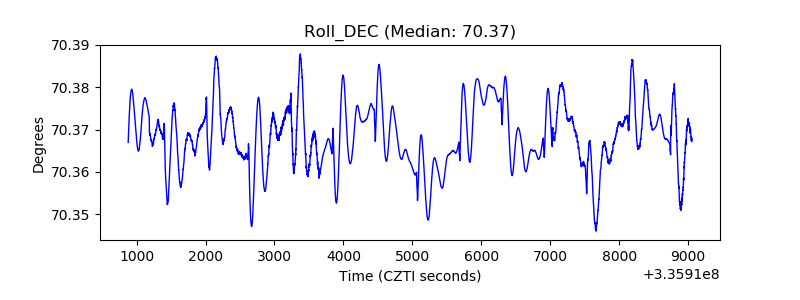 |
| _Roll_RA | 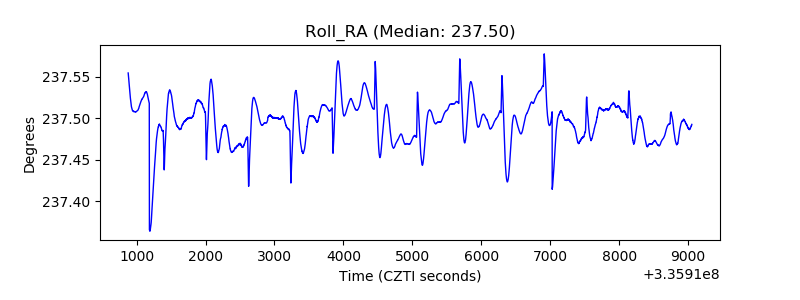 |
| Veto Counter |  |