| Param | Original file | Final file |
|---|---|---|
| Filename | modeM0/AS1C05_019T04_9000003838_26522cztM0_level2.evt | modeM0/AS1C05_019T04_9000003838_26522cztM0_level2_quad_clean.evt |
| Size (bytes) | 659,894,400 | 125,907,840 |
| Size | 629.3 MB | 120.1 MB |
| Events in quadrant A | 3,537,918 | 861,318 |
| Events in quadrant B | 3,789,451 | 872,274 |
| Events in quadrant C | 5,230,374 | 826,697 |
| Events in quadrant D | 6,915,755 | 727,170 |
| Mode M9 | |||
|---|---|---|---|
| Quadrant | BADHDUFLAG | Total packets | Discarded packets |
| A | 0 | 5 | 0 |
| B | 0 | 6 | 0 |
| C | 0 | 6 | 0 |
| D | 0 | 6 | 0 |
| Mode M0 | |||
|---|---|---|---|
| Quadrant | BADHDUFLAG | Total packets | Discarded packets |
| A | 0 | 15650 | 0 |
| B | 0 | 16330 | 0 |
| C | 0 | 20618 | 0 |
| D | 0 | 25675 | 0 |
| Quadrant | Total seconds | Saturated seconds | Saturation percentage |
|---|---|---|---|
| A | 7545 | 64 | 0.848244% |
| B | 7545 | 140 | 1.855533% |
| C | 7545 | 461 | 6.110007% |
| D | 7544 | 1275 | 16.900848% |
Noise dominated data is calculated using 1-second bins in cleaned event files. If a bin has >2000 counts, and if more than 50% of those come from <1% of pixels, then it is considered to be noise-dominated and hence unusable.
| Quadrant | # 1 sec bins | Bins with >0 counts | Bins with >2000 counts | High rate bins dominated by noise | Noise dominated (total time) | Noise dominated (detector-on time) | Marked lightcurve |
|---|---|---|---|---|---|---|---|
| A | 7825 | 7547 | 12 | 12 | 0.15% | 0.16% | 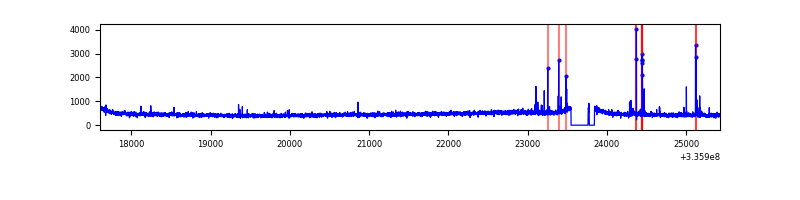 |
| B | 7825 | 7547 | 33 | 33 | 0.42% | 0.44% |  |
| C | 7825 | 7547 | 125 | 125 | 1.60% | 1.66% | 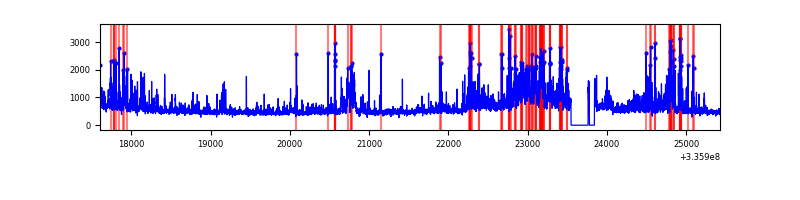 |
| D | 7824 | 7545 | 1097 | 1097 | 14.02% | 14.54% | 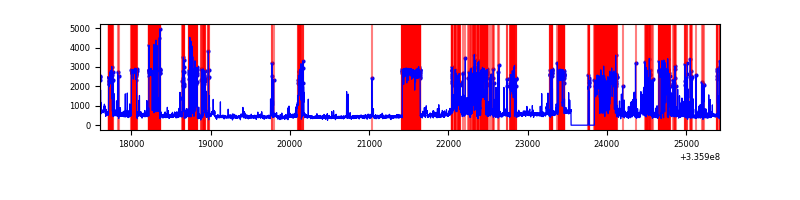 |
Top three noisy pixels from each quadrant. If the there are fewer than three noisy pixels in the level2.evt file, extra rows are filled as -1
| Pixel properties | Quadrant properties | ||||||
|---|---|---|---|---|---|---|---|
| Quadrant | DetID | PixID | Counts | Sigma | Mean | Median | Sigma |
| A | 0 | 13 | 81943 | 452.33 | 894 | 876 | 179.2 |
| A | 13 | 254 | 13687 | 71.48 | 894 | 876 | 179.2 |
| A | 3 | 137 | 7968 | 39.57 | 894 | 876 | 179.2 |
| B | 5 | 172 | 148024 | 876.61 | 894 | 869 | 167.9 |
| B | 3 | 112 | 46691 | 272.96 | 894 | 869 | 167.9 |
| B | 0 | 244 | 27639 | 159.47 | 894 | 869 | 167.9 |
| C | 3 | 233 | 1029706 | 5107.03 | 858 | 862 | 201.5 |
| C | 4 | 254 | 694298 | 3442.11 | 858 | 862 | 201.5 |
| C | 14 | 238 | 134386 | 662.79 | 858 | 862 | 201.5 |
| D | 1 | 52 | 2055398 | 10717.54 | 782 | 762 | 191.7 |
| D | 7 | 80 | 1675470 | 8735.73 | 782 | 762 | 191.7 |
| D | 12 | 233 | 101627 | 526.14 | 782 | 762 | 191.7 |
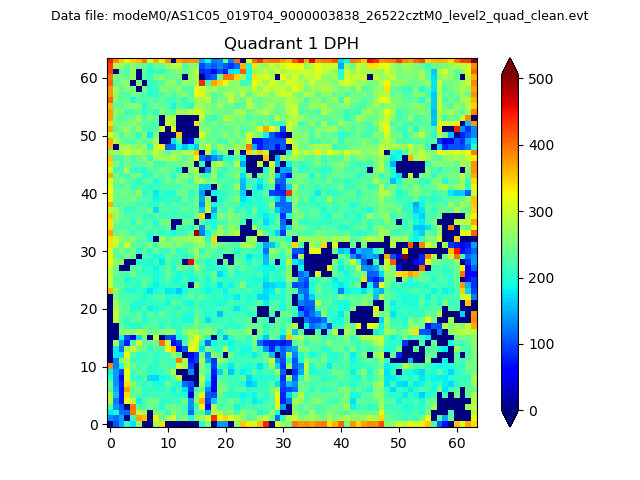
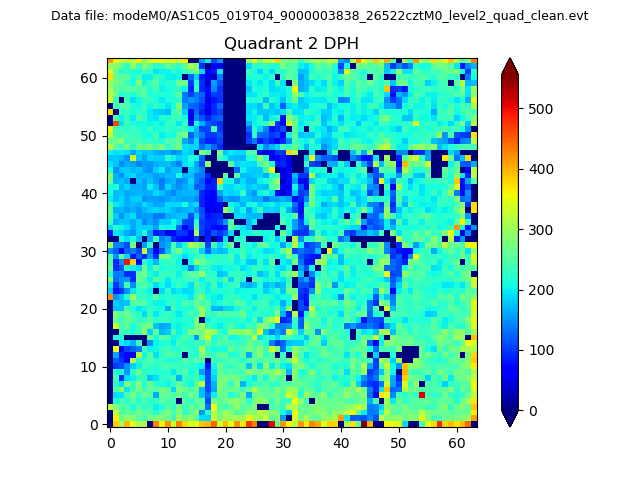
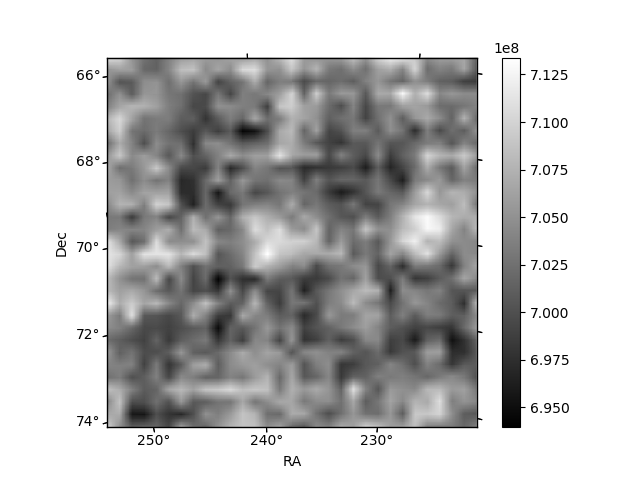
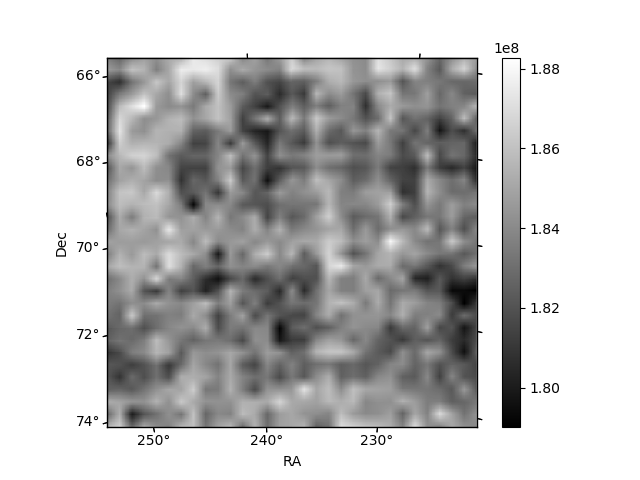
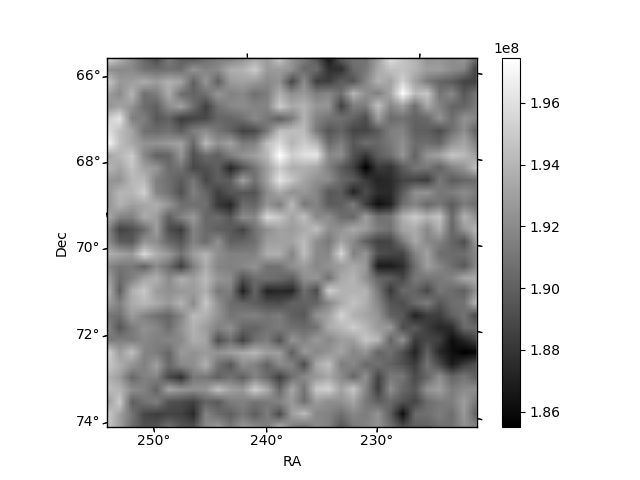
Histogram calculated using DETX and DETY for each event in the final _common_clean file
| Quadrant A | 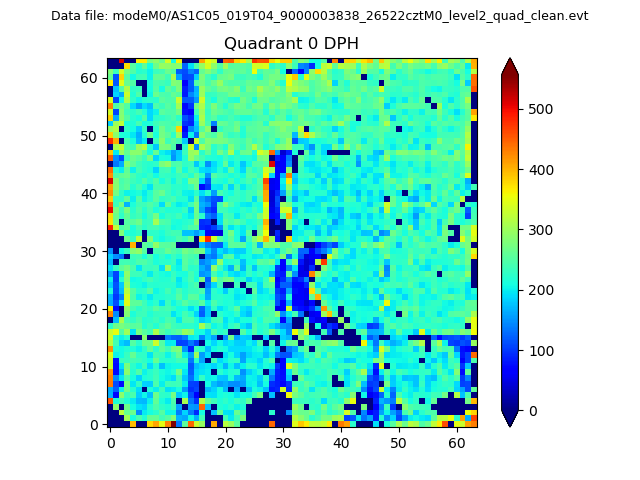 |
 |
Quadrant B |
|---|---|---|---|
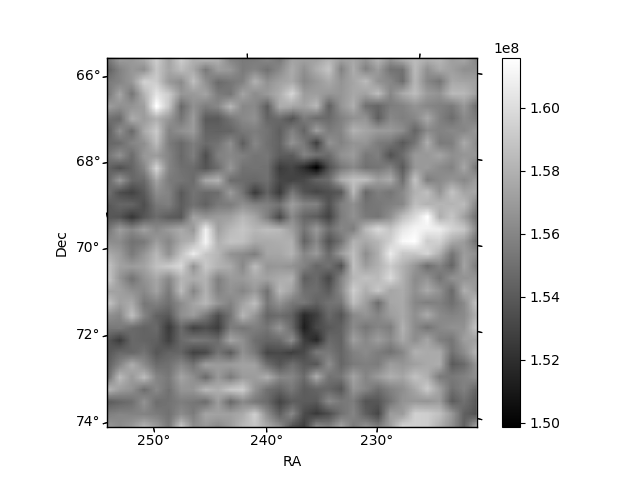
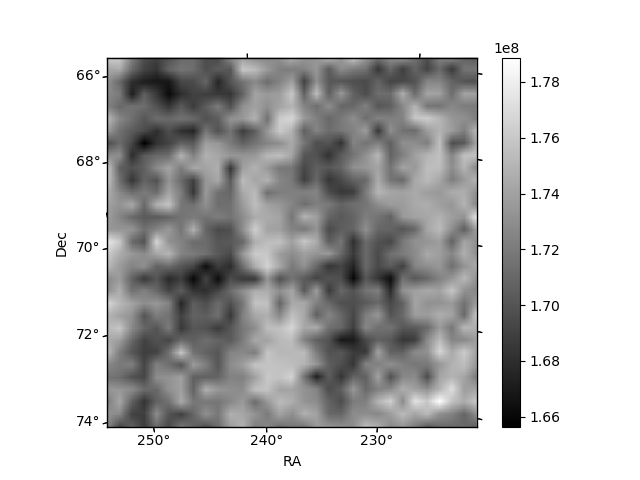
| Quadrant D | 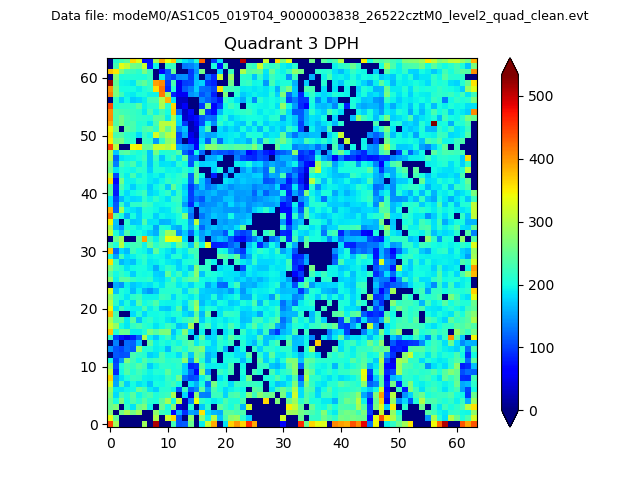 |
 |
Quadrant C |
| Plot type | Count rate plots | Images |
|---|---|---|
| Comparison with Poisson distribution Blue bars denote a histogram of data divided into 1 sec bins. Red curve is a Poisson curve with rate = median count rate of data. |
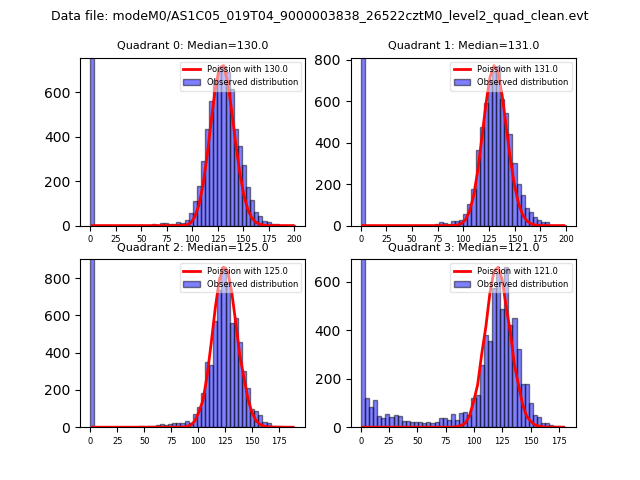 |
 |
| Quadrant-wise count rates Data is divided into 100 sec bins |
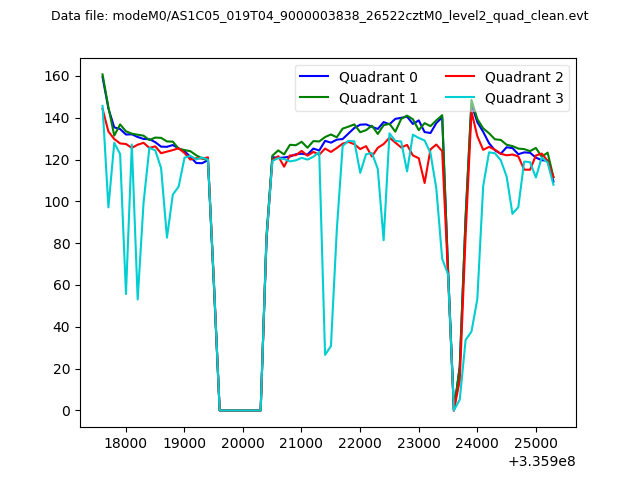 |
|
| Module-wise count rates for Quadrant A Data is divided into 100 sec bins |
 |
 |
| Module-wise count rates for Quadrant B Data is divided into 100 sec bins |
 |
 |
| Module-wise count rates for Quadrant C Data is divided into 100 sec bins |
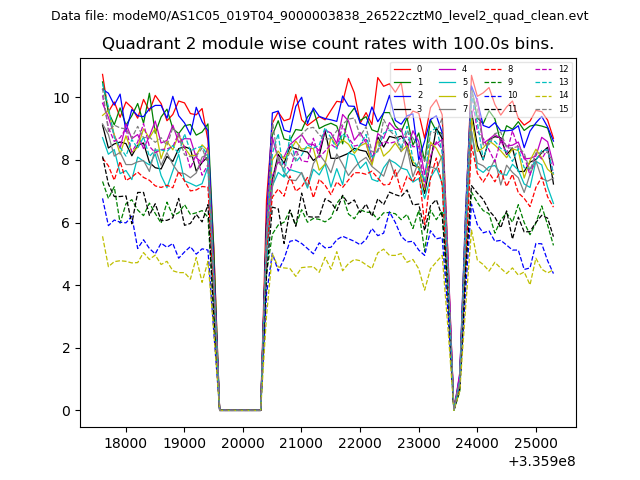 |
 |
| Module-wise count rates for Quadrant D Data is divided into 100 sec bins |
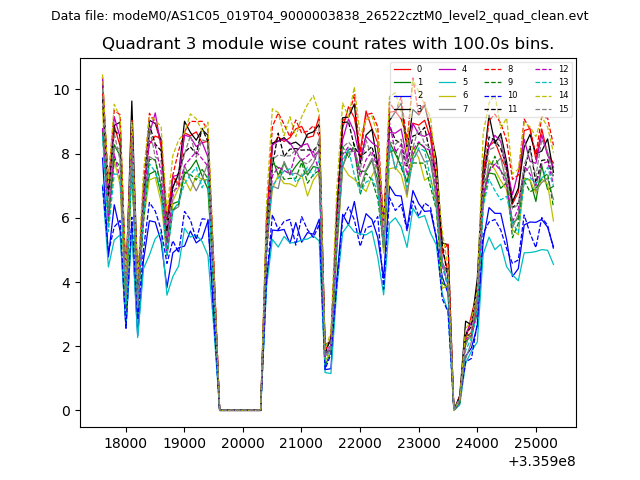 |
 |
| Parameter | Plot |
|---|---|
| CZT HV Monitor | 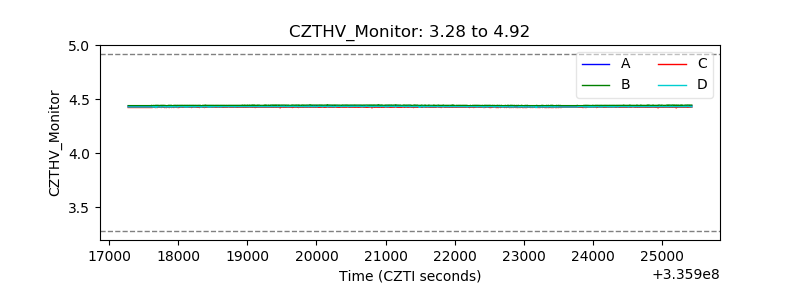 |
| D_VDD | 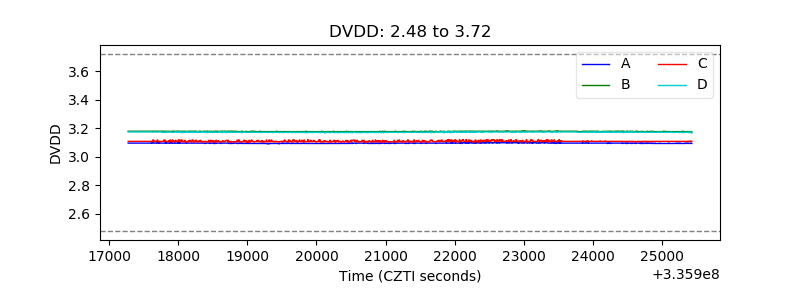 |
| Temperature 1 | 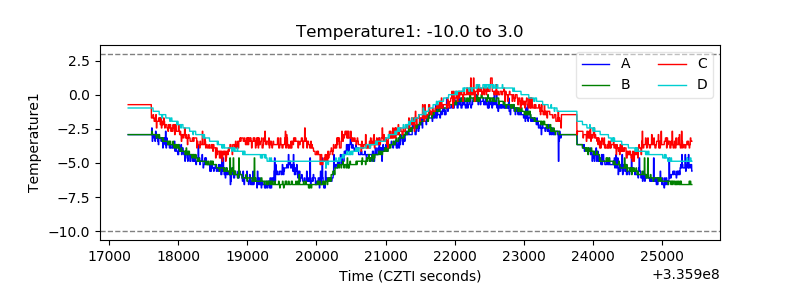 |
| Veto HV Monitor | 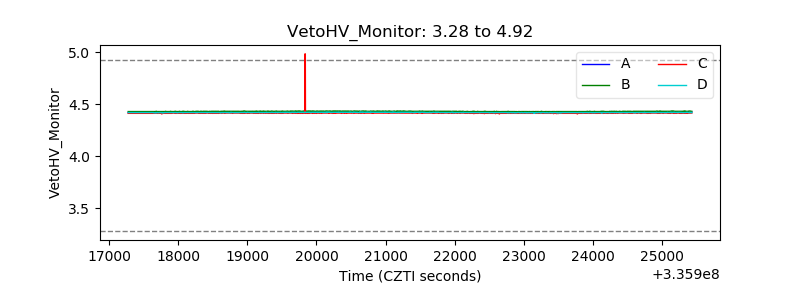 |
| Veto LLD |  |
| Alpha Counter | 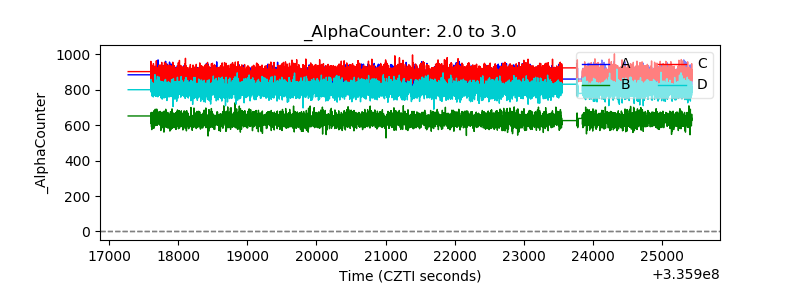 |
| _CPM_Rate | 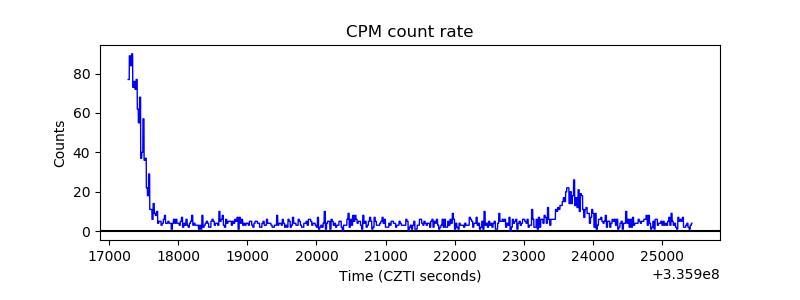 |
| CZT Counter | 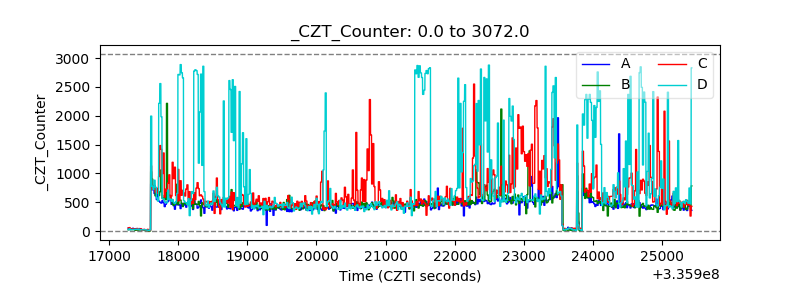 |
| +2.5 Volts monitor |  |
| +5 Volts monitor |  |
| _ROLL_ROT | 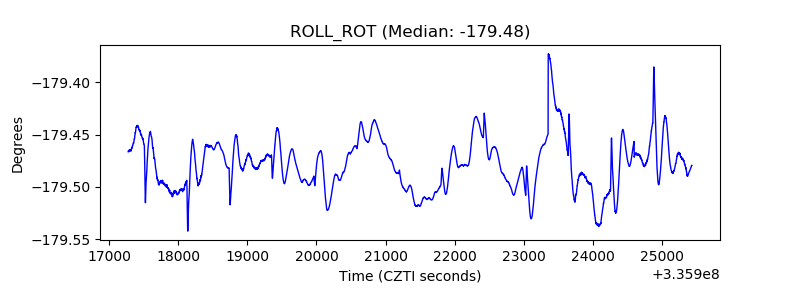 |
| _Roll_DEC | 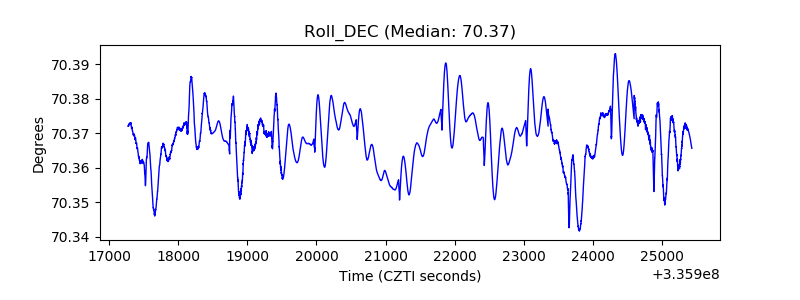 |
| _Roll_RA | 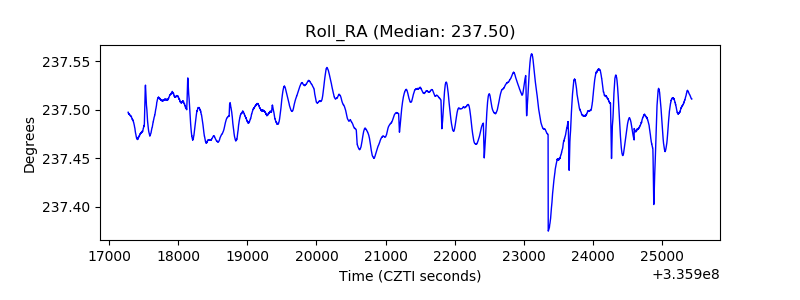 |
| Veto Counter |  |