| Param | Original file | Final file |
|---|---|---|
| Filename | modeM0/AS1C05_019T04_9000003838_26523cztM0_level2.evt | modeM0/AS1C05_019T04_9000003838_26523cztM0_level2_quad_clean.evt |
| Size (bytes) | 724,484,160 | 117,823,680 |
| Size | 690.9 MB | 112.4 MB |
| Events in quadrant A | 3,555,968 | 798,114 |
| Events in quadrant B | 3,759,066 | 812,831 |
| Events in quadrant C | 5,142,588 | 769,592 |
| Events in quadrant D | 8,958,582 | 647,630 |
| Mode M9 | |||
|---|---|---|---|
| Quadrant | BADHDUFLAG | Total packets | Discarded packets |
| A | 0 | 2 | 0 |
| B | 0 | 3 | 0 |
| C | 0 | 3 | 0 |
| D | 0 | 3 | 0 |
| Mode M0 | |||
|---|---|---|---|
| Quadrant | BADHDUFLAG | Total packets | Discarded packets |
| A | 0 | 15901 | 0 |
| B | 0 | 16336 | 0 |
| C | 0 | 20379 | 0 |
| D | 0 | 31936 | 0 |
| Quadrant | Total seconds | Saturated seconds | Saturation percentage |
|---|---|---|---|
| A | 7747 | 60 | 0.774493% |
| B | 7747 | 100 | 1.290822% |
| C | 7747 | 392 | 5.060023% |
| D | 7747 | 1824 | 23.544598% |
Noise dominated data is calculated using 1-second bins in cleaned event files. If a bin has >2000 counts, and if more than 50% of those come from <1% of pixels, then it is considered to be noise-dominated and hence unusable.
| Quadrant | # 1 sec bins | Bins with >0 counts | Bins with >2000 counts | High rate bins dominated by noise | Noise dominated (total time) | Noise dominated (detector-on time) | Marked lightcurve |
|---|---|---|---|---|---|---|---|
| A | 8093 | 7749 | 9 | 9 | 0.11% | 0.12% | 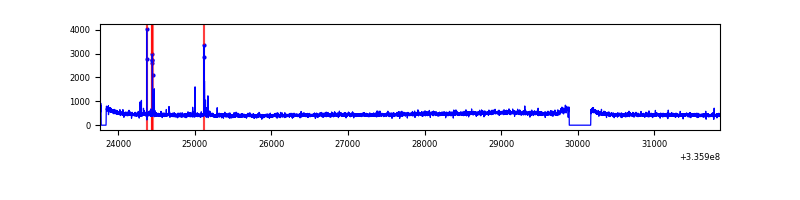 |
| B | 8093 | 7749 | 8 | 8 | 0.10% | 0.10% | 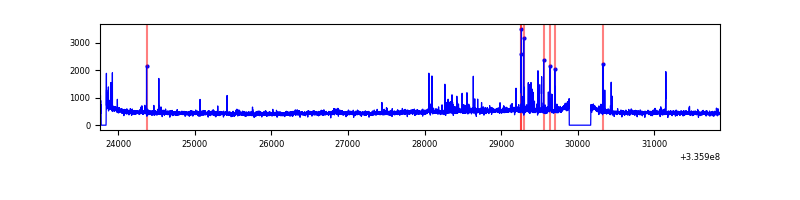 |
| C | 8093 | 7749 | 122 | 122 | 1.51% | 1.57% | 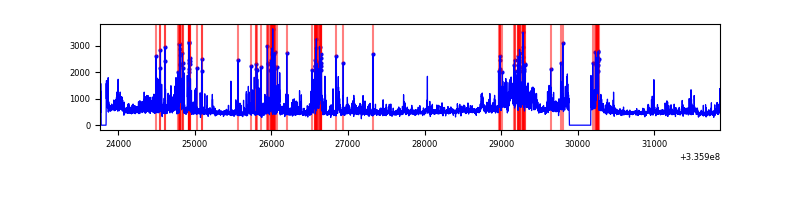 |
| D | 8093 | 7747 | 1513 | 1513 | 18.70% | 19.53% | 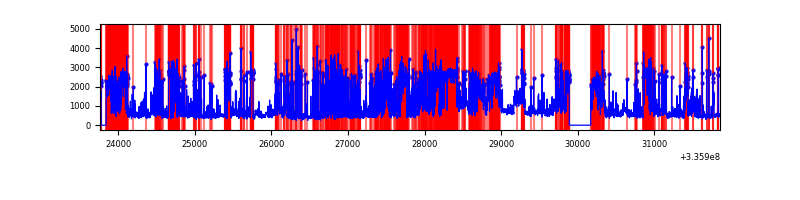 |
Top three noisy pixels from each quadrant. If the there are fewer than three noisy pixels in the level2.evt file, extra rows are filled as -1
| Pixel properties | Quadrant properties | ||||||
|---|---|---|---|---|---|---|---|
| Quadrant | DetID | PixID | Counts | Sigma | Mean | Median | Sigma |
| A | 0 | 13 | 52862 | 286.3 | 907 | 887 | 181.5 |
| A | 13 | 254 | 12731 | 65.24 | 907 | 887 | 181.5 |
| A | 3 | 137 | 8286 | 40.76 | 907 | 887 | 181.5 |
| B | 5 | 172 | 84152 | 483.6 | 911 | 886 | 172.2 |
| B | 3 | 112 | 31593 | 178.34 | 911 | 886 | 172.2 |
| B | 0 | 244 | 28379 | 159.68 | 911 | 886 | 172.2 |
| C | 4 | 254 | 827880 | 4034.57 | 873 | 876 | 205.0 |
| C | 3 | 233 | 753767 | 3673.0 | 873 | 876 | 205.0 |
| C | 14 | 238 | 138745 | 672.6 | 873 | 876 | 205.0 |
| D | 1 | 52 | 3376495 | 17754.82 | 777 | 757 | 190.1 |
| D | 7 | 80 | 2287365 | 12026.5 | 777 | 757 | 190.1 |
| D | 12 | 233 | 225116 | 1180.02 | 777 | 757 | 190.1 |
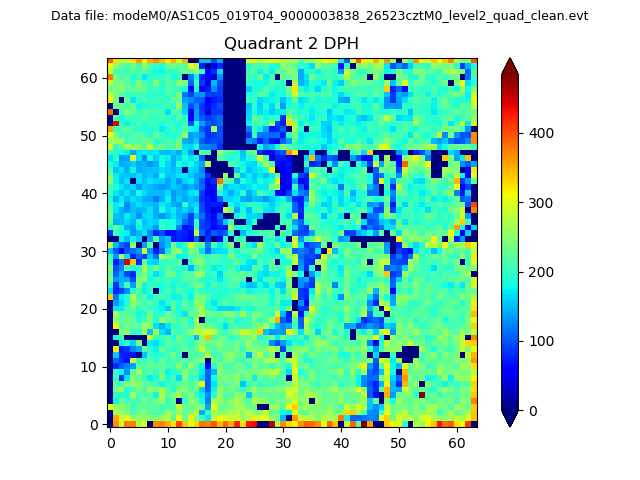
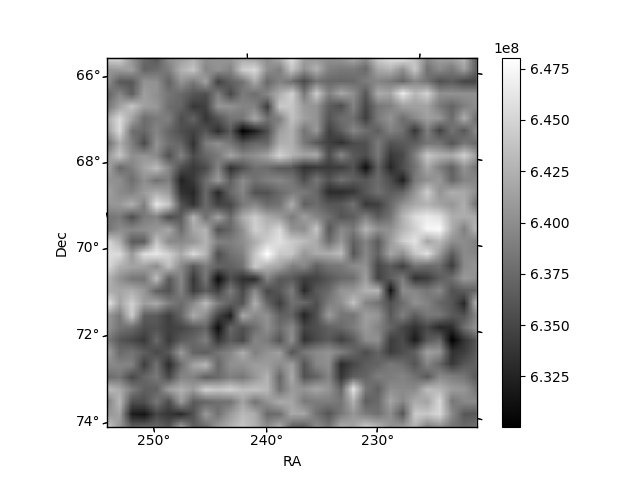
Histogram calculated using DETX and DETY for each event in the final _common_clean file
| Quadrant A | 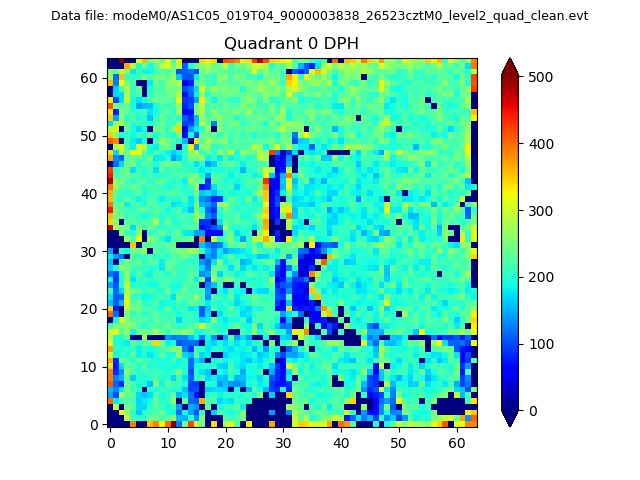 |
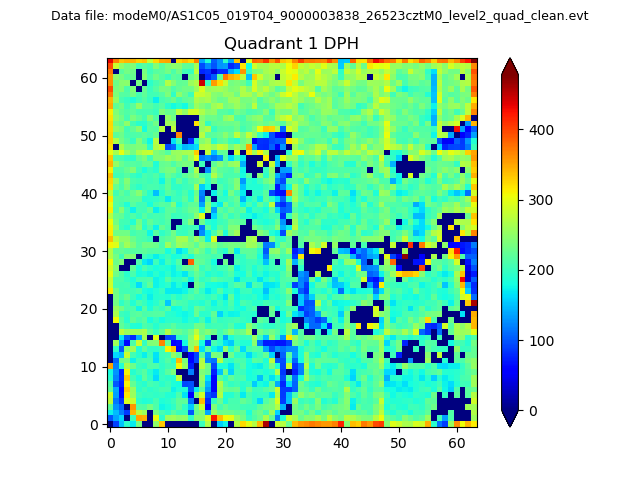 |
Quadrant B |
|---|---|---|---|
| Quadrant D | 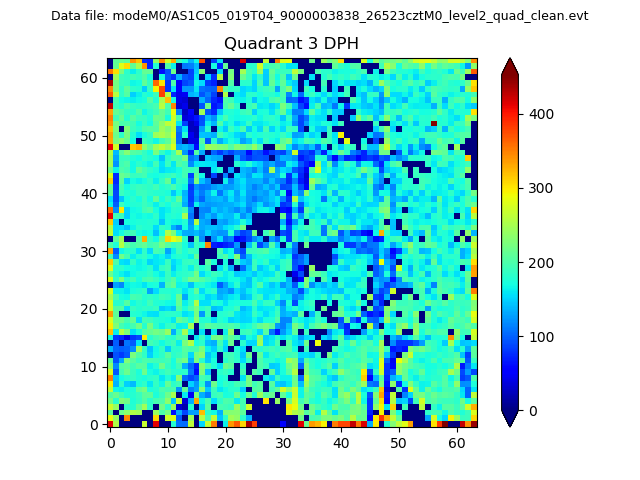 |
 |
Quadrant C |
| Plot type | Count rate plots | Images |
|---|---|---|
| Comparison with Poisson distribution Blue bars denote a histogram of data divided into 1 sec bins. Red curve is a Poisson curve with rate = median count rate of data. |
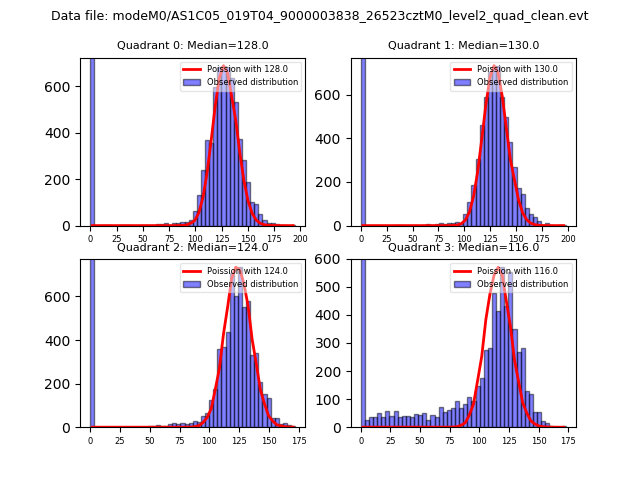 |
 |
| Quadrant-wise count rates Data is divided into 100 sec bins |
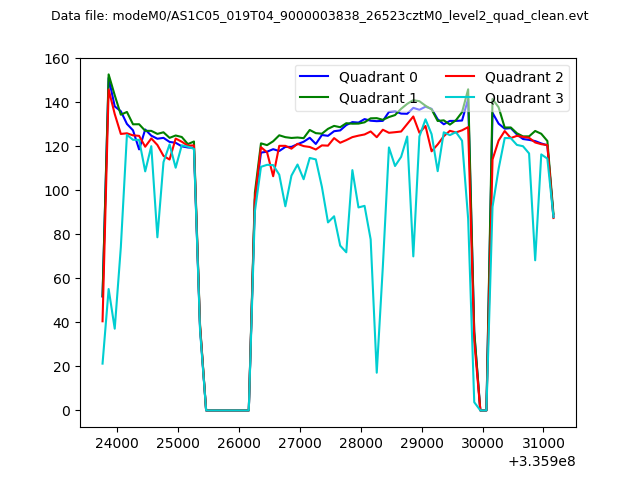 |
|
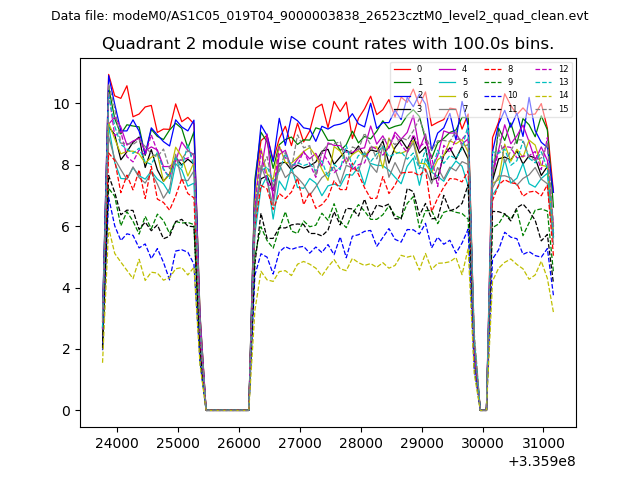
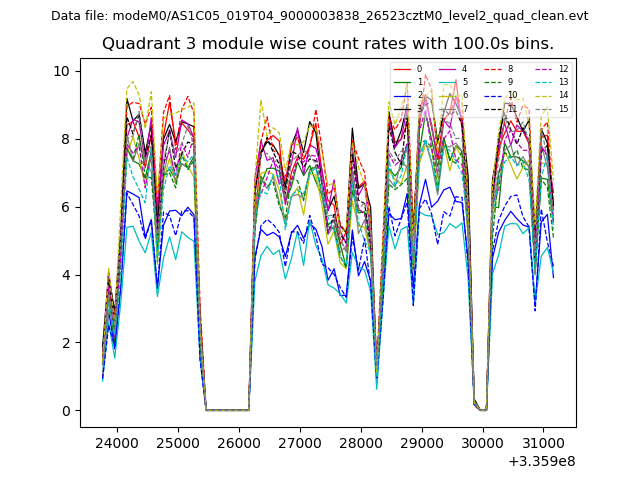
| Module-wise count rates for Quadrant A Data is divided into 100 sec bins |
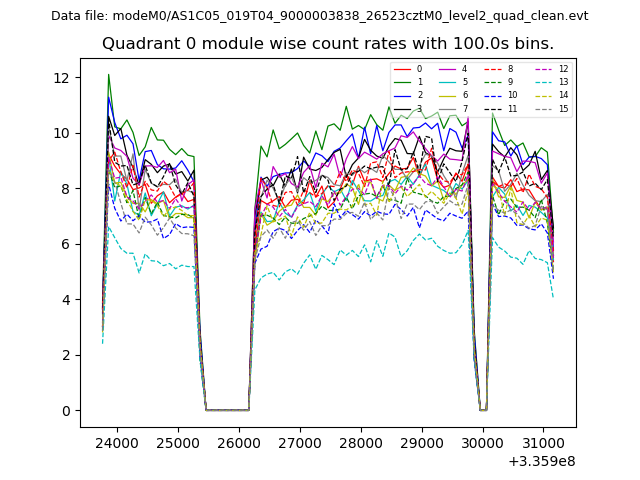 |
 |
| Module-wise count rates for Quadrant B Data is divided into 100 sec bins |
 |
 |
| Module-wise count rates for Quadrant C Data is divided into 100 sec bins |
 |
 |
| Module-wise count rates for Quadrant D Data is divided into 100 sec bins |
 |
 |
| Parameter | Plot |
|---|---|
| CZT HV Monitor | 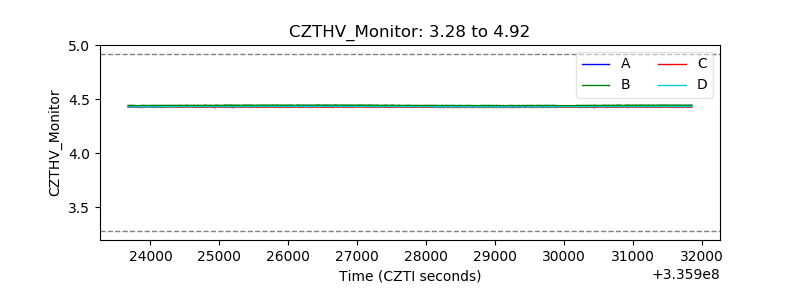 |
| D_VDD | 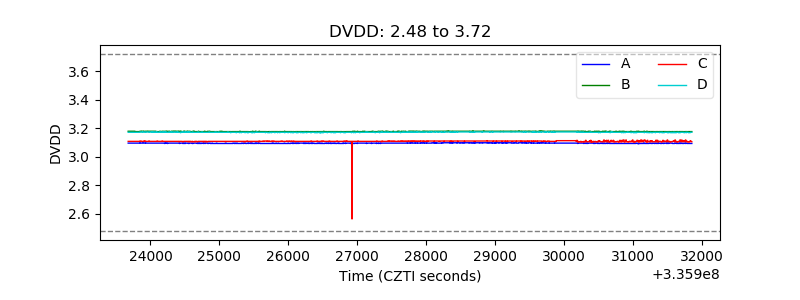 |
| Temperature 1 | 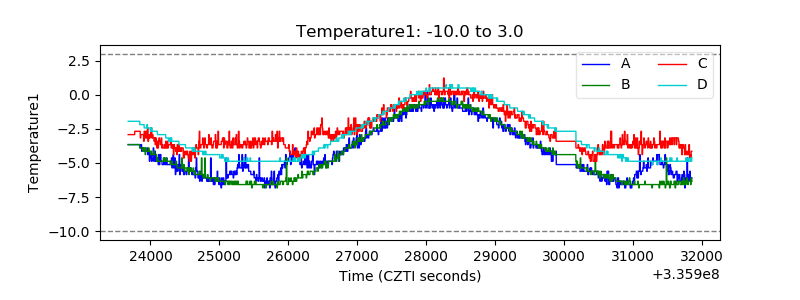 |
| Veto HV Monitor | 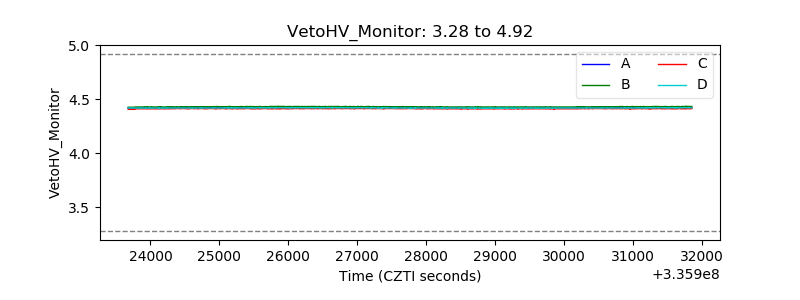 |
| Veto LLD | 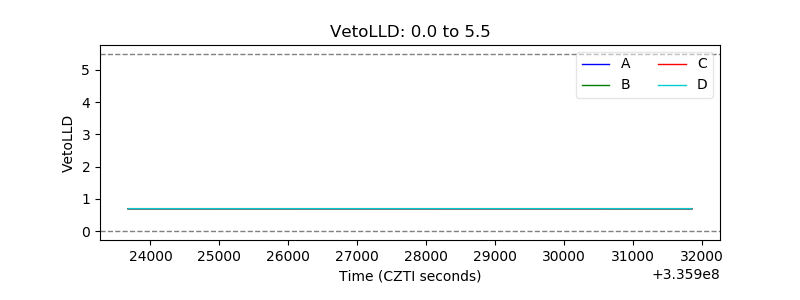 |
| Alpha Counter | 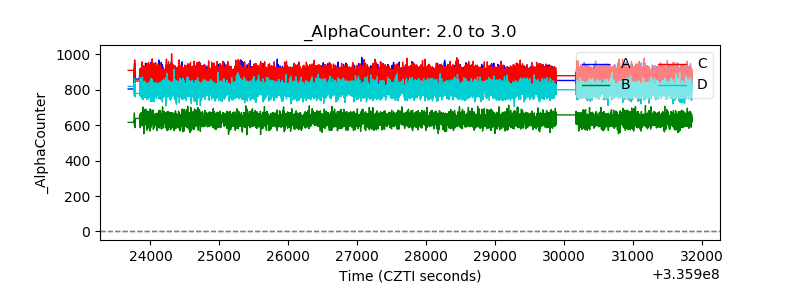 |
| _CPM_Rate | 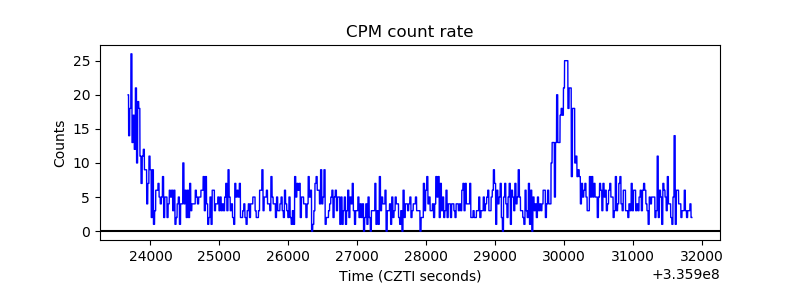 |
| CZT Counter | 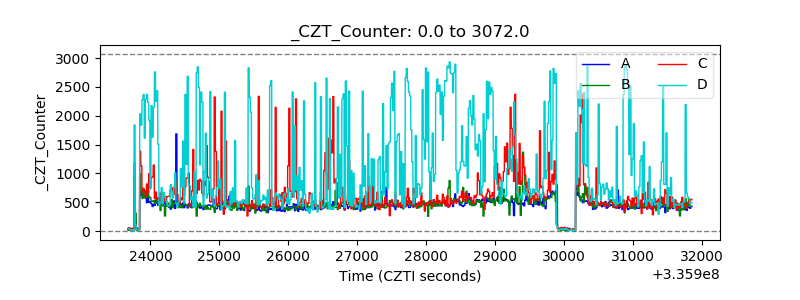 |
| +2.5 Volts monitor |  |
| +5 Volts monitor |  |
| _ROLL_ROT | 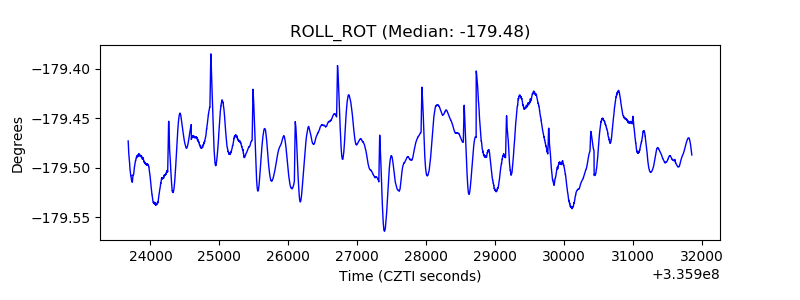 |
| _Roll_DEC |  |
| _Roll_RA | 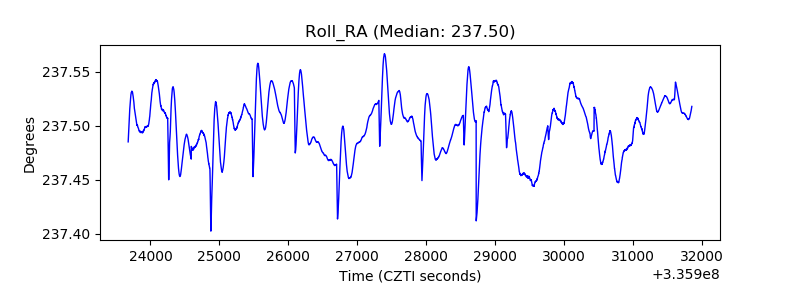 |
| Veto Counter | 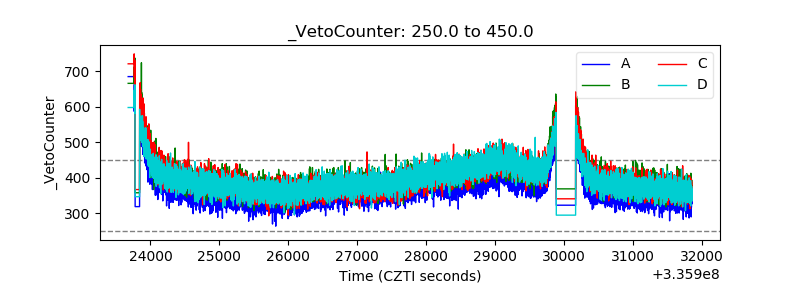 |