| Param | Original file | Final file |
|---|---|---|
| Filename | modeM0/AS1C05_019T04_9000003838_26526cztM0_level2.evt | modeM0/AS1C05_019T04_9000003838_26526cztM0_level2_quad_clean.evt |
| Size (bytes) | 1,549,296,000 | 292,475,520 |
| Size | 1.4 GB | 278.9 MB |
| Events in quadrant A | 8,897,363 | 1,951,152 |
| Events in quadrant B | 9,520,682 | 1,972,670 |
| Events in quadrant C | 10,861,114 | 1,895,642 |
| Events in quadrant D | 16,371,570 | 1,741,827 |
| Mode M9 | |||
|---|---|---|---|
| Quadrant | BADHDUFLAG | Total packets | Discarded packets |
| A | 0 | 20 | 0 |
| B | 0 | 20 | 0 |
| C | 0 | 20 | 0 |
| D | 0 | 20 | 0 |
| Mode M0 | |||
|---|---|---|---|
| Quadrant | BADHDUFLAG | Total packets | Discarded packets |
| A | 0 | 38625 | 0 |
| B | 0 | 40518 | 0 |
| C | 0 | 44515 | 0 |
| D | 0 | 61409 | 0 |
| Quadrant | Total seconds | Saturated seconds | Saturation percentage |
|---|---|---|---|
| A | 18821 | 149 | 0.791669% |
| B | 18822 | 293 | 1.556689% |
| C | 18821 | 472 | 2.507837% |
| D | 18821 | 2191 | 11.641252% |
Noise dominated data is calculated using 1-second bins in cleaned event files. If a bin has >2000 counts, and if more than 50% of those come from <1% of pixels, then it is considered to be noise-dominated and hence unusable.
| Quadrant | # 1 sec bins | Bins with >0 counts | Bins with >2000 counts | High rate bins dominated by noise | Noise dominated (total time) | Noise dominated (detector-on time) | Marked lightcurve |
|---|---|---|---|---|---|---|---|
| A | 20862 | 18823 | 11 | 11 | 0.05% | 0.06% |  |
| B | 20863 | 18824 | 85 | 85 | 0.41% | 0.45% | 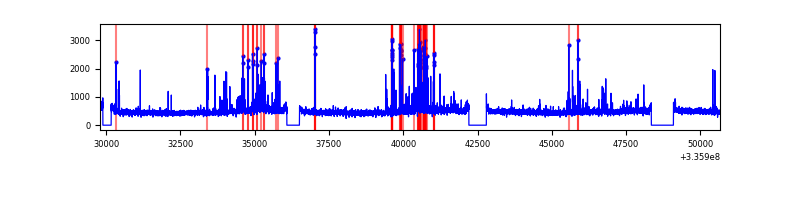 |
| C | 20862 | 18823 | 67 | 67 | 0.32% | 0.36% | 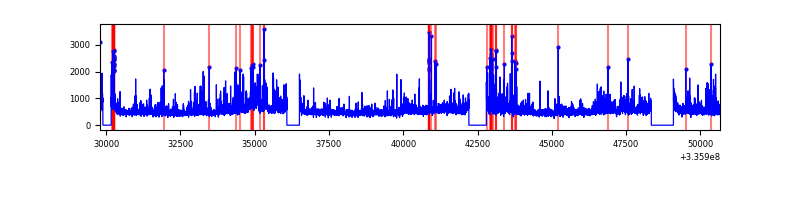 |
| D | 20862 | 18821 | 1895 | 1895 | 9.08% | 10.07% | 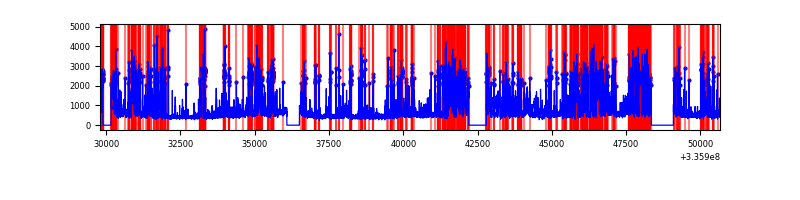 |
Top three noisy pixels from each quadrant. If the there are fewer than three noisy pixels in the level2.evt file, extra rows are filled as -1
| Pixel properties | Quadrant properties | ||||||
|---|---|---|---|---|---|---|---|
| Quadrant | DetID | PixID | Counts | Sigma | Mean | Median | Sigma |
| A | 0 | 13 | 151212 | 333.57 | 2221 | 2170 | 446.8 |
| A | 5 | 168 | 144862 | 319.36 | 2221 | 2170 | 446.8 |
| A | 9 | 130 | 33451 | 70.01 | 2221 | 2170 | 446.8 |
| B | 5 | 172 | 489053 | 1165.68 | 2214 | 2155 | 417.7 |
| B | 3 | 112 | 158921 | 375.31 | 2214 | 2155 | 417.7 |
| B | 15 | 32 | 70668 | 164.03 | 2214 | 2155 | 417.7 |
| C | 3 | 233 | 1781665 | 3584.46 | 2132 | 2142 | 496.5 |
| C | 4 | 254 | 368053 | 737.05 | 2132 | 2142 | 496.5 |
| C | 14 | 238 | 339092 | 678.71 | 2132 | 2142 | 496.5 |
| D | 7 | 80 | 3518839 | 7109.89 | 2039 | 1991 | 494.6 |
| D | 1 | 52 | 3459048 | 6989.02 | 2039 | 1991 | 494.6 |
| D | 12 | 233 | 1184982 | 2391.61 | 2039 | 1991 | 494.6 |
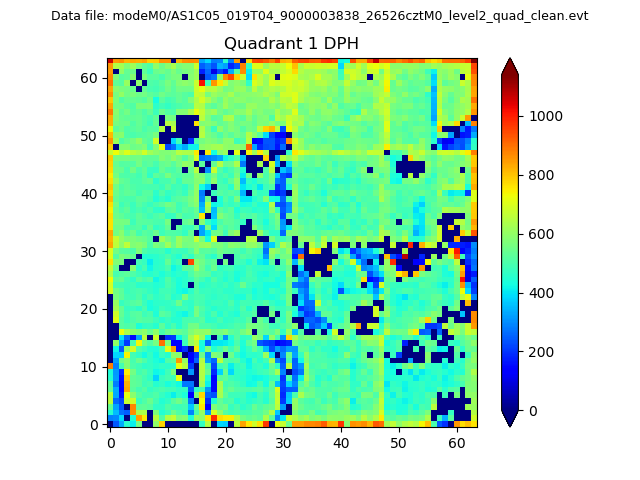
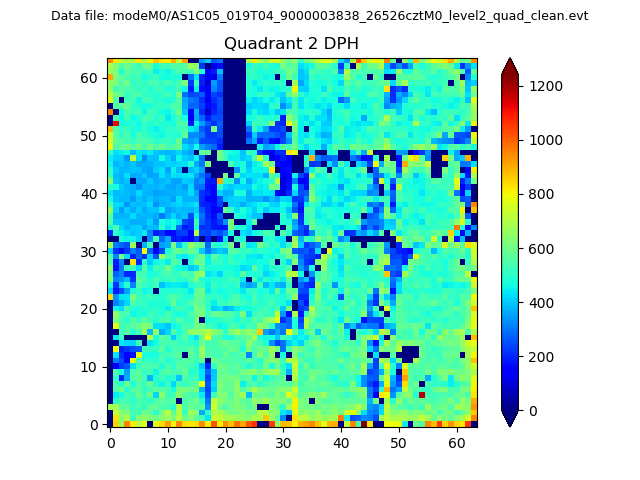
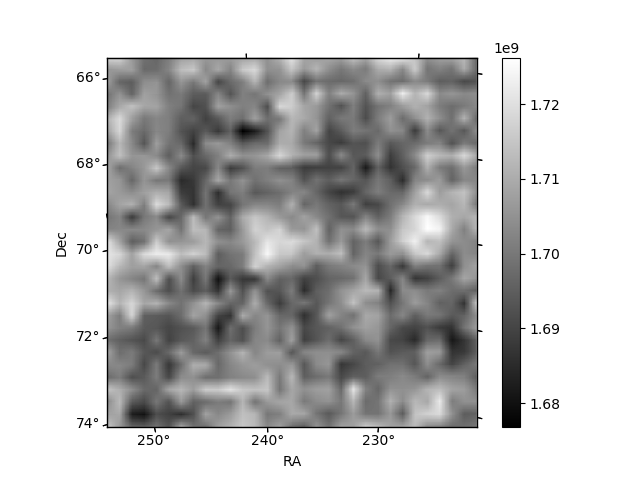
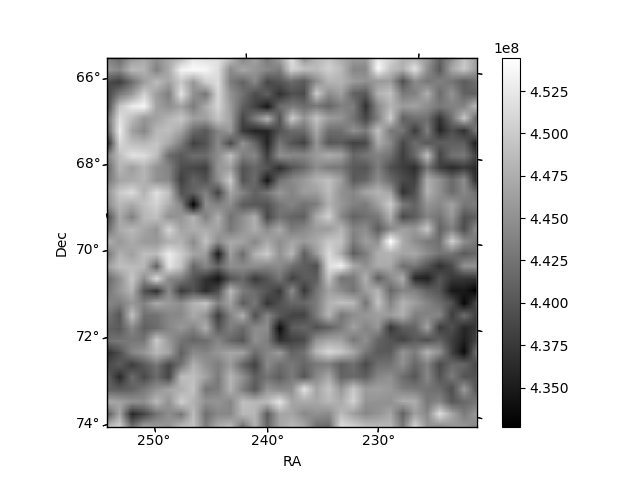
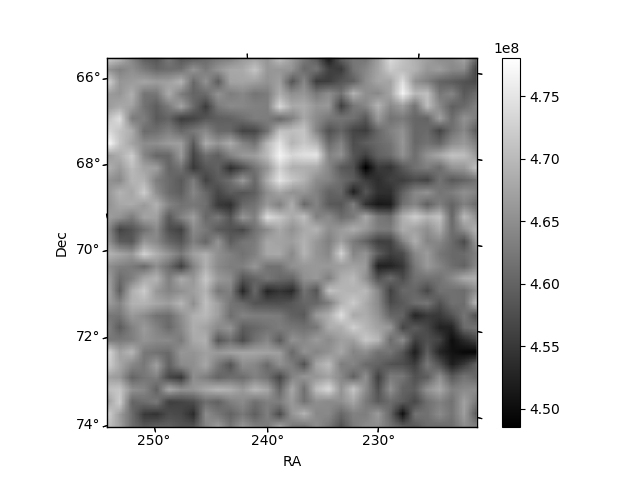
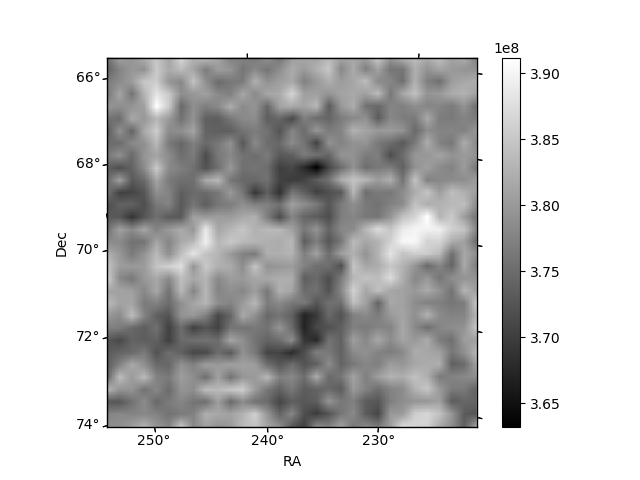
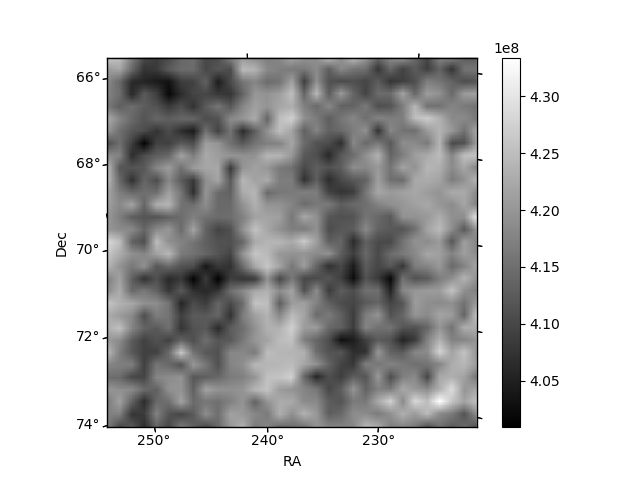
Histogram calculated using DETX and DETY for each event in the final _common_clean file
| Quadrant A | 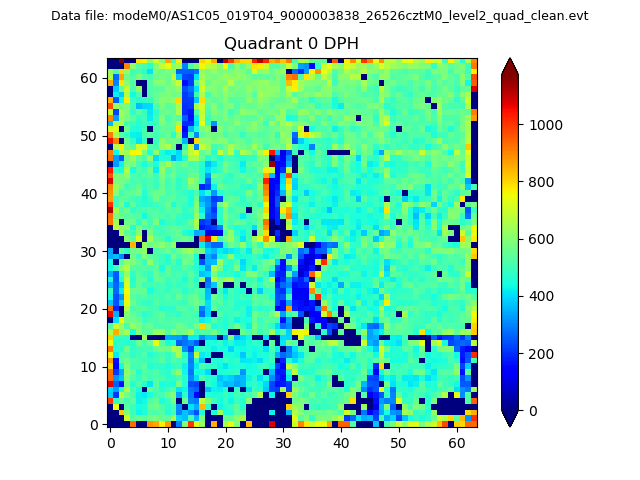 |
 |
Quadrant B |
|---|---|---|---|
| Quadrant D | 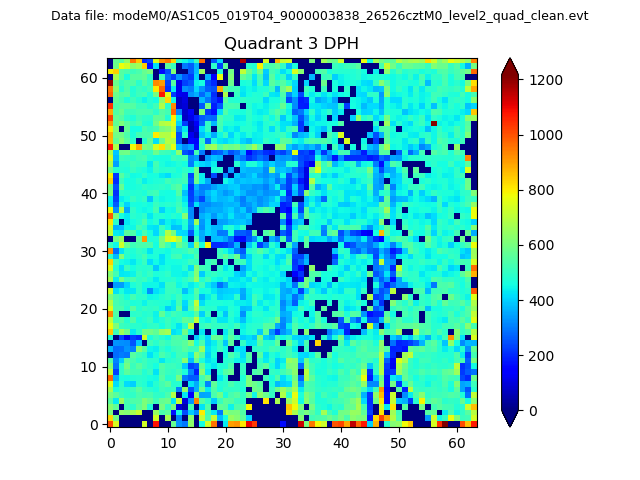 |
 |
Quadrant C |
| Plot type | Count rate plots | Images |
|---|---|---|
| Comparison with Poisson distribution Blue bars denote a histogram of data divided into 1 sec bins. Red curve is a Poisson curve with rate = median count rate of data. |
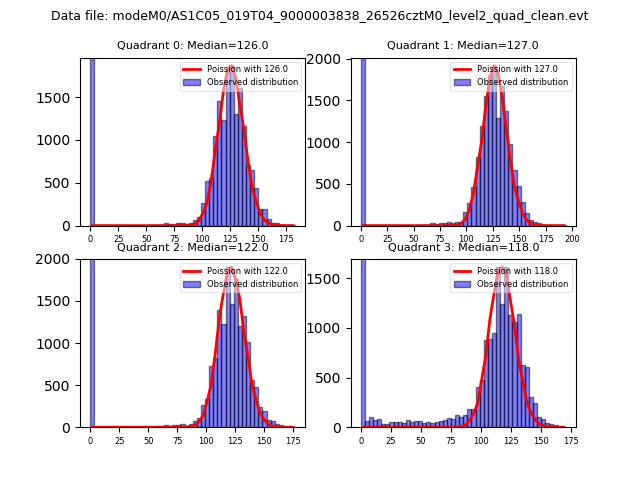 |
 |
| Quadrant-wise count rates Data is divided into 100 sec bins |
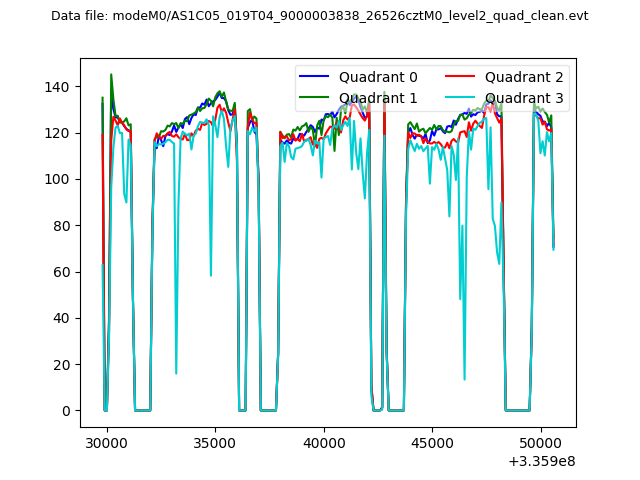 |
|
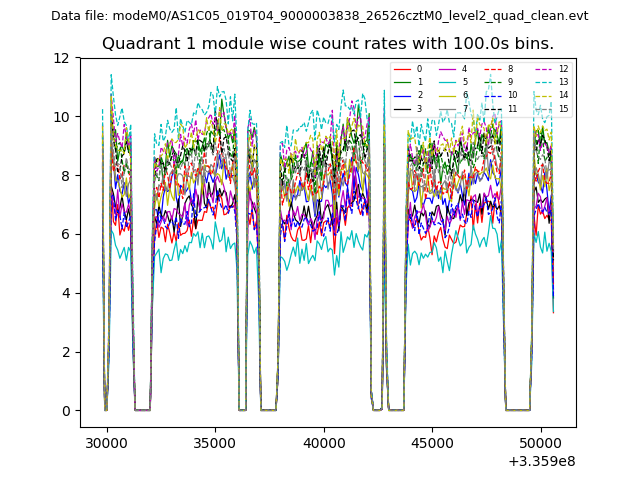
| Module-wise count rates for Quadrant A Data is divided into 100 sec bins |
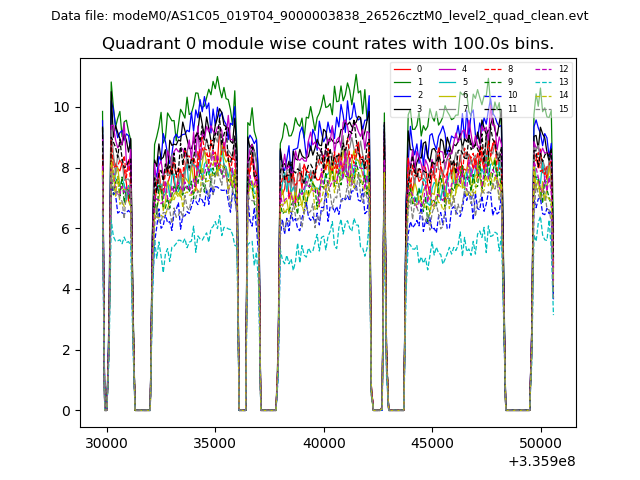 |
 |
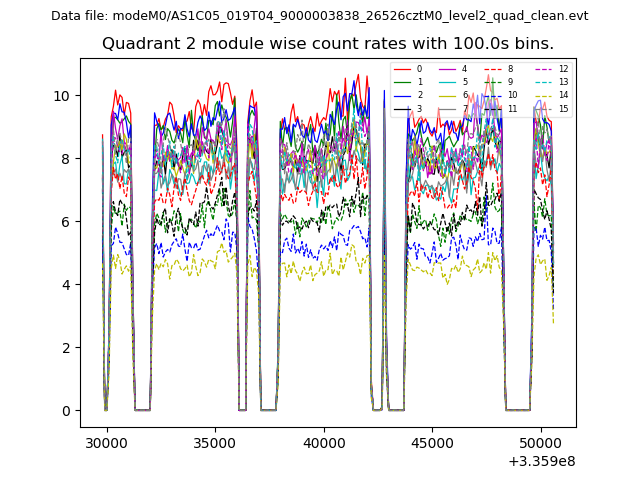
| Module-wise count rates for Quadrant B Data is divided into 100 sec bins |
 |
 |
| Module-wise count rates for Quadrant C Data is divided into 100 sec bins |
 |
 |
| Module-wise count rates for Quadrant D Data is divided into 100 sec bins |
 |
 |
| Parameter | Plot |
|---|---|
| CZT HV Monitor | 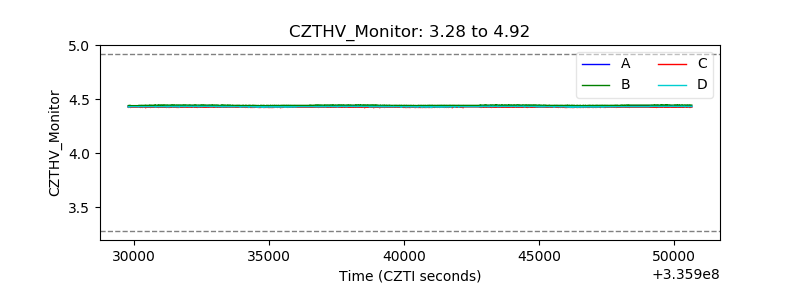 |
| D_VDD | 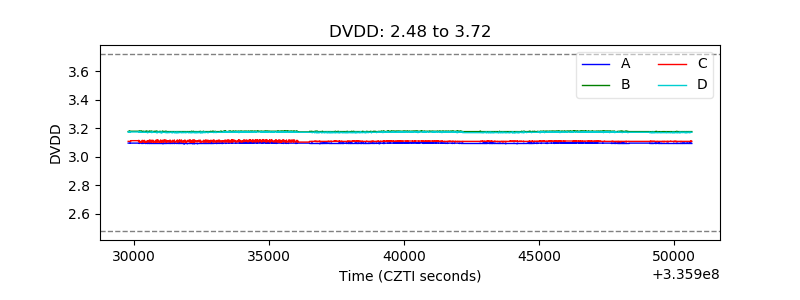 |
| Temperature 1 | 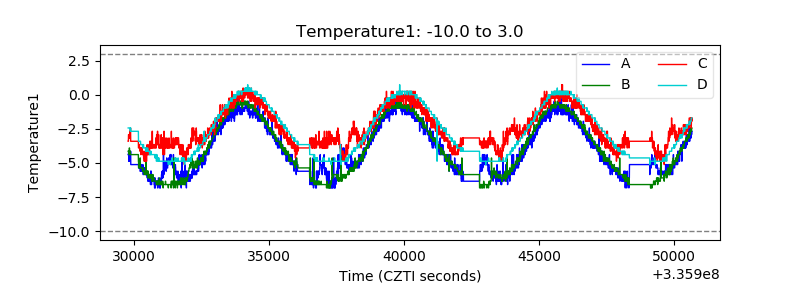 |
| Veto HV Monitor | 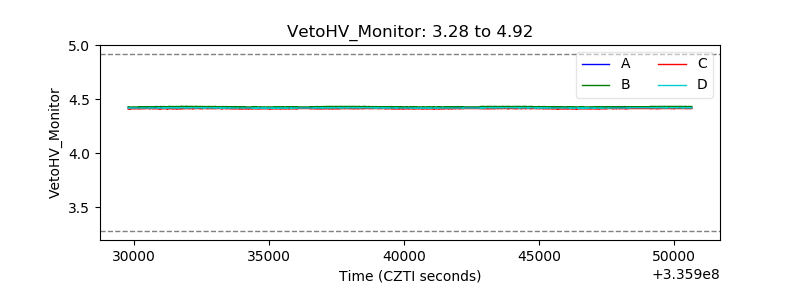 |
| Veto LLD |  |
| Alpha Counter | 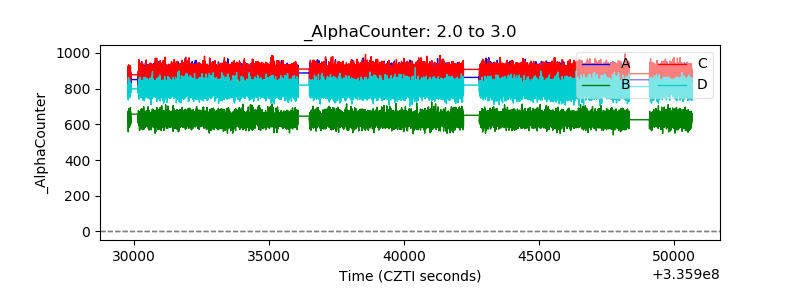 |
| _CPM_Rate | 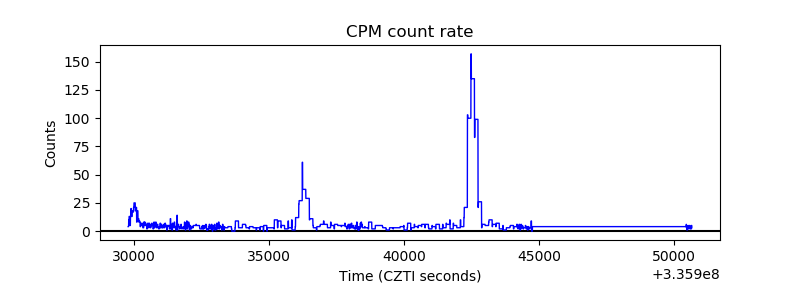 |
| CZT Counter | 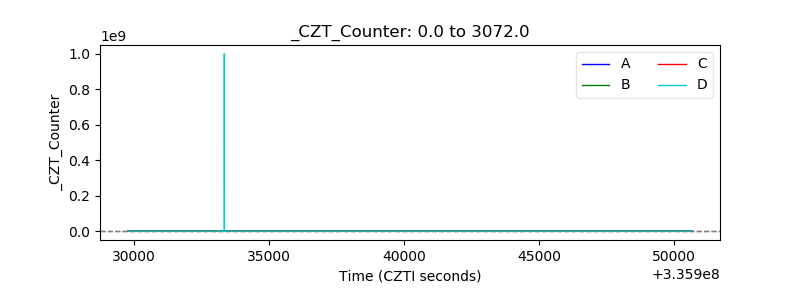 |
| +2.5 Volts monitor |  |
| +5 Volts monitor |  |
| _ROLL_ROT | 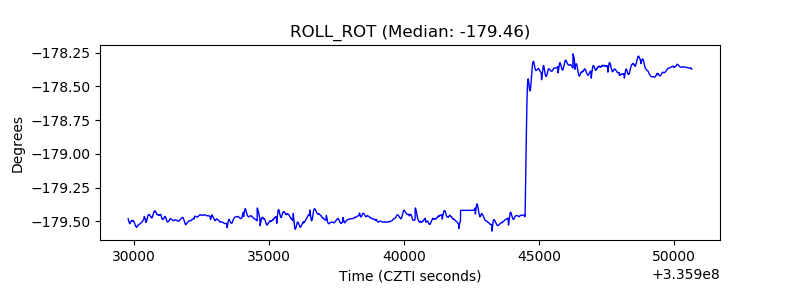 |
| _Roll_DEC | 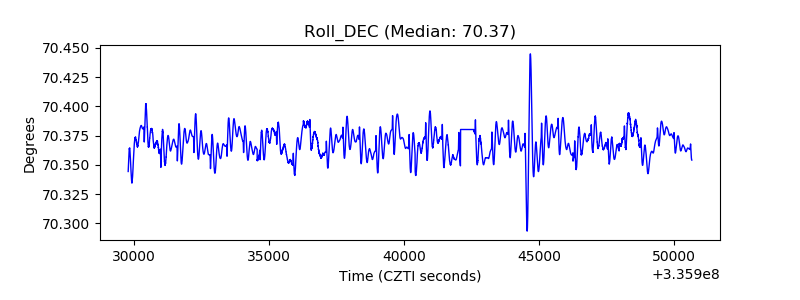 |
| _Roll_RA | 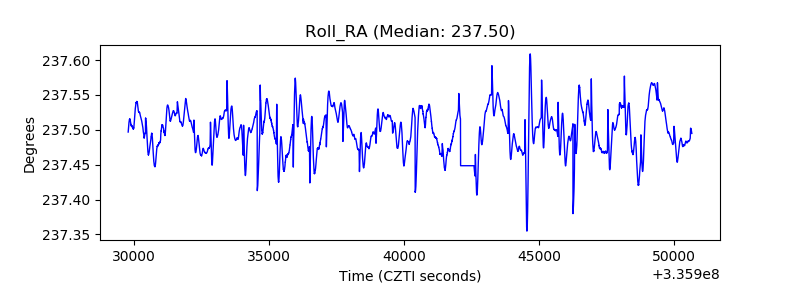 |
| Veto Counter | 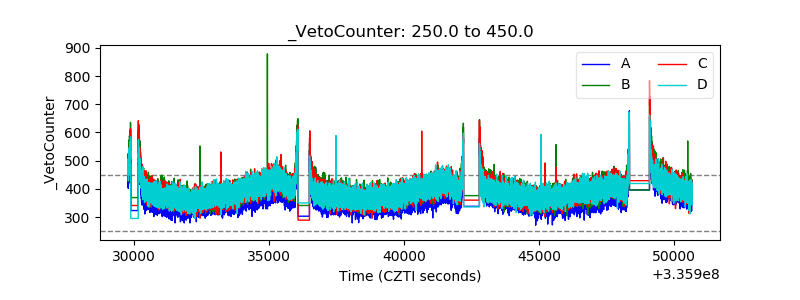 |